Gene set testing for Illumina HumanMethylation Arrays
Comparing the false discovery rate of different methods
Jovana Maksimovic, Alicia Oshlack and Belinda Phipson
April 13, 2021
Last updated: 2021-04-13
Checks: 7 0
Knit directory: methyl-geneset-testing/
This reproducible R Markdown analysis was created with workflowr (version 1.6.2). The Checks tab describes the reproducibility checks that were applied when the results were created. The Past versions tab lists the development history.
Great! Since the R Markdown file has been committed to the Git repository, you know the exact version of the code that produced these results.
Great job! The global environment was empty. Objects defined in the global environment can affect the analysis in your R Markdown file in unknown ways. For reproduciblity it's best to always run the code in an empty environment.
The command set.seed(20200302) was run prior to running the code in the R Markdown file. Setting a seed ensures that any results that rely on randomness, e.g. subsampling or permutations, are reproducible.
Great job! Recording the operating system, R version, and package versions is critical for reproducibility.
Nice! There were no cached chunks for this analysis, so you can be confident that you successfully produced the results during this run.
Great job! Using relative paths to the files within your workflowr project makes it easier to run your code on other machines.
Great! You are using Git for version control. Tracking code development and connecting the code version to the results is critical for reproducibility.
The results in this page were generated with repository version 62fdddc. See the Past versions tab to see a history of the changes made to the R Markdown and HTML files.
Note that you need to be careful to ensure that all relevant files for the analysis have been committed to Git prior to generating the results (you can use wflow_publish or wflow_git_commit). workflowr only checks the R Markdown file, but you know if there are other scripts or data files that it depends on. Below is the status of the Git repository when the results were generated:
Ignored files:
    Ignored:    .DS_Store
    Ignored:    .Rhistory
    Ignored:    .Rproj.user/
    Ignored:    analysis/figures.nb.html
    Ignored:    code/.DS_Store
    Ignored:    code/.Rhistory
    Ignored:    code/.job/
    Ignored:    code/old/
    Ignored:    data/.DS_Store
    Ignored:    data/annotations/
    Ignored:    data/cache-intermediates/
    Ignored:    data/cache-region/
    Ignored:    data/cache-rnaseq/
    Ignored:    data/cache-runtime/
    Ignored:    data/datasets/.DS_Store
    Ignored:    data/datasets/GSE110554-data.RData
    Ignored:    data/datasets/GSE120854/
    Ignored:    data/datasets/GSE120854_RAW.tar
    Ignored:    data/datasets/GSE135446-data.RData
    Ignored:    data/datasets/GSE135446/
    Ignored:    data/datasets/GSE135446_RAW.tar
    Ignored:    data/datasets/GSE45459-data.RData
    Ignored:    data/datasets/GSE45459_Matrix_signal_intensities.txt
    Ignored:    data/datasets/GSE45460/
    Ignored:    data/datasets/GSE45460_RAW.tar
    Ignored:    data/datasets/GSE95460_RAW.tar
    Ignored:    data/datasets/GSE95460_RAW/
    Ignored:    data/datasets/GSE95462-data.RData
    Ignored:    data/datasets/GSE95462/
    Ignored:    data/datasets/GSE95462_RAW/
    Ignored:    data/datasets/SRP100803/
    Ignored:    data/datasets/SRP125125/.DS_Store
    Ignored:    data/datasets/SRP125125/SRR6298*/
    Ignored:    data/datasets/SRP125125/SRR_Acc_List.txt
    Ignored:    data/datasets/SRP125125/SRR_Acc_List_Full.txt
    Ignored:    data/datasets/SRP125125/SraRunTable.txt
    Ignored:    data/datasets/SRP125125/multiqc_data/
    Ignored:    data/datasets/SRP125125/multiqc_report.html
    Ignored:    data/datasets/SRP125125/quants/
    Ignored:    data/datasets/SRP166862/
    Ignored:    data/datasets/SRP217468/
    Ignored:    data/datasets/TCGA.BRCA.rds
    Ignored:    data/datasets/TCGA.KIRC.rds
    Ignored:    data/misc/
    Ignored:    output/.DS_Store
    Ignored:    output/FDR-analysis/
    Ignored:    output/compare-methods/
    Ignored:    output/figures/
    Ignored:    output/methylgsa-params/
    Ignored:    output/outputs.tar.gz
    Ignored:    output/random-cpg-sims/
    Ignored:    output/test/

Untracked files:
    Untracked:  analysis/old/
Note that any generated files, e.g. HTML, png, CSS, etc., are not included in this status report because it is ok for generated content to have uncommitted changes.
These are the previous versions of the repository in which changes were made to the R Markdown (analysis/03_fdrAnalysisBRCA.Rmd) and HTML (docs/03_fdrAnalysisBRCA.html) files. If you've configured a remote Git repository (see ?wflow_git_remote), click on the hyperlinks in the table below to view the files as they were in that past version.
| File | Version | Author | Date | Message |
|---|---|---|---|---|
| Rmd | 5e34ed3 | JovMaksimovic | 2021-04-12 | Figure updates |
| html | 7dac845 | JovMaksimovic | 2021-03-29 | Build site. |
| Rmd | d44c029 | JovMaksimovic | 2021-03-29 | Rename analysis files to reflect addition of new datasets |
library(here)
library(minfi)
library(paletteer)
library(limma)
library(reshape2)
library(missMethyl)
library(ggplot2)
library(glue)
library(tibble)
library(dplyr)
library(curatedTCGAData)
library(MultiAssayExperiment)
library(TCGAutils)
library(DMRcate)
library(patchwork)
source(here("code/utility.R"))
Load data: BRCA
We are using publicly available breast cancer (BRCA) 450k data from The Cancer Genome Atlas (TCGA). We are using only the normal samples to look at false discovery rate (FDR) control by various methylation gene set testing methods.
First, download the data using the curatedTCGAData Bioconductor package and then extract the normal samples. The data is provided as β values with masked data points; data points were masked as “NA” if their detection p-value was greater than 0.05 or the probe was annotated as having a SNP within 10 base pairs or repeat within 15 base pairs or the interrogated CpG. We extract only the 97 normal samples.
brca <- curatedTCGAData(diseaseCode = "BRCA", assays = "Methylation_methyl450",
                        dry.run = FALSE)
brca <- splitAssays(brca, c("11")) # extract only the normal samples
exp <- experiments(brca)[[1]]
meta <- colData(brca)
betas <- as.matrix(assay(exp))
colnames(betas) <- substr(colnames(betas), 1, 12)
m <- match(colnames(betas), meta$patientID)
meta <- meta[m, ]
head(meta[, 1:5])
Quality control
Removed any probes with >1 NA value.
betasNoNA <- betas[rowSums(is.na(betas)) == 0, ]
mds <- plotMDS(betasNoNA, gene.selection = "common", plot = FALSE)
dat <- tibble(x = mds$x, y = mds$y, gender = meta$gender)

ggplot(dat, aes(x = x, y = y, colour = gender)) +
  geom_point() +
  labs(x = "Principal Component 1", y = "Principal Component 2",
       colour = "Sex")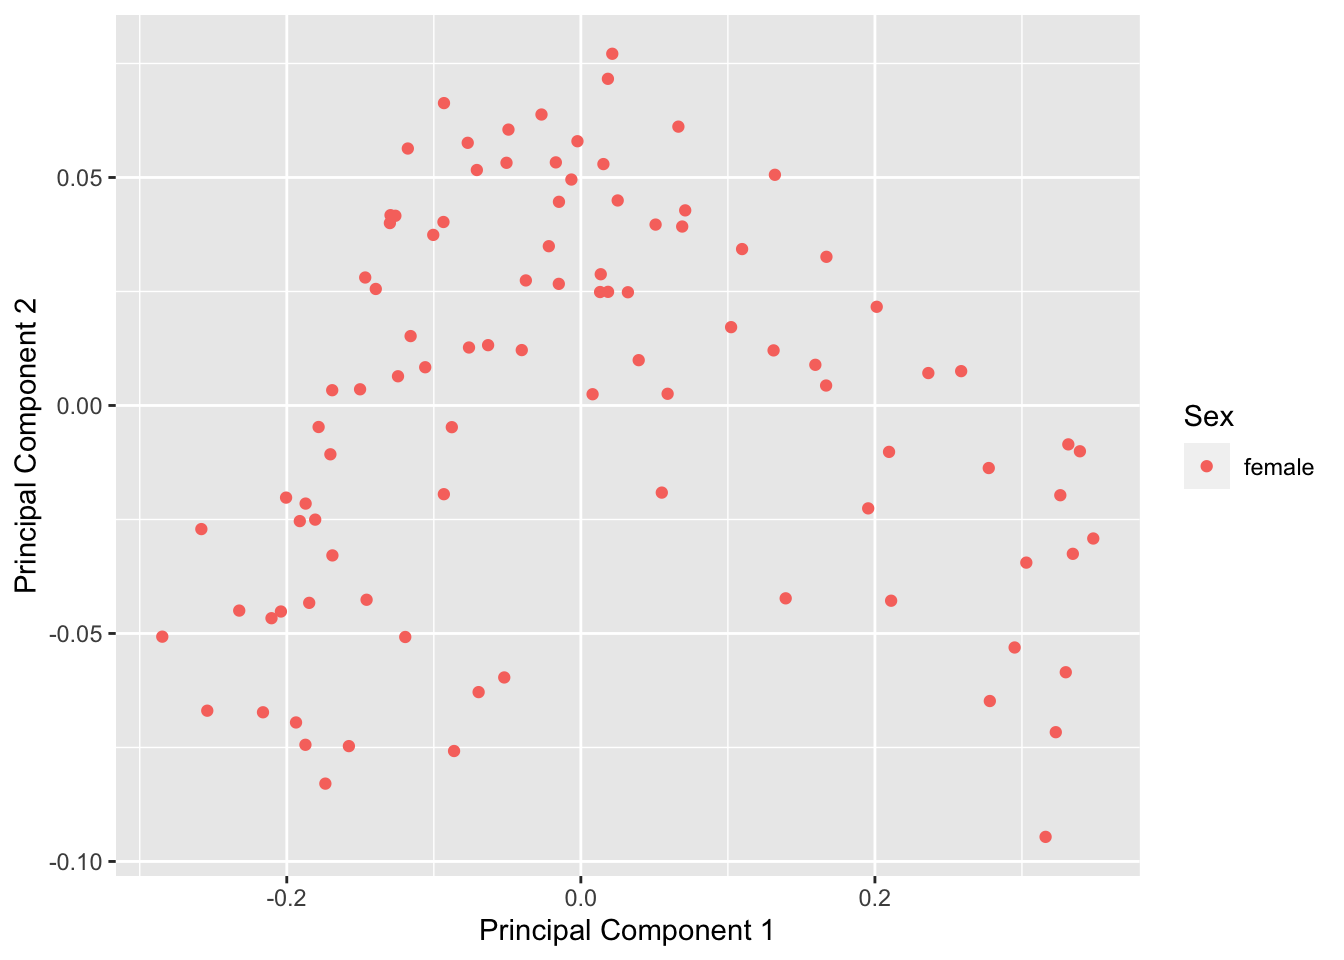
| Version | Author | Date |
|---|---|---|
| 7dac845 | JovMaksimovic | 2021-03-29 |
Remove any remaining SNP-affected probes and multi-mapping probes. We do not remove sex chromosome probes as all the samples are from females. This leaves 371,789 probes for downstream analysis.
betasFlt <- rmSNPandCH(betasNoNA, rmXY = FALSE, rmcrosshyb = TRUE)
dim(betasFlt)
[1] 371789 97The structure of the data looks similar.
mds <- plotMDS(betasFlt, gene.selection = "common", plot = FALSE)
dat <- tibble(x = mds$x, y = mds$y, gender = meta$gender)

pal <- paletteer::paletteer_d("wesanderson::Moonrise3", 2)
cols <- c("female" = pal[2], "male" = pal[1])
p <- ggplot(dat, aes(x = x, y = y, colour = gender)) +
  geom_point(size = 2) +
  labs(x = "Principal Component 1", y = "Principal Component 2",
       colour = "Sex") +
    scale_color_manual(values = cols)
p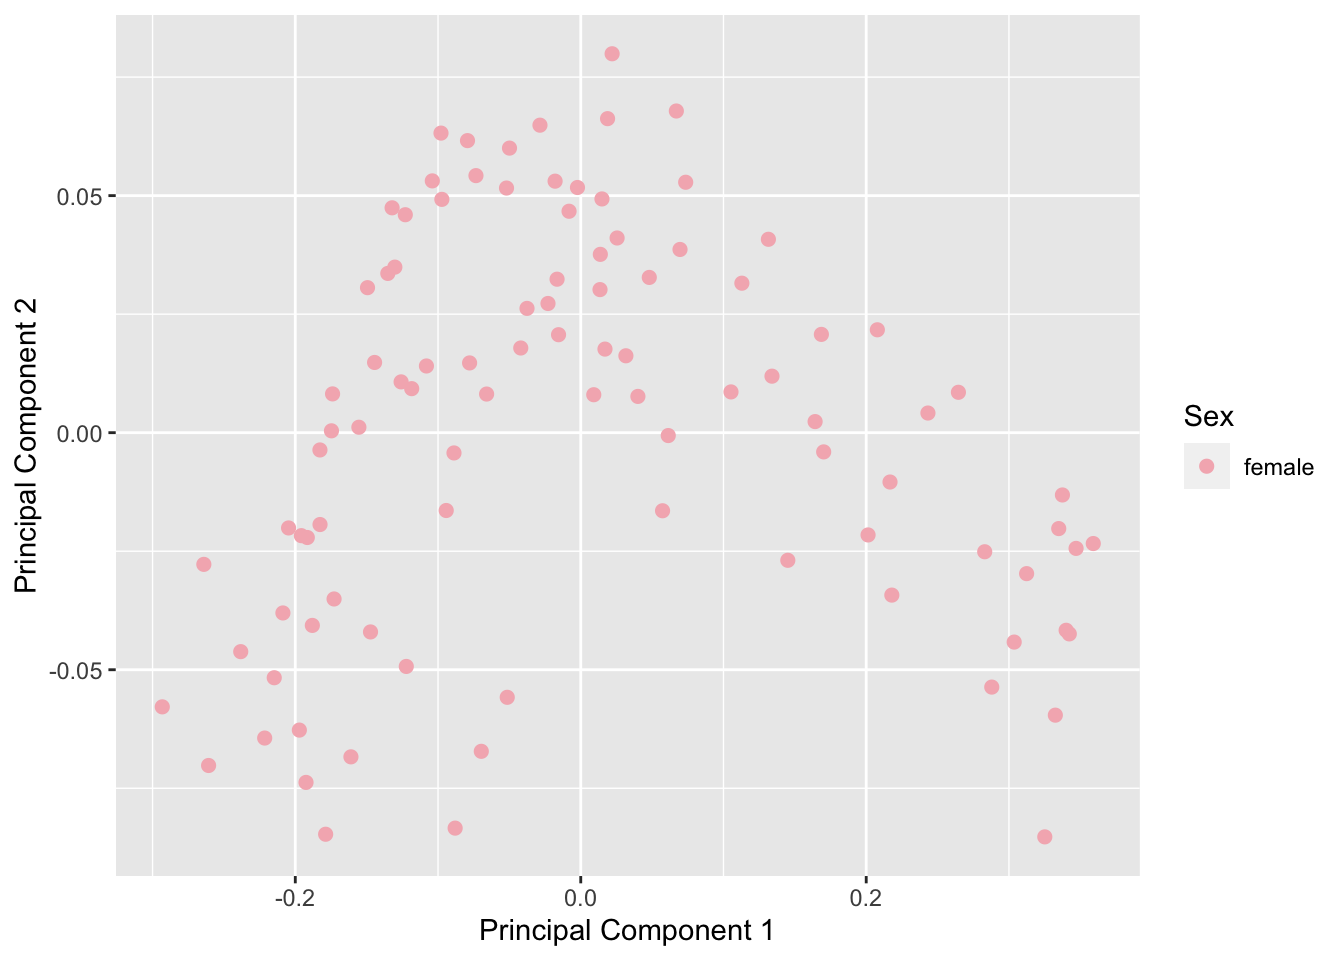
| Version | Author | Date |
|---|---|---|
| 7dac845 | JovMaksimovic | 2021-03-29 |
The density distributions of the beta values for some samples look markedly different to the others.
dat <- as_tibble(melt(betasFlt))
colnames(dat) <- c("cpg", "ID", "beta")

p <- ggplot(dat, aes(x = beta, group = ID)) +
  geom_density(size=0.5, alpha=0.5, show.legend = FALSE)

p + labs(x = "Beta value", y = "Density")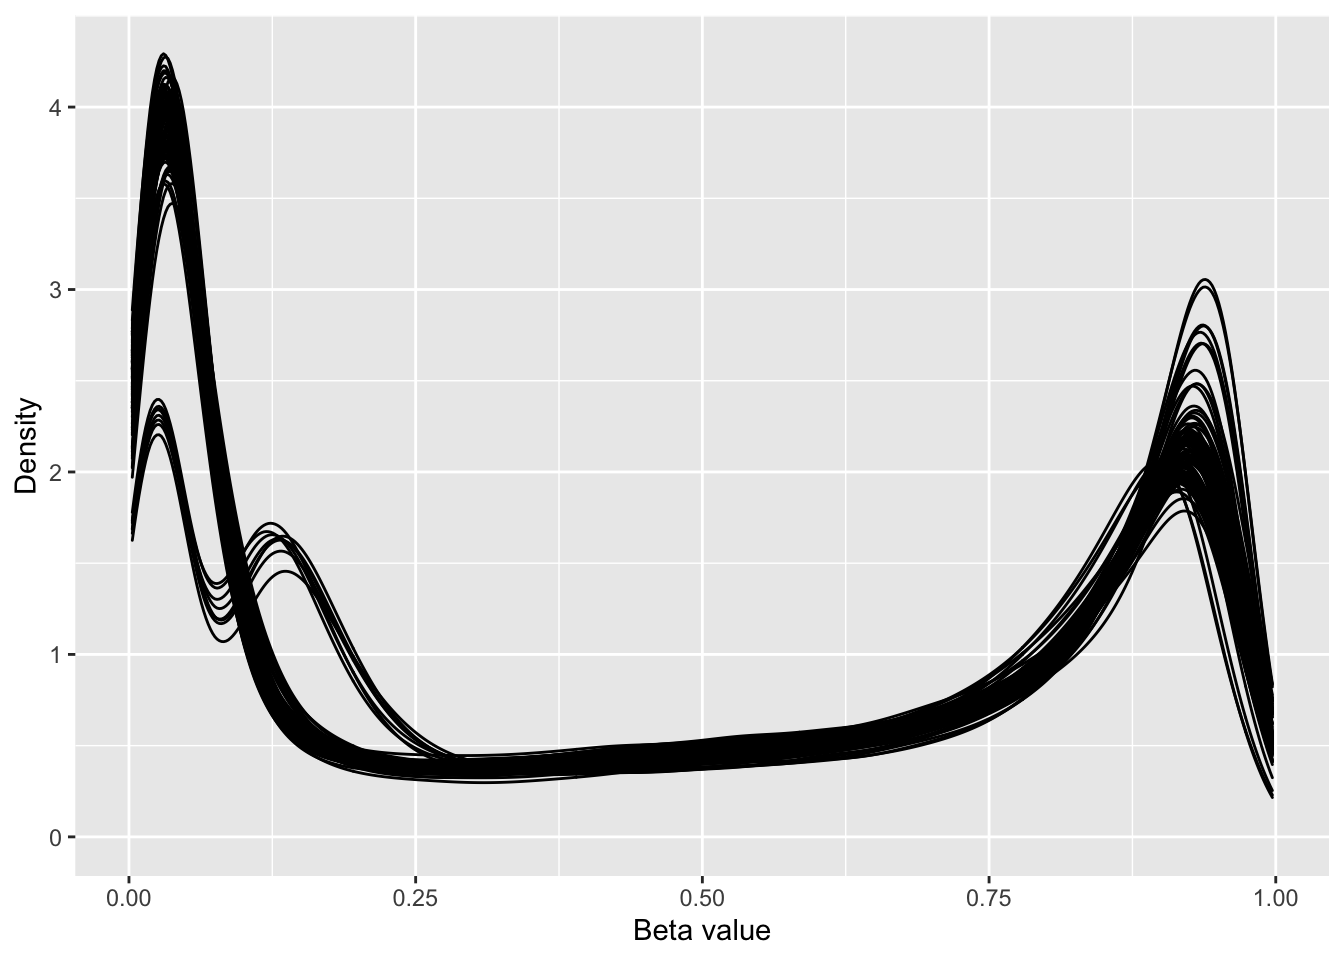
| Version | Author | Date |
|---|---|---|
| 7dac845 | JovMaksimovic | 2021-03-29 |
Calculated the number of modes for the distribution of each sample.
numModes <- apply(betasFlt, 2, find_num_modes, adjust = 1.35)

dat <- as_tibble(melt(betasFlt))
colnames(dat) <- c("cpg", "ID", "beta")
dat$mode <- rep(as.character(numModes), each = nrow(betasFlt))

p <- ggplot(dat, aes(x = beta, colour = mode, group = ID)) +
    geom_density(size=0.5, alpha=0.5) +
    labs(color = "No. modes", x = "Beta value", y = "Density")

p 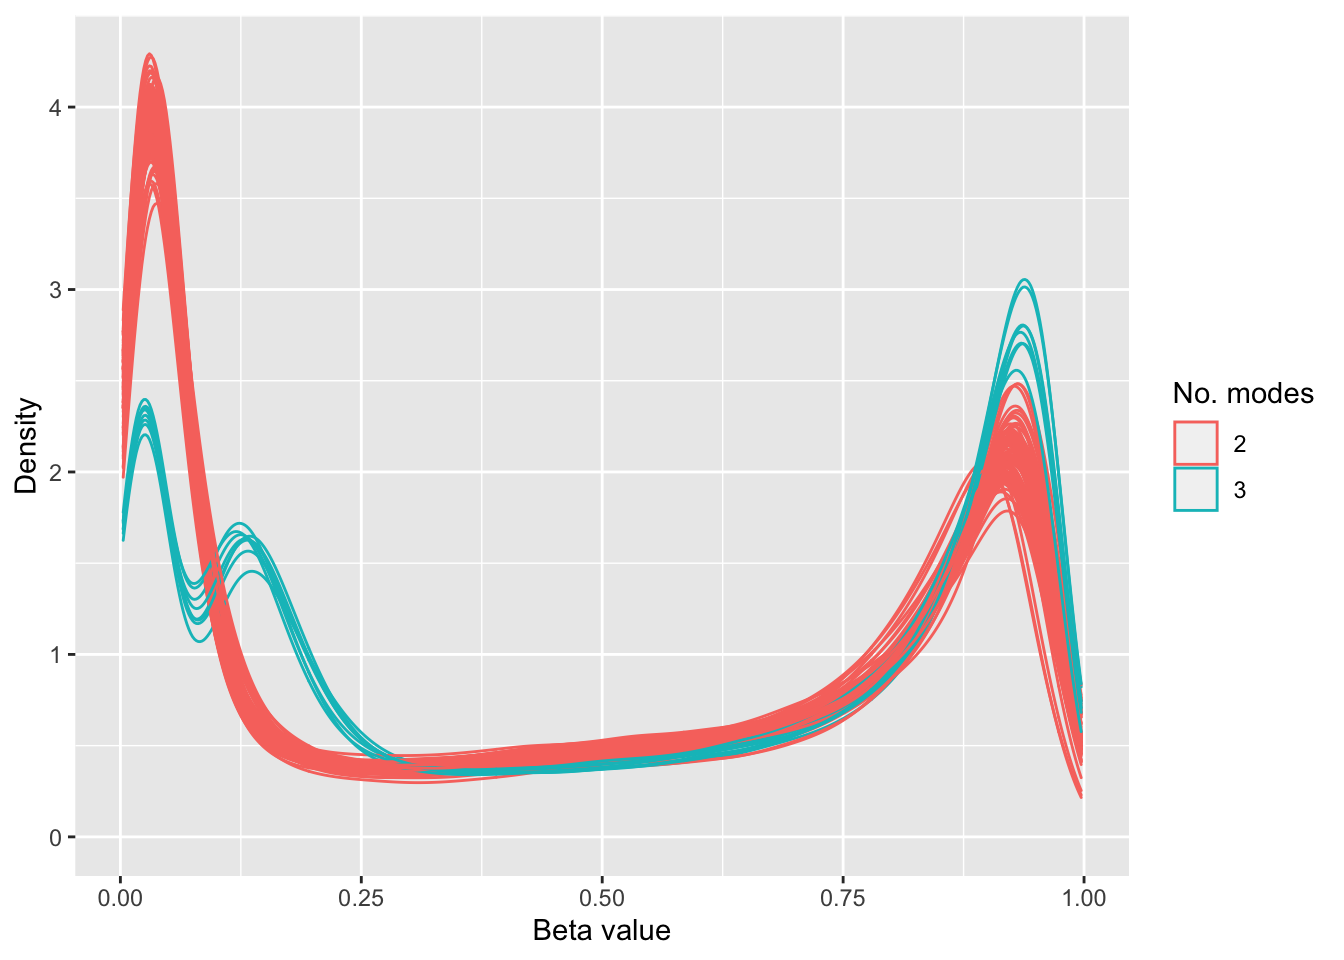
| Version | Author | Date |
|---|---|---|
| 7dac845 | JovMaksimovic | 2021-03-29 |
Colour the MDS plot by the number of modes to confirm outlying samples.
dims <- list(c(1,2), c(2,3), c(1,3), c(3,4))
p <- vector("list", 4)

for(i in 1:length(p)){
    mds <- plotMDS(betasFlt, gene.selection = "common", plot = FALSE,
               dim.plot = dims[[i]])
    dat <- tibble(x = mds$x, y = mds$y, mode = as.character(numModes))

    p[[i]] <- ggplot(dat, aes(x = x, y = y, colour = mode)) +
        geom_point(size = 2) +
        labs(x = glue("Principal Component {dims[[i]][1]}") ,
             y = glue("Principal Component {dims[[i]][2]}"),
             colour = "No. Modes")

}

(p[[1]] + p[[2]]) /
    (p[[3]] + p[[4]])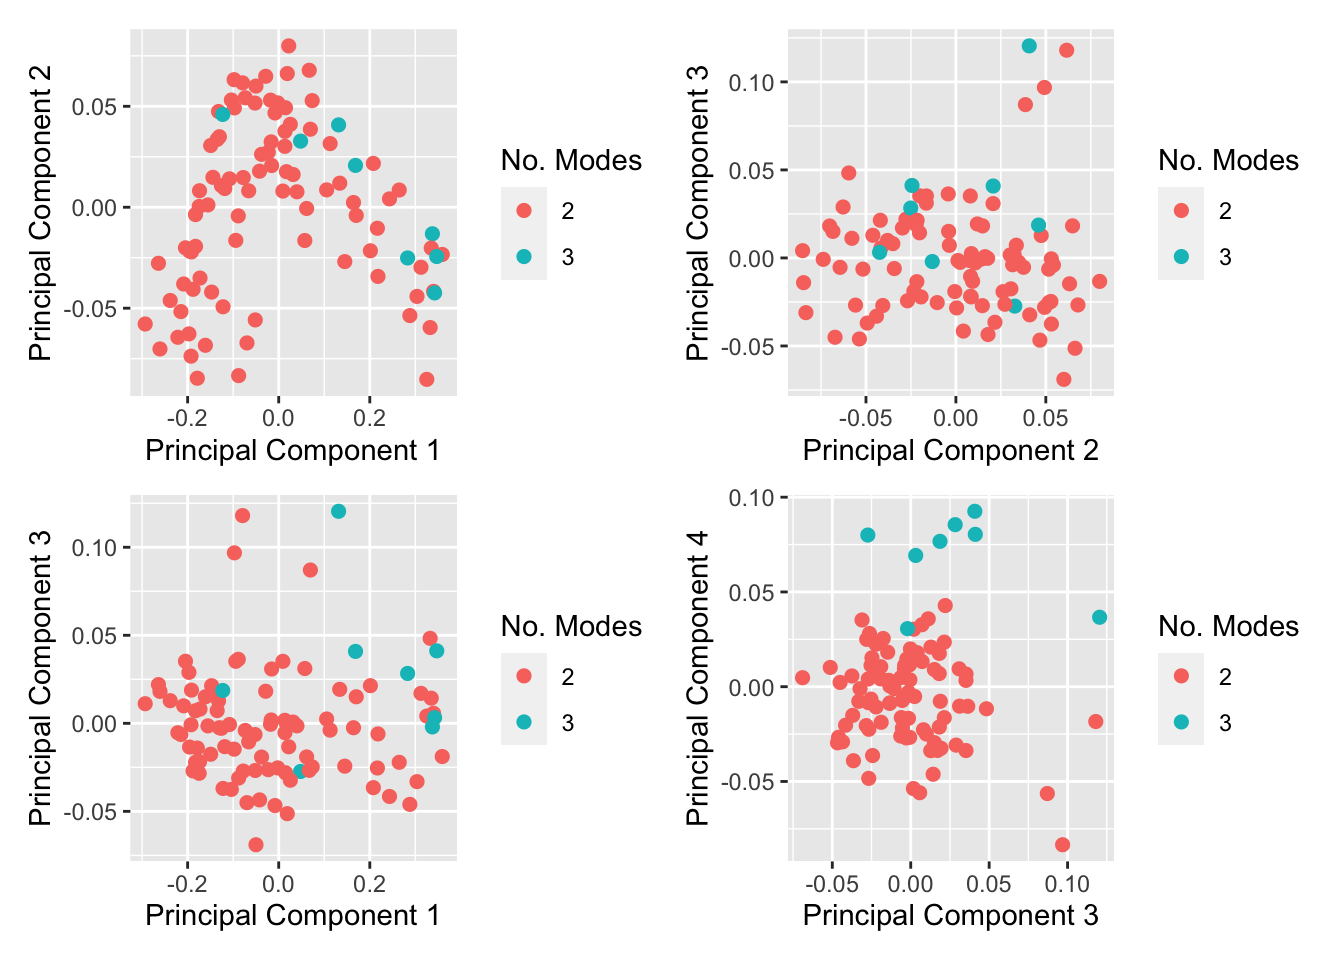
| Version | Author | Date |
|---|---|---|
| 7dac845 | JovMaksimovic | 2021-03-29 |
Colour MDS plot using different variables to explore any further structure in the data.
mds <- plotMDS(betasFlt, gene.selection = "common", plot = FALSE,
               dim.plot = c(1,3))
dat <- tibble(x = mds$x, y = mds$y, gender = meta$gender)

dat$age <- meta$years_to_birth
dat$race <- sub(" or", "\nor", meta$race)
dat$ethnicity <- sub(" or", "\nor", meta$ethnicity)

a <- ggplot(dat, aes(x = x, y = y, colour = age)) +
  geom_point() +
  labs(x = "Principal Component 1", y = "Principal Component 3",
       colour = "Age") +
  viridis::scale_color_viridis(direction = -1)

b <- ggplot(dat, aes(x = x, y = y, colour = race)) +
  geom_point() +
  labs(x = "Principal Component 1", y = "Principal Component 3",
       colour = "Race") +
  theme(legend.text = element_text(size = 7))

c <- ggplot(dat, aes(x = x, y = y, colour = ethnicity)) +
  geom_point() +
  labs(x = "Principal Component 1", y = "Principal Component 3",
       colour = "Ethnicity")  +
  theme(legend.text = element_text(size = 7))

(b + c) / a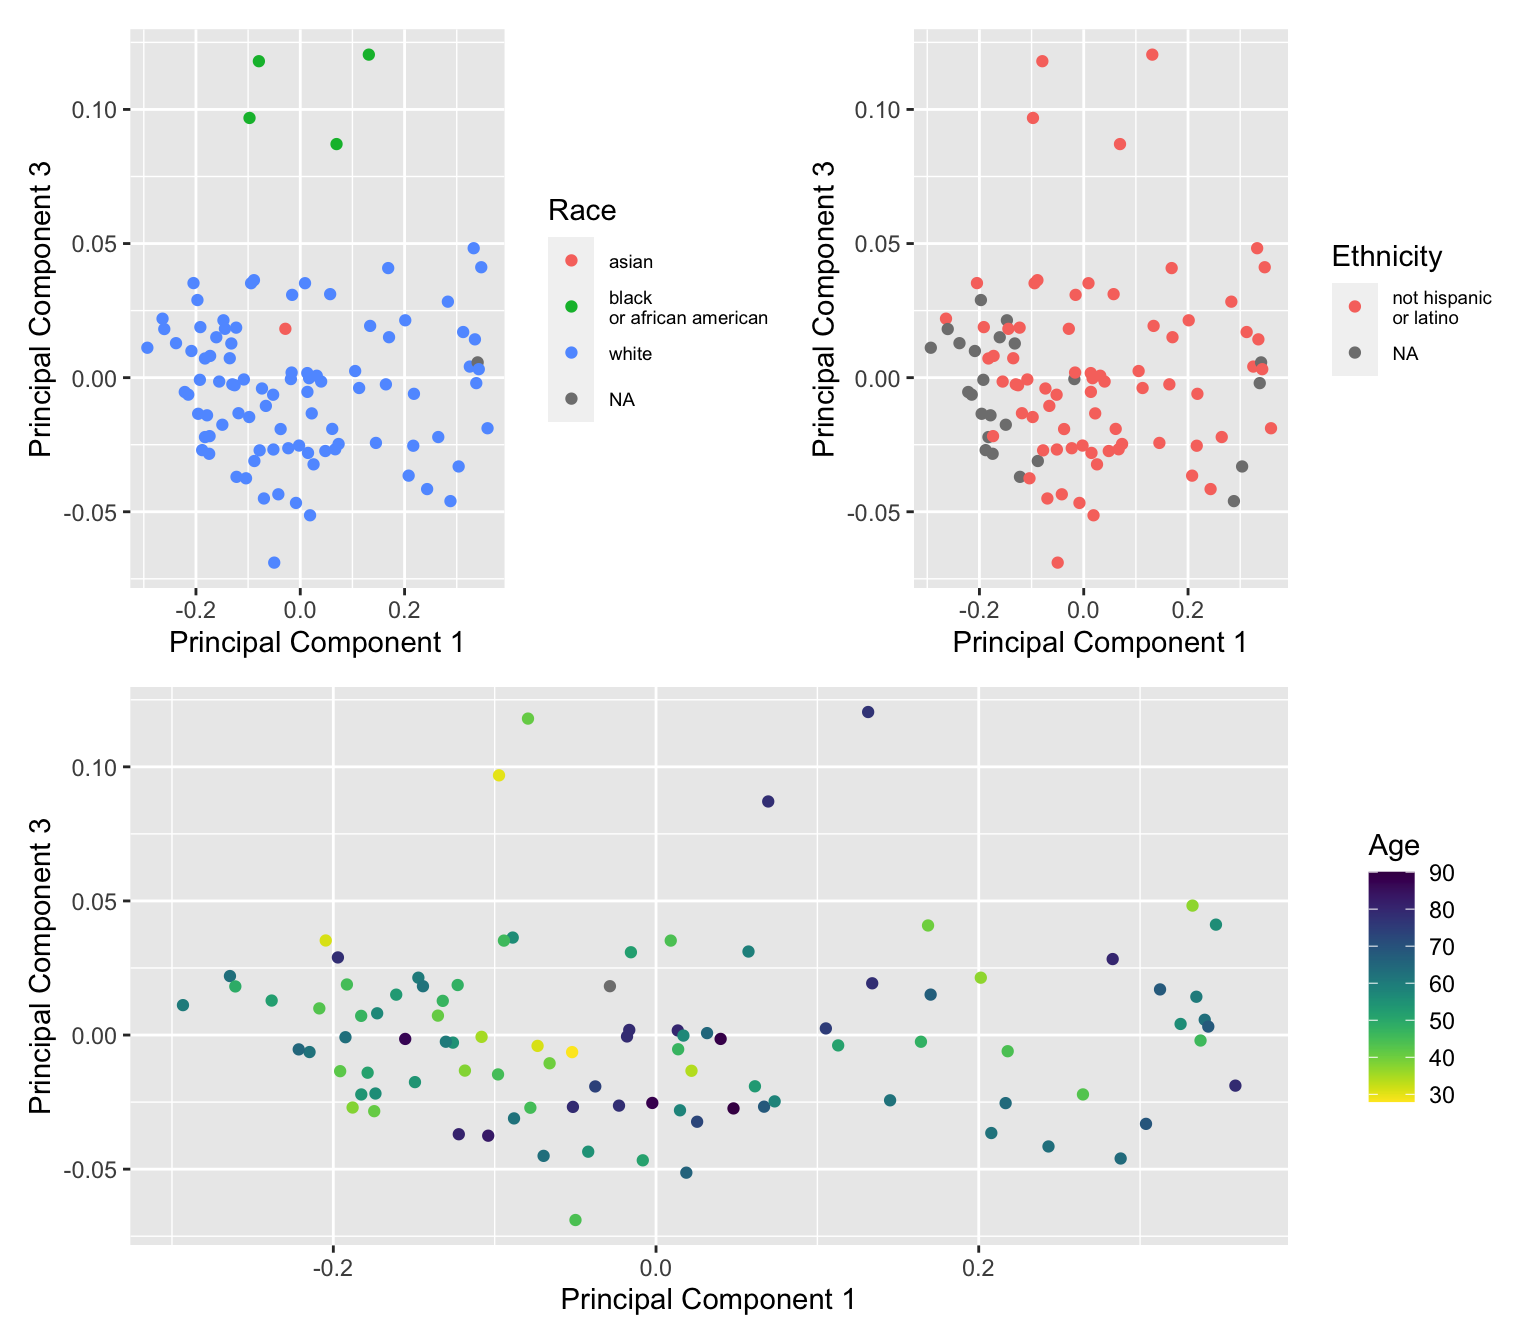
| Version | Author | Date |
|---|---|---|
| 7dac845 | JovMaksimovic | 2021-03-29 |
Remove samples with more than 2 modes in their density distributions and "black or african american" samples.
keep <- numModes == 2 & meta$race != "black or african american" & !is.na(meta$race)
betasFlt <- betasFlt[, keep]
meta <- meta[keep, ]
Examine the structure of data after removal of outlier samples.
mds <- plotMDS(betasFlt, gene.selection = "common", plot = FALSE)
dat <- tibble(x = mds$x, y = mds$y, gender = meta$gender)
dat$age <- meta$years_to_birth

p1 <- ggplot(dat, aes(x = x, y = y, colour = age)) +
  geom_point() +
  labs(x = "Principal Component 1", y = "Principal Component 3",
       colour = "Age") +
  viridis::scale_color_viridis(direction = -1)

mds <- plotMDS(betasFlt, gene.selection = "common", plot = FALSE,
               dim.plot = c(1,3))
dat <- tibble(x = mds$x, y = mds$y)

p2 <- ggplot(dat, aes(x = x, y = y)) +
  geom_point(size = 2) +
  labs(x = "Principal Component 1", y = "Principal Component 3")

dat <- as_tibble(melt(betasFlt))
colnames(dat) <- c("cpg", "ID", "beta")

p3 <- ggplot(dat, aes(x = beta, group = ID)) +
    geom_density(size = 0.5, alpha = 0.5) +
    labs(x = "Beta value", y = "Density")

(p1 + p2) / p3 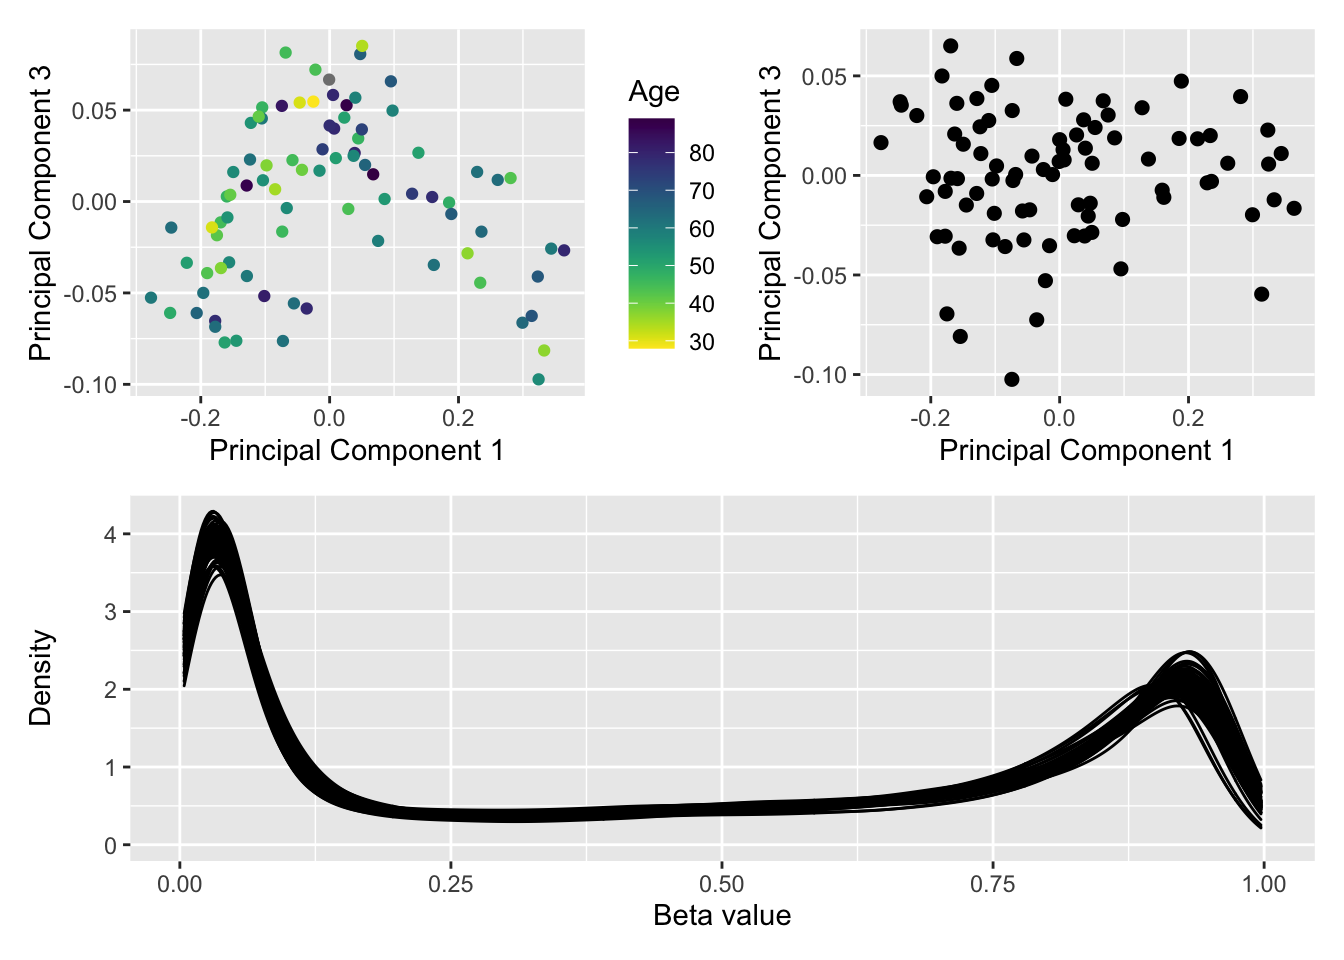
| Version | Author | Date |
|---|---|---|
| 7dac845 | JovMaksimovic | 2021-03-29 |
Save figure for use in manuscript.
fig <- here("output/figures/SFig-3C.rds")
saveRDS(p1 + theme(legend.position = "bottom"), fig, compress = FALSE)
Save the filtered TCGA BRCA data for use in subsequent FDR analysis.
outFile <- here("data/datasets/TCGA.BRCA.rds")

if(!file.exists(outFile)){
    saveRDS(betasFlt, file = outFile)
}
FDR analysis: BRCA
We randomly select 5, 10, 20, 40 samples per "group" from the TCGA BRCA normal samples and then perform differential methylation analysis between the two "groups". We do this 100 times for each "group" size. There should be no significant differential methylation between the groups as the data contains no signal. Consequently, we expect about 5% false gene set discoveries across the 100 simulations from methods that are "holding their size".
We compare GOmeth (with top 1000 and 5000 ranked CpGs from the DM analysis selected as "significant"), methylglm (mGLM), methylRRA-ORA (mRRA (ORA)), methylRRA-GSEA (mRRA (GSEA)) from the MethylGSA package and ebGSEA. The BROAD MSigDB gene sets provided with ChAMP package were used for this analysis.
Load the results of the FDR simulations.
broad <- readRDS(here("output/FDR-analysis/BROAD-sets.rds"))
noGenes <- data.frame(noGenes = sapply(broad$entrez, length))

inFile <- here("output/FDR-analysis/FDR.BRCA.analysis.rds")
if(file.exists(inFile)) dat <- as_tibble(readRDS(inFile))
The plots below shows that mRRA (ORA) does not control the FDR very well as the median proportion of p-value 0.05 for the 100 simulations is greater than 0.5. mRRA (GSEA) does better, although its median FDR is still relatively high at around 0.25. mGLM has good FDR control with median FDR at around 0.05. ebGSEA is only slightly anti-conservative using both the Wilcox test (WT) and Known Population Median test (KPMT) with a median FDR at around 0.06-0.08. GOmeth is very consistent although somewhat conservative with a median FDR at around 0.02-0.03.
dat %>%
  #left_join(rownames_to_column(noGenes), by = c("ID" = "rowname")) %>%
  #filter(noGenes >= 1) %>%
  mutate(method = unname(dict[method])) %>%
  group_by(simNo, sampleNo, method) %>%
  summarise(psig = sum(pvalue < 0.05)/length(pvalue)) %>%
  mutate(sampleOrd = as.integer(sampleNo)) -> sigDat
`summarise()` has grouped output by 'simNo', 'sampleNo'. You can override using the `.groups` argument.p <- ggplot(sigDat, aes(x = reorder(sampleNo, sampleOrd), y = psig,
fill = method)) +
geom_violin(scale = "width", width = 0.8, size = 0.3) +
stat_summary(geom = "point", size = 0.5, color = "white",
position = position_dodge(0.8),
show.legend = FALSE, fun = median) +
geom_hline(yintercept=0.05, linetype="dashed", color = "red") +
labs(y="Prop. gene sets with p-value < 0.05", x="No. samples per group",
fill="Method") +
scale_fill_manual(values = methodCols) +
facet_grid(cols = vars(sampleOrd), scales = "free_x") +
theme(strip.background = element_blank(),
strip.text = element_blank())
p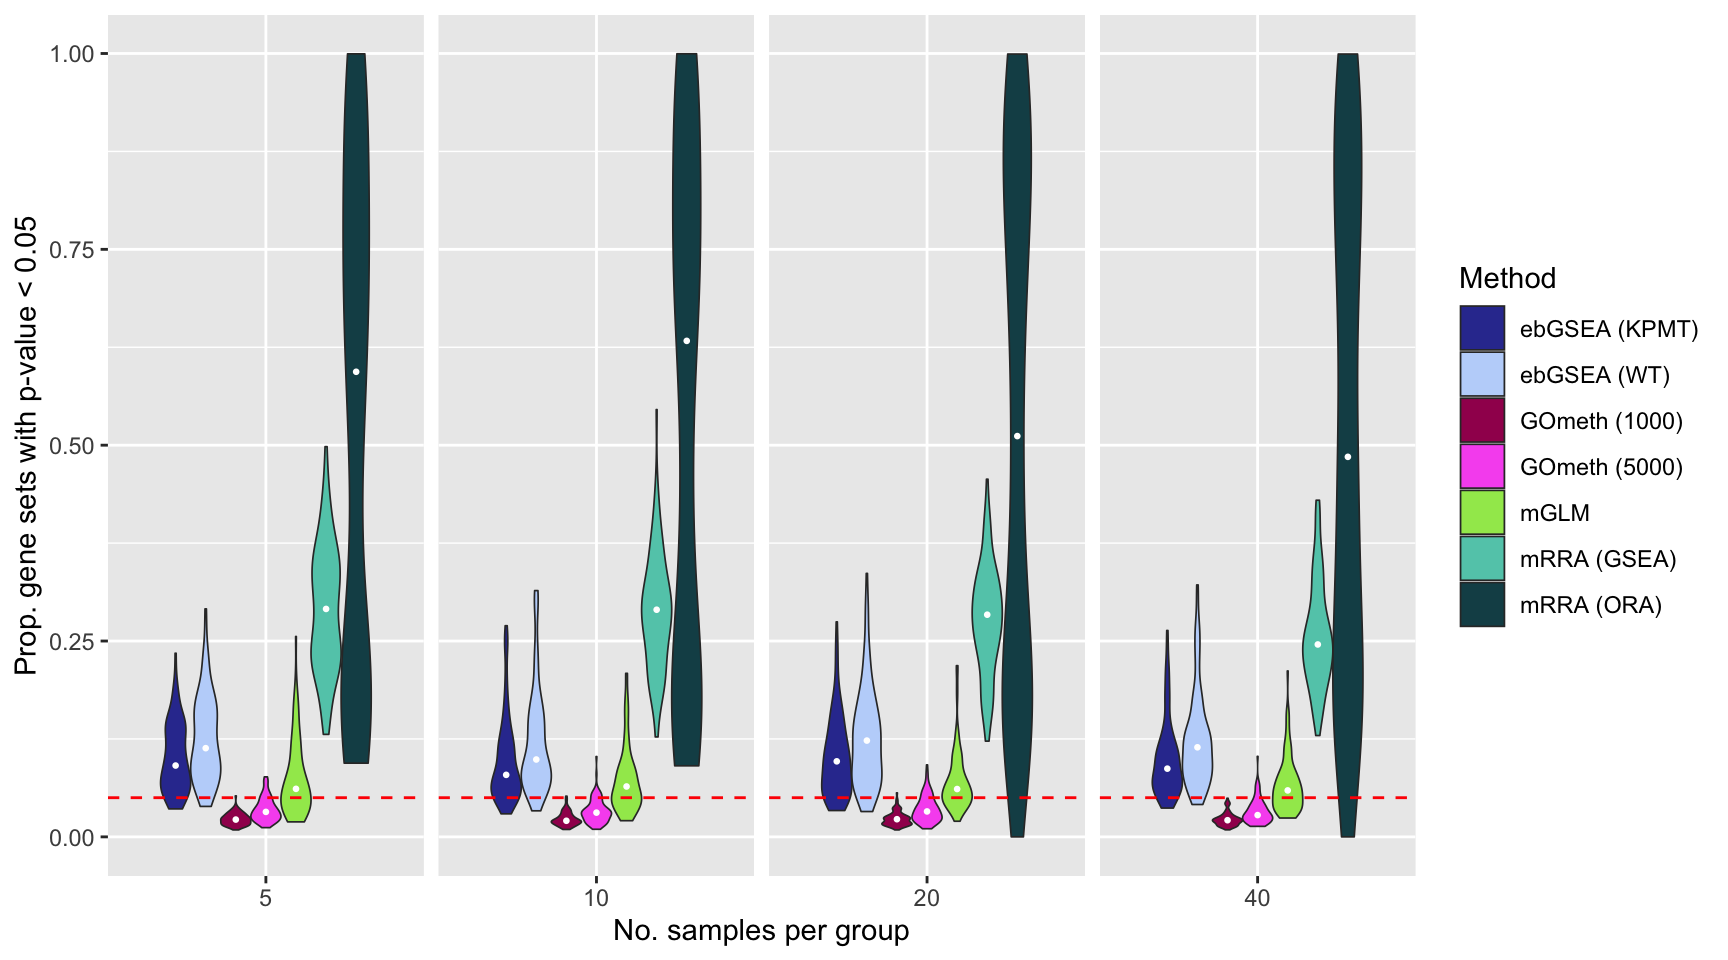
Save figure for use in manuscript.
fig <- here("output/figures/SFig-3D.rds")
saveRDS(p, fig, compress = FALSE)
sessionInfo()R version 4.0.3 (2020-10-10)
Platform: x86_64-apple-darwin17.0 (64-bit)
Running under: macOS Mojave 10.14.6
Matrix products: default
BLAS: /Library/Frameworks/R.framework/Versions/4.0/Resources/lib/libRblas.dylib
LAPACK: /Library/Frameworks/R.framework/Versions/4.0/Resources/lib/libRlapack.dylib
locale:
[1] en_AU.UTF-8/en_AU.UTF-8/en_AU.UTF-8/C/en_AU.UTF-8/en_AU.UTF-8
attached base packages:
[1] stats4 parallel stats graphics grDevices utils datasets
[8] methods base
other attached packages:
[1] DMRcatedata_2.8.2
[2] ExperimentHub_1.16.0
[3] AnnotationHub_2.22.0
[4] BiocFileCache_1.14.0
[5] dbplyr_2.1.1
[6] rhdf5_2.34.0
[7] patchwork_1.1.1
[8] DMRcate_2.4.1
[9] TCGAutils_1.10.0
[10] curatedTCGAData_1.12.0
[11] MultiAssayExperiment_1.16.0
[12] dplyr_1.0.5
[13] tibble_3.1.0
[14] glue_1.4.2
[15] ggplot2_3.3.3
[16] missMethyl_1.24.0
[17] IlluminaHumanMethylationEPICanno.ilm10b4.hg19_0.6.0
[18] IlluminaHumanMethylation450kanno.ilmn12.hg19_0.6.0
[19] reshape2_1.4.4
[20] limma_3.46.0
[21] paletteer_1.3.0
[22] minfi_1.36.0
[23] bumphunter_1.32.0
[24] locfit_1.5-9.4
[25] iterators_1.0.13
[26] foreach_1.5.1
[27] Biostrings_2.58.0
[28] XVector_0.30.0
[29] SummarizedExperiment_1.20.0
[30] Biobase_2.50.0
[31] MatrixGenerics_1.2.1
[32] matrixStats_0.58.0
[33] GenomicRanges_1.42.0
[34] GenomeInfoDb_1.26.7
[35] IRanges_2.24.1
[36] S4Vectors_0.28.1
[37] BiocGenerics_0.36.0
[38] here_1.0.1
[39] workflowr_1.6.2
loaded via a namespace (and not attached):
[1] utf8_1.2.1 R.utils_2.10.1
[3] tidyselect_1.1.0 htmlwidgets_1.5.3
[5] RSQLite_2.2.5 AnnotationDbi_1.52.0
[7] grid_4.0.3 BiocParallel_1.24.1
[9] munsell_0.5.0 codetools_0.2-18
[11] preprocessCore_1.52.1 statmod_1.4.35
[13] withr_2.4.1 colorspace_2.0-0
[15] highr_0.8 knitr_1.31
[17] rstudioapi_0.13 labeling_0.4.2
[19] git2r_0.28.0 GenomeInfoDbData_1.2.4
[21] farver_2.1.0 bit64_4.0.5
[23] rprojroot_2.0.2 vctrs_0.3.7
[25] generics_0.1.0 xfun_0.22
[27] biovizBase_1.38.0 R6_2.5.0
[29] illuminaio_0.32.0 AnnotationFilter_1.14.0
[31] bitops_1.0-6 rhdf5filters_1.2.0
[33] cachem_1.0.4 reshape_0.8.8
[35] DelayedArray_0.16.3 assertthat_0.2.1
[37] bsseq_1.26.0 promises_1.2.0.1
[39] scales_1.1.1 nnet_7.3-15
[41] gtable_0.3.0 ensembldb_2.14.0
[43] rlang_0.4.10 genefilter_1.72.1
[45] splines_4.0.3 lazyeval_0.2.2
[47] rtracklayer_1.50.0 DSS_2.38.0
[49] GEOquery_2.58.0 dichromat_2.0-0
[51] prismatic_1.0.0 checkmate_2.0.0
[53] BiocManager_1.30.12 yaml_2.2.1
[55] backports_1.2.1 GenomicFeatures_1.42.3
[57] httpuv_1.5.5 Hmisc_4.5-0
[59] tools_4.0.3 nor1mix_1.3-0
[61] ellipsis_0.3.1 jquerylib_0.1.3
[63] RColorBrewer_1.1-2 siggenes_1.64.0
[65] Rcpp_1.0.6 plyr_1.8.6
[67] base64enc_0.1-3 sparseMatrixStats_1.2.1
[69] progress_1.2.2 zlibbioc_1.36.0
[71] purrr_0.3.4 RCurl_1.98-1.3
[73] prettyunits_1.1.1 rpart_4.1-15
[75] openssl_1.4.3 viridis_0.5.1
[77] cluster_2.1.1 fs_1.5.0
[79] magrittr_2.0.1 data.table_1.14.0
[81] whisker_0.4 ProtGenerics_1.22.0
[83] hms_1.0.0 mime_0.10
[85] evaluate_0.14 xtable_1.8-4
[87] XML_3.99-0.6 jpeg_0.1-8.1
[89] readxl_1.3.1 mclust_5.4.7
[91] gridExtra_2.3 compiler_4.0.3
[93] biomaRt_2.46.3 crayon_1.4.1
[95] R.oo_1.24.0 htmltools_0.5.1.1
[97] later_1.1.0.1 Formula_1.2-4
[99] tidyr_1.1.3 DBI_1.1.1
[101] MASS_7.3-53.1 rappdirs_0.3.3
[103] Matrix_1.3-2 readr_1.4.0
[105] permute_0.9-5 R.methodsS3_1.8.1
[107] quadprog_1.5-8 Gviz_1.34.1
[109] pkgconfig_2.0.3 GenomicAlignments_1.26.0
[111] foreign_0.8-81 xml2_1.3.2
[113] annotate_1.68.0 bslib_0.2.4
[115] rngtools_1.5 multtest_2.46.0
[117] beanplot_1.2 rvest_1.0.0
[119] doRNG_1.8.2 scrime_1.3.5
[121] VariantAnnotation_1.36.0 stringr_1.4.0
[123] digest_0.6.27 cellranger_1.1.0
[125] rmarkdown_2.7 base64_2.0
[127] htmlTable_2.1.0 edgeR_3.32.1
[129] DelayedMatrixStats_1.12.3 curl_4.3
[131] gtools_3.8.2 shiny_1.6.0
[133] Rsamtools_2.6.0 lifecycle_1.0.0
[135] nlme_3.1-152 GenomicDataCommons_1.14.0
[137] jsonlite_1.7.2 Rhdf5lib_1.12.1
[139] viridisLite_0.3.0 askpass_1.1
[141] BSgenome_1.58.0 fansi_0.4.2
[143] pillar_1.5.1 lattice_0.20-41
[145] fastmap_1.1.0 httr_1.4.2
[147] survival_3.2-10 interactiveDisplayBase_1.28.0
[149] png_0.1-7 BiocVersion_3.12.0
[151] bit_4.0.4 stringi_1.5.3
[153] sass_0.3.1 HDF5Array_1.18.1
[155] rematch2_2.1.2 blob_1.2.1
[157] org.Hs.eg.db_3.12.0 latticeExtra_0.6-29
[159] memoise_2.0.0