B-ALL Experiment 2: C369 MRD Analysis
ETV6::RUNX1 MRD blast detection, pre-leukaemic clone characterisation, and Figures 4I–J assembly
2026-08-25
Last updated: 2026-08-25
Checks: 7 0
Knit directory: flex-fusion-probes/
This reproducible R Markdown analysis was created with workflowr (version 1.7.1). The Checks tab describes the reproducibility checks that were applied when the results were created. The Past versions tab lists the development history.
Great! Since the R Markdown file has been committed to the Git repository, you know the exact version of the code that produced these results.
Great job! The global environment was empty. Objects defined in the global environment can affect the analysis in your R Markdown file in unknown ways. For reproduciblity it’s best to always run the code in an empty environment.
The command set.seed(20240925) was run prior to running
the code in the R Markdown file. Setting a seed ensures that any results
that rely on randomness, e.g. subsampling or permutations, are
reproducible.
Great job! Recording the operating system, R version, and package versions is critical for reproducibility.
Nice! There were no cached chunks for this analysis, so you can be confident that you successfully produced the results during this run.
Great job! Using relative paths to the files within your workflowr project makes it easier to run your code on other machines.
Great! You are using Git for version control. Tracking code development and connecting the code version to the results is critical for reproducibility.
The results in this page were generated with repository version f5aa6c9. See the Past versions tab to see a history of the changes made to the R Markdown and HTML files.
Note that you need to be careful to ensure that all relevant files for
the analysis have been committed to Git prior to generating the results
(you can use wflow_publish or
wflow_git_commit). workflowr only checks the R Markdown
file, but you know if there are other scripts or data files that it
depends on. Below is the status of the Git repository when the results
were generated:
Ignored files:
    Ignored:    .DS_Store
    Ignored:    .Rhistory
    Ignored:    .Rproj.user/
    Ignored:    analysis/.gitignore
    Ignored:    analysis/B-ALL_exp2_nonblast_fusion_analysis_cache/
    Ignored:    analysis/obsolete/B-ALL_nonblast_fusion_analysis_cache/
    Ignored:    analysis/projectionFigures/
    Ignored:    code/files/
    Ignored:    data/.DS_Store
    Ignored:    data/BoneMarrowMap/
    Ignored:    data/BoneMarrowMapBoneMarrowMap_SymphonyReference.rds
    Ignored:    data/BoneMarrowMapBoneMarrowMap_uwot_model.uwot
    Ignored:    data/CAPTURE-1-POOL-FLEX/
    Ignored:    data/CAPTURE-2-POOL-FLEX/
    Ignored:    data/Pool-240917-FLEX/
    Ignored:    data/RDS/
    Ignored:    data/Run_1_and_Run_2/
    Ignored:    data/Run_2/
    Ignored:    logs/
    Ignored:    output/
    Ignored:    projectionFigures/
    Ignored:    renv/library/
    Ignored:    renv/staging/

Untracked files:
    Untracked:  CLAUDE.md
    Untracked:  data/Config_Sample_CAPTURE-1-POOL-FLEX.csv
    Untracked:  data/Config_Sample_CAPTURE-2-POOL-FLEX.csv
    Untracked:  data/Config_Sample_Pool-240917-FLEX.csv
    Untracked:  data/analysis_input/ETV6_RUNX1_transcript.csv
    Untracked:  data/cellranger-multi_flex_fusions_pool_1.sbatch
    Untracked:  data/cellranger-multi_flex_fusions_pool_2.sbatch
    Untracked:  data/victoria_stuff/
    Untracked:  methods_updated.md

Unstaged changes:
    Modified:   analysis/B-ALL_exp2_fig4_assembly.Rmd
    Modified:   render_all.sh
Note that any generated files, e.g. HTML, png, CSS, etc., are not included in this status report because it is ok for generated content to have uncommitted changes.
These are the previous versions of the repository in which changes were
made to the R Markdown
(analysis/B-ALL_exp2_c369_mrd_analysis.Rmd) and HTML
(docs/B-ALL_exp2_c369_mrd_analysis.html) files. If you’ve
configured a remote Git repository (see ?wflow_git_remote),
click on the hyperlinks in the table below to view the files as they
were in that past version.
| File | Version | Author | Date | Message |
|---|---|---|---|---|
| Rmd | f5aa6c9 | Jovana Maksimovic | 2026-08-25 | analysis/B-ALL_exp2_fig4_assembly.Rmd |
| html | c8c7478 | Jovana Maksimovic | 2026-07-16 | Build site. |
| Rmd | 6be4d89 | Jovana Maksimovic | 2026-07-16 | wflow_publish("analysis/B-ALL_exp2_c369_mrd_analysis.Rmd") |
Patient C369 carries an ETV6::RUNX1 (v2) fusion and has three longitudinal samples: diagnosis, MRD (end-of-induction), and relapse. This notebook addresses two related biological questions, both answered by jointly clustering the three C369 timepoints and examining where fusion-positive cells fall relative to the transcriptionally defined blast and normal BM populations.
1. MRD blast detection. Clinical MRD at end-of-induction was 0.038% by flow cytometry / molecular testing. At this level, roughly 0.76 genuine blast cells are expected in the 1,994 recovered MRD cells. Joint clustering identifies 2 MRD cells that cluster with diagnosis blasts (0.1%). This is in close agreement with the clinical MRD estimate and represents an independent, orthogonal confirmation using single-cell fusion detection; notably, the ETV6::RUNX1 fusion is not used in the clinical MRD assay.
2. Pre-leukaemic clone detection. ETV6::RUNX1 is thought to arise in utero in a haematopoietic progenitor cell, establishing a pre-leukaemic clone that persists across multiple lineages without transformation (Mori et al.; Ford et al.). At MRD, we detect ETV6::RUNX1-v2 fusion transcripts in 33 cells that cluster within normal BM populations, spanning erythroid (n=11), myeloid (n=9), T cell (n=10), NK (n=1), and B cell (n=2) lineages. These cells do not express canonical blast markers (CD19, DNTT, MME), consistent with normal haematopoietic differentiation rather than leukaemic identity. The breadth of lineages represented supports the hypothesis that the founding fusion event occurred in an early multipotent progenitor.
Load data
# ── Full annotated joint object (all patients, all timepoints) --------------- #
seu_full <- readRDS(here("data", "RDS", "ball_exp2_annotated.seu.rds"))

cat(glue("Full dataset: {ncol(seu_full)} cells × {nrow(seu_full)} features\n"))
Full dataset: 87534 cells × 37145 featurescat("\nC369 cells per timepoint:\n")
C369 cells per timepoint:print(table(seu_full$patient_timepoint[
grepl("C369", seu_full$patient_timepoint)
]))
C1437_Diagnosis   C1437_Relapse  C369_Diagnosis        C369_MRD    C369_Relapse
              0               0           12247            2008           13001
 C601_Diagnosis  C658_Diagnosis  C659_Diagnosis
              0               0               0
Cluster C369 cells jointly
The three C369 timepoints are subsetted from the full object and re-processed independently. Joint clustering allows MRD, diagnosis, and relapse cells to be positioned relative to each other without interference from other patients. SCTransform normalisation is applied on the subset, followed by PCA, UMAP, and Leiden clustering.
out_rds <- here("data", "RDS", "ball_exp2_clustered_c369.seu.rds")

seu_c369 <- cache_rds(out_rds, {

  sub <- subset(seu_full,
                patient_timepoint %in% c("C369_Diagnosis",
                                         "C369_MRD",
                                         "C369_Relapse"))

  sub <- SCTransform(sub, verbose = FALSE, return.only.var.genes = TRUE)
  sub <- RunPCA(sub, verbose = FALSE, npcs = 30, assay = "SCT")
  sub <- RunUMAP(sub, dims = 1:30, reduction = "pca")
  sub <- FindNeighbors(sub, reduction = "pca", dims = 1:30)
  sub <- FindClusters(sub,
                      resolution = seq(0.1, 1, by = 0.1),
                      algorithm  = "Leiden")
  sub
})

# Remove very low-quality cells (nCount_RNA < 300) that passed initial QC
# but have insufficient signal for reliable cluster assignment.
# Two such cells (nCount_RNA ~150) were present in C369_MRD and fell into
# the blast cluster due to noise — they are fusion-negative and will be
# properly excluded when the QC notebook is updated.
n_before <- ncol(seu_c369)
seu_c369  <- subset(seu_c369, nCount_RNA >= 300)
cat(glue("Removed {n_before - ncol(seu_c369)} low-quality cells (nCount_RNA < 300)\n"))
Removed 123 low-quality cells (nCount_RNA < 300)cat(glue(
"C369 joint object: {ncol(seu_c369)} cells × {nrow(seu_c369)} features\n\n"
))C369 joint object: 27133 cells × 15029 featurescat("Cells per timepoint:\n")Cells per timepoint:print(table(seu_c369$patient_timepoint))
C369_Diagnosis       C369_MRD   C369_Relapse
         12124           2008          13001
clustree(seu_c369, prefix = "SCT_snn_res.")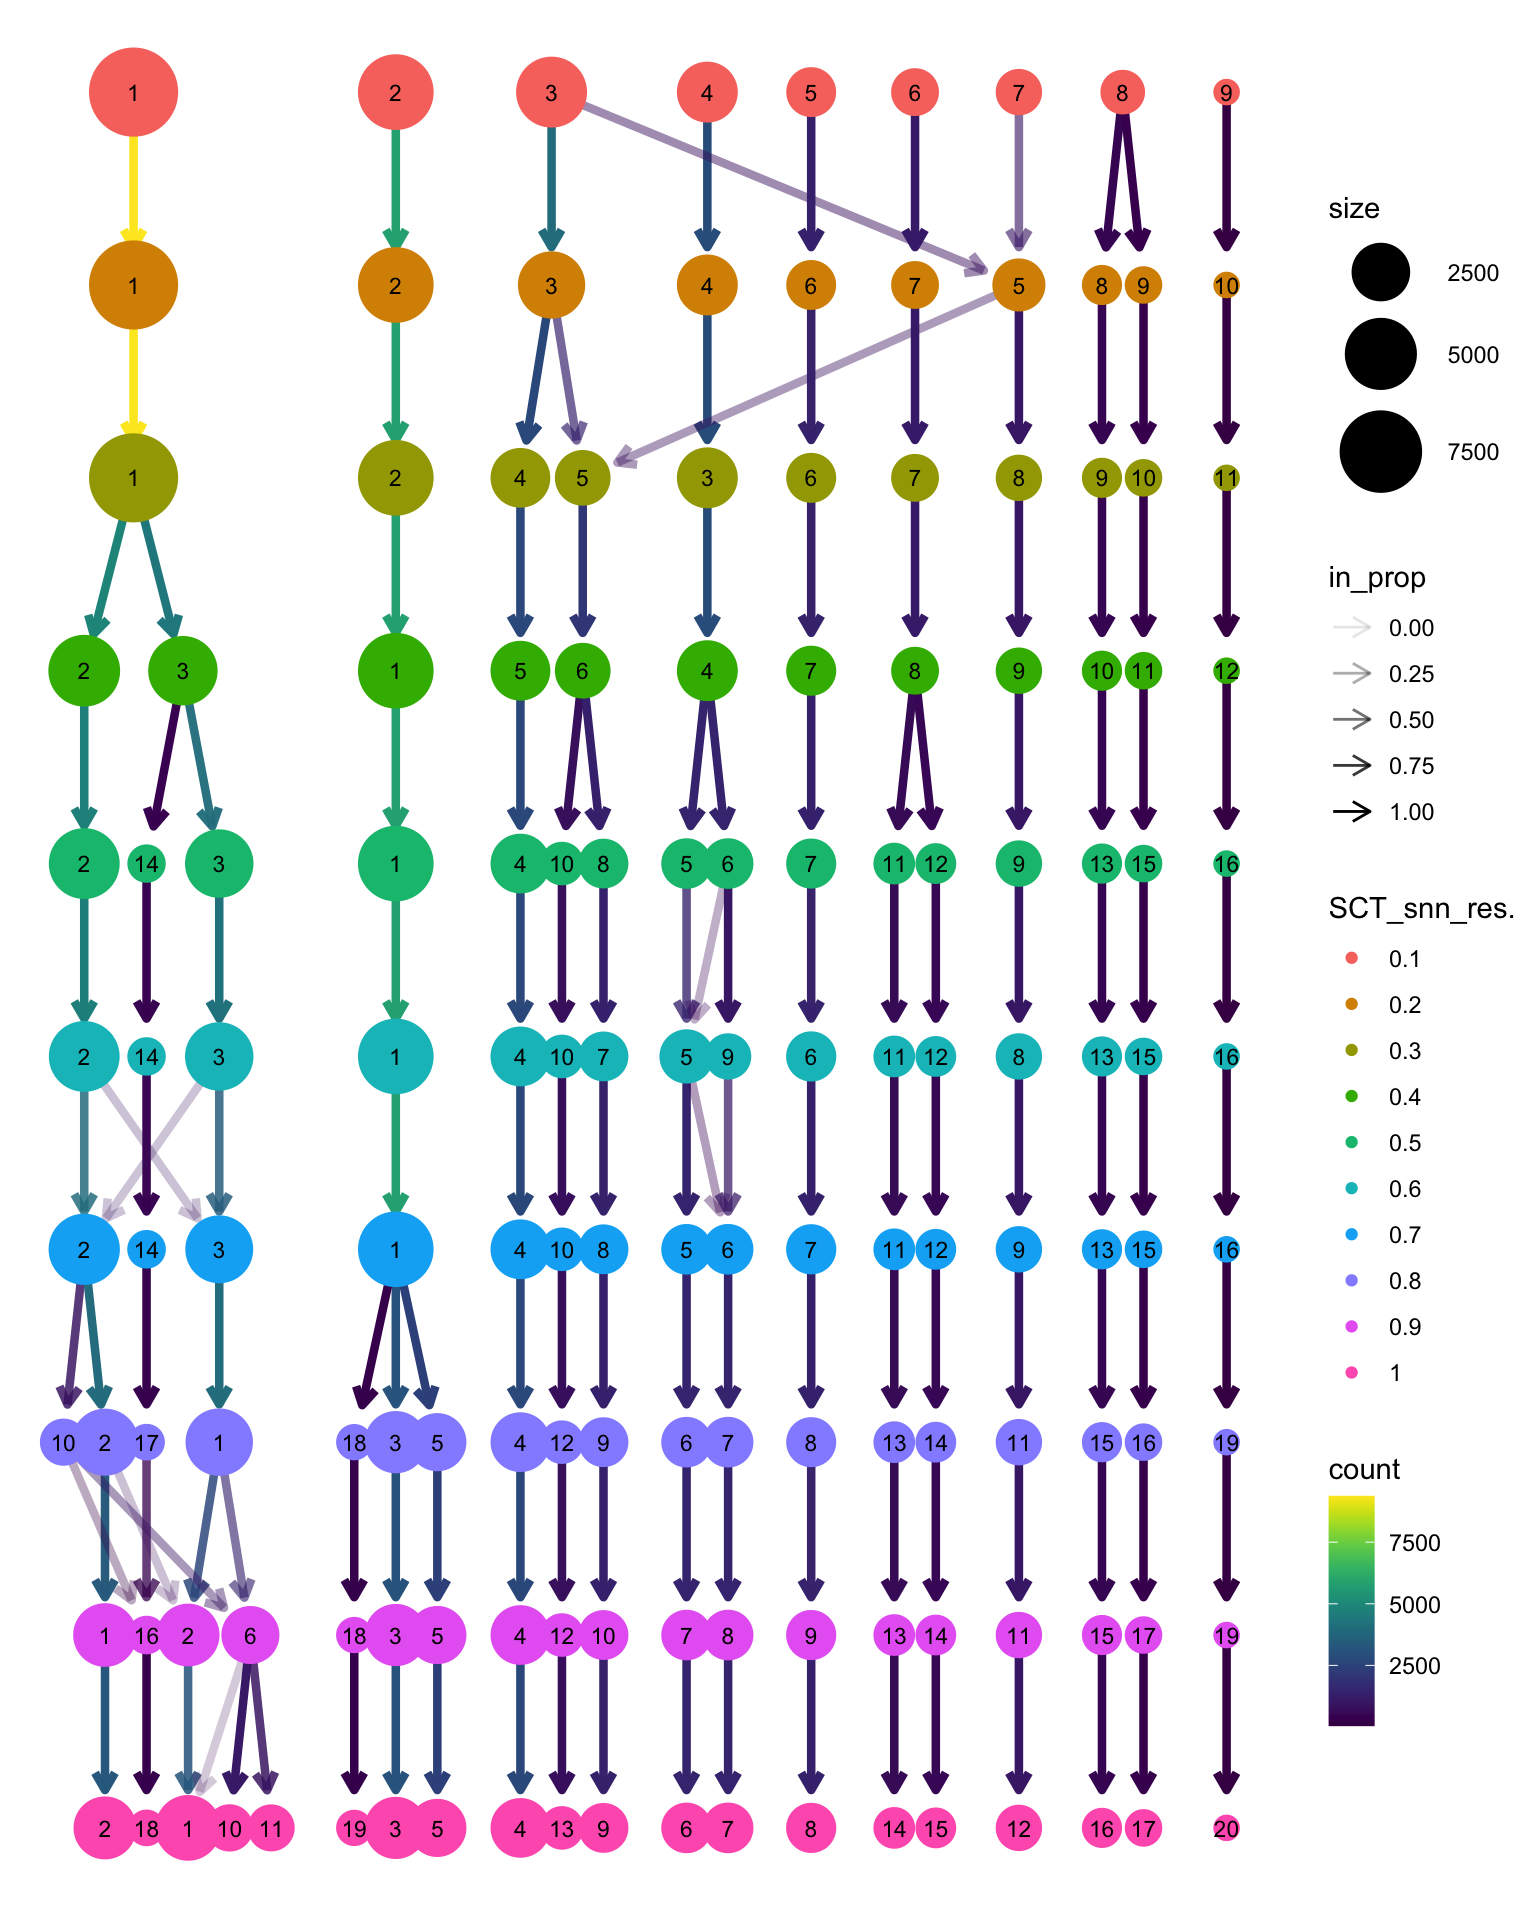
| Version | Author | Date |
|---|---|---|
| c8c7478 | Jovana Maksimovic | 2026-07-16 |
Cluster annotation
Clusters are annotated as blast or normal BM using majority-vote BoneMarrowMap labels. Blast clusters are then split by dominant timepoint (diagnosis vs relapse). MRD blast cells are identified separately as fusion-positive cells at the MRD timepoint that fall within blast-annotated clusters.
# Resolution to use for annotation — inspect outputs and adjust if needed
res_use <- "SCT_snn_res.0.3"

blast_types <- c("Pro-B", "Pre-B", "Early Lymphoid")

cluster_votes <- seu_c369@meta.data %>%
  as_tibble(rownames = "cell_id") %>%
  mutate(is_blast = predicted_CellType_Broad %in% blast_types) %>%
  group_by(.data[[res_use]]) %>%
  summarise(
    n_cells   = n(),
    pct_blast = mean(is_blast),
    maj_tp    = names(sort(table(patient_timepoint), decreasing = TRUE))[1],
    .groups   = "drop"
  ) %>%
  mutate(
    cluster_class = case_when(
      pct_blast > 0.5 & maj_tp == "C369_Diagnosis" ~ "Diagnosis blast",
      pct_blast > 0.5 & maj_tp == "C369_Relapse"   ~ "Relapse blast",
      pct_blast > 0.5 & maj_tp == "C369_MRD"       ~ "MRD blast",
      TRUE                                           ~ "Normal BM"
    )
  )

cat("Cluster classification:\n")
Cluster classification:print(cluster_votes)# A tibble: 11 × 5
SCT_snn_res.0.3 n_cells pct_blast maj_tp cluster_class
<fct> <int> <dbl> <chr> <chr>
1 1 9356 0.988 C369_Relapse Relapse blast
2 2 5806 0.984 C369_Diagnosis Diagnosis blast
3 3 2864 0.00594 C369_Diagnosis Normal BM
4 4 2677 0.991 C369_Diagnosis Diagnosis blast
5 5 2075 0.977 C369_Diagnosis Diagnosis blast
6 6 1359 0.995 C369_Relapse Relapse blast
7 7 1130 0.00796 C369_Relapse Normal BM
8 8 989 0.987 C369_Relapse Relapse blast
9 9 491 0 C369_MRD Normal BM
10 10 337 0 C369_MRD Normal BM
11 11 49 0 C369_MRD Normal BM # Assign cell-level labels
seu_c369$cell_class <- cluster_votes$cluster_class[
match(as.character(seu_c369@meta.data[[res_use]]),
as.character(cluster_votes[[res_use]]))
]
# Fusion status
seu_c369$fusion_detected <- seu_c369$patient_fusion == "ETV6-RUNX1-v2-fusion"
# Timepoint short labels
seu_c369$timepoint <- recode(seu_c369$patient_timepoint,
"C369_Diagnosis" = "Diagnosis",
"C369_MRD" = "MRD",
"C369_Relapse" = "Relapse"
)
cat("\nCell class breakdown:\n")
Cell class breakdown:print(table(seu_c369$cell_class, seu_c369$timepoint))
                  Diagnosis   MRD Relapse
  Diagnosis blast     10443     1     114
  Normal BM            1640  2006    1225
  Relapse blast          41     1   11662
UMAP overview
By timepoint
umap_df <- as.data.frame(Embeddings(seu_c369, "umap"))
colnames(umap_df) <- c("UMAP_1", "UMAP_2")
umap_df$timepoint      <- seu_c369$timepoint
umap_df$fusion         <- seu_c369$fusion_detected
umap_df$cell_class     <- seu_c369$cell_class
umap_df$bmm_label      <- seu_c369$predicted_CellType_Broad

ggplot(umap_df, aes(UMAP_1, UMAP_2, colour = timepoint)) +
  geom_point(size = 0.4, alpha = 0.6) +
  scale_colour_manual(values = tp_cols, name = NULL) +
  guides(colour = guide_legend(override.aes = list(size = 3, alpha = 1))) +
  labs(title = "C369 — joint UMAP by timepoint") +
  theme_pub() +
  theme(legend.position = "right")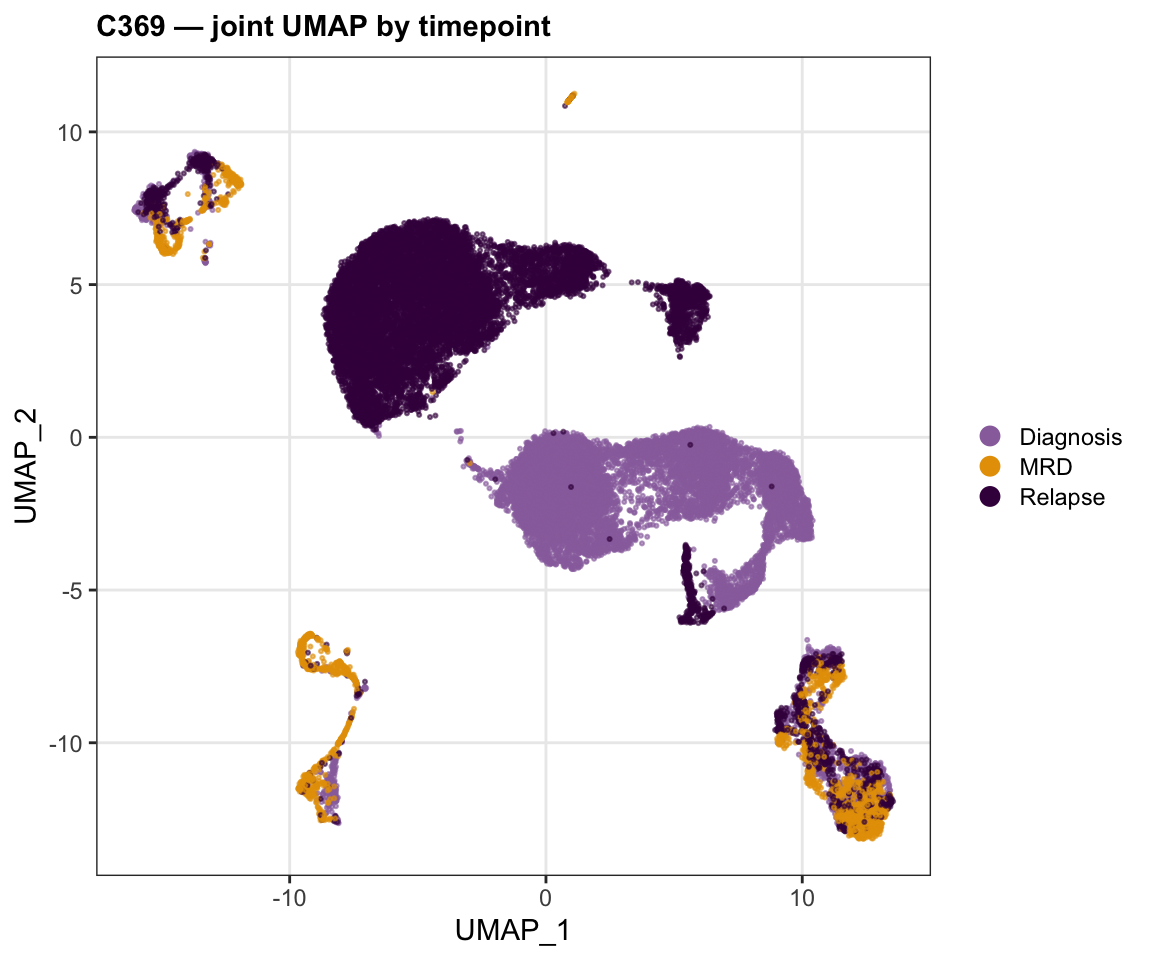
| Version | Author | Date |
|---|---|---|
| c8c7478 | Jovana Maksimovic | 2026-07-16 |
By fusion detection
# Plot fusion+ cells on top
umap_df_ord <- umap_df %>% arrange(fusion)

ggplot(umap_df_ord, aes(UMAP_1, UMAP_2,
                         colour = fusion, size = fusion, alpha = fusion)) +
  geom_point() +
  scale_colour_manual(
    values = c("TRUE" = "#0072B2", "FALSE" = "grey85"),
    labels = c("TRUE" = "ETV6::RUNX1-v2", "FALSE" = "Unselected"),
    name   = NULL
  ) +
  scale_size_manual(values  = c("TRUE" = 1.2, "FALSE" = 0.3), guide = "none") +
  scale_alpha_manual(values = c("TRUE" = 1,   "FALSE" = 0.5), guide = "none") +
  guides(colour = guide_legend(override.aes = list(size = 3, alpha = 1))) +
  labs(title = "C369 — joint UMAP by fusion detection") +
  theme_pub() +
  theme(legend.position = "right")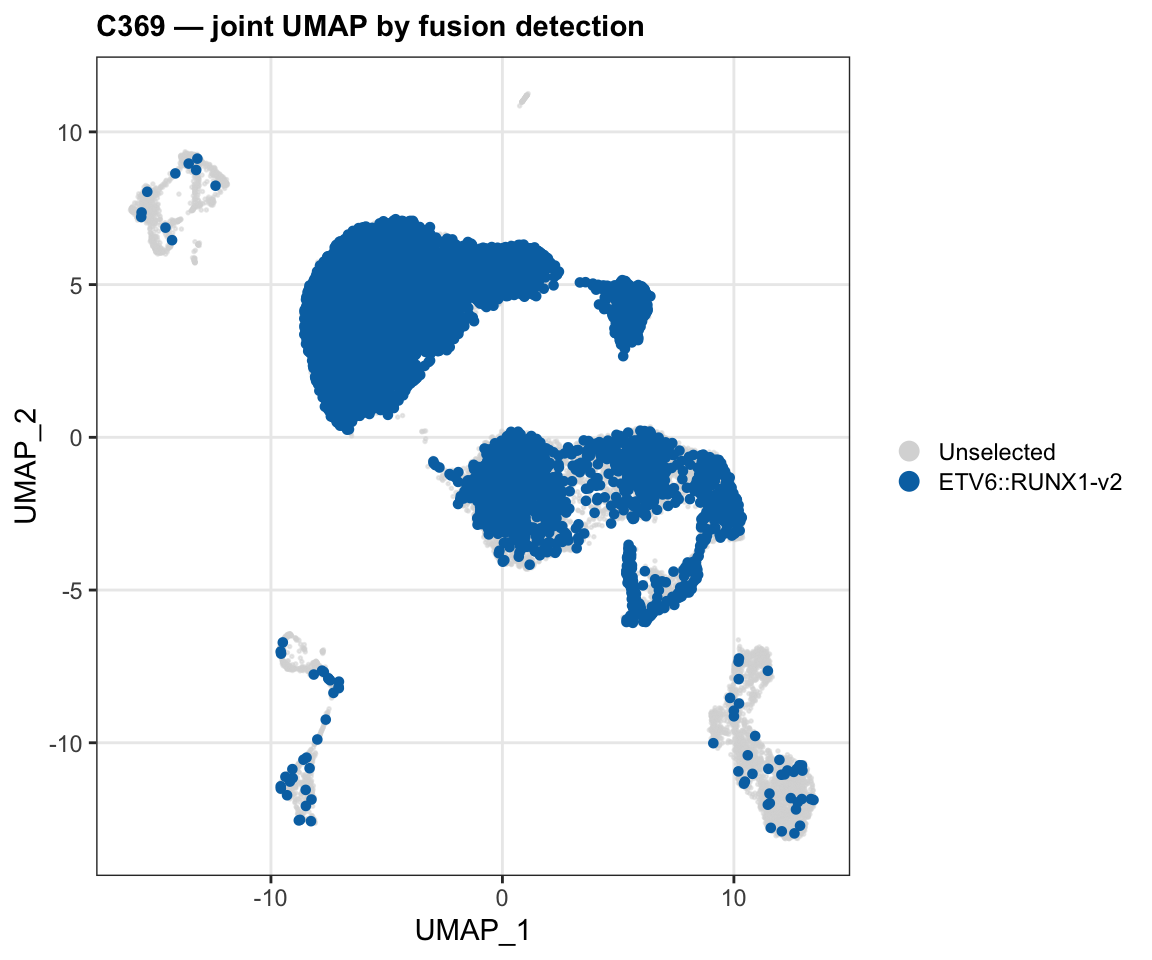
| Version | Author | Date |
|---|---|---|
| c8c7478 | Jovana Maksimovic | 2026-07-16 |
By timepoint, split panels
# One panel per timepoint; fusion+ cells highlighted; other timepoints greyed
make_tp_panel <- function(tp) {
  df <- umap_df %>%
    mutate(
      highlight = case_when(
        timepoint == tp & fusion  ~ "Fusion+",
        timepoint == tp & !fusion ~ "Unselected",
        TRUE                      ~ "Other"
      ),
      highlight = factor(highlight, levels = c("Fusion+", "Unselected", "Other"))
    ) %>%
    arrange(desc(highlight == "Other"))

  ggplot(df, aes(UMAP_1, UMAP_2, colour = highlight,
                 size = highlight, alpha = highlight)) +
    geom_point() +
    scale_colour_manual(
      values = c("Fusion+" = "#0072B2", "Unselected" = "#9970AB", "Other" = "grey92"),
      name   = NULL
    ) +
    scale_size_manual(
      values = c("Fusion+" = 1.5, "Unselected" = 0.4, "Other" = 0.3),
      guide  = "none"
    ) +
    scale_alpha_manual(
      values = c("Fusion+" = 1, "Unselected" = 0.7, "Other" = 0.6),
      guide  = "none"
    ) +
    guides(colour = guide_legend(override.aes = list(size = 3, alpha = 1))) +
    ggtitle(tp) +
    theme_pub(base_size = 10) +
    theme(legend.position = "bottom",
          plot.title      = element_text(hjust = 0.5))
}

p_dx  <- make_tp_panel("Diagnosis")
p_mrd <- make_tp_panel("MRD")
p_rel <- make_tp_panel("Relapse")

(p_dx | p_mrd | p_rel) +
  plot_layout(guides = "collect") +
  plot_annotation(theme = theme(legend.position = "bottom"))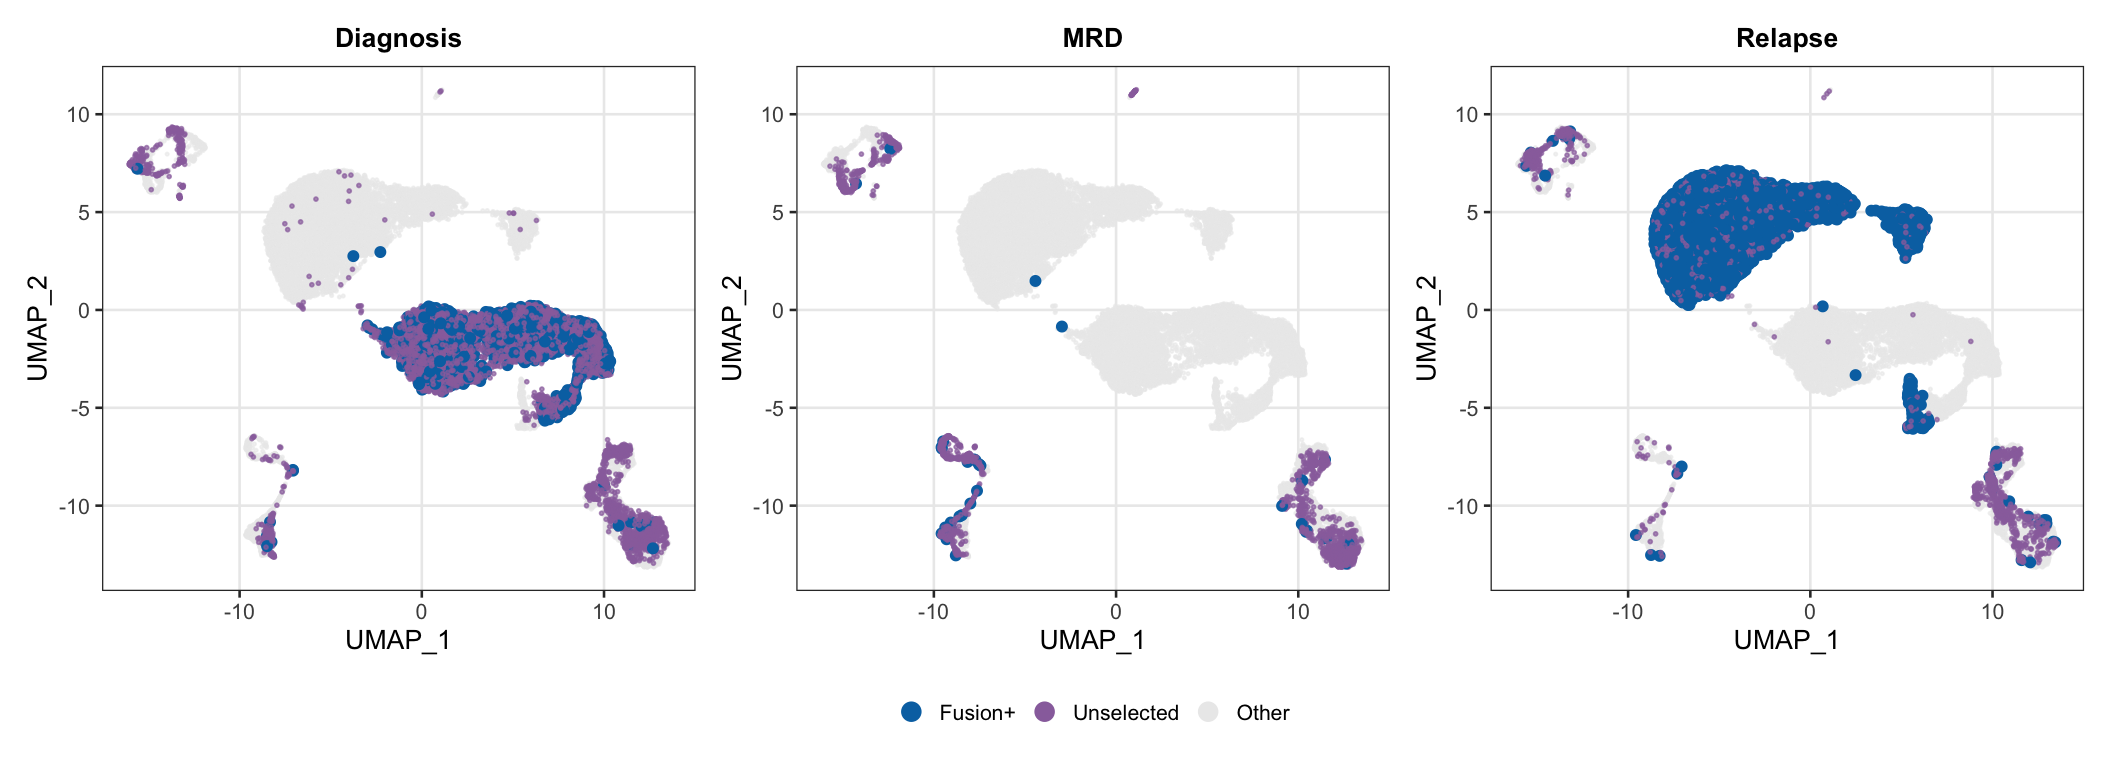
| Version | Author | Date |
|---|---|---|
| c8c7478 | Jovana Maksimovic | 2026-07-16 |
MRD blast characterisation
MRD cells — blast cluster membership and fusion status
Genuine residual blasts are identified by cluster membership: MRD cells that fall within blast-annotated clusters are transcriptionally indistinguishable from diagnosis blasts, providing stronger evidence of blast identity than BoneMarrowMap annotation alone. This approach is independent of fusion detection, allowing the two criteria to serve as orthogonal lines of evidence. We then cross-tabulate cluster membership with fusion detection status to identify the single cell satisfying all three criteria for genuine MRD blast identity.
n_mrd        <- sum(seu_c369$patient_timepoint == "C369_MRD")
n_mrd_blast  <- sum(seu_c369$patient_timepoint == "C369_MRD" &
                    seu_c369$cell_class %in% c("Diagnosis blast", "Relapse blast",
                                               "MRD blast"))
n_mrd_fusion <- sum(seu_c369$patient_timepoint == "C369_MRD" &
                    seu_c369$fusion_detected)

cat(glue("MRD sample size:              {n_mrd} cells\n"))
MRD sample size: 2008 cellscat(glue("MRD cells in blast clusters: {n_mrd_blast} ({round(n_mrd_blast/n_mrd*100,2)}%)\n"))MRD cells in blast clusters: 2 (0.1%)cat(glue("MRD fusion+ cells (any): {n_mrd_fusion} ({round(n_mrd_fusion/n_mrd*100,2)}%)\n"))MRD fusion+ cells (any): 35 (1.74%)cat(glue("Clinical MRD (flow/molecular): 0.038%\n\n"))Clinical MRD (flow/molecular): 0.038%# Cross-tabulation: cluster class × fusion status for MRD cells
cat("MRD cells — cluster class × fusion status:\n")MRD cells — cluster class × fusion status:mrd_cross <- seu_c369@meta.data %>%
filter(patient_timepoint == "C369_MRD") %>%
count(cell_class, fusion_detected) %>%
pivot_wider(names_from = fusion_detected,
values_from = n, values_fill = 0) %>%
rename(`fusion-` = `FALSE`, `fusion+` = `TRUE`)
print(mrd_cross)# A tibble: 3 × 3
cell_class `fusion+` `fusion-`
<chr> <int> <int>
1 Diagnosis blast 1 0
2 Normal BM 33 1973
3 Relapse blast 1 0cat("\nMRD blast cells — BoneMarrowMap annotation:\n")
MRD blast cells — BoneMarrowMap annotation:seu_c369@meta.data %>%
filter(patient_timepoint == "C369_MRD",
cell_class %in% c("Diagnosis blast", "Relapse blast", "MRD blast")) %>%
count(predicted_CellType_Broad, fusion_detected) %>%
print() predicted_CellType_Broad fusion_detected n
1 Pro-B TRUE 1
2 <NA> TRUE 1UMAP — MRD cell identity
MRD cells are coloured by their assigned identity: blast cluster membership (putative genuine residual blasts), fusion-positive in normal BM clusters (putative pre-leukaemic progenitor progeny), or fusion-negative normal BM. Diagnosis and relapse cells form the background.
umap_df <- umap_df %>%
  mutate(
    mrd_class = case_when(
      timepoint == "MRD" &
        cell_class %in% c("Diagnosis blast", "Relapse blast", "MRD blast")
        ~ "MRD blast (fusion+)",
      timepoint == "MRD" & fusion & cell_class == "Normal BM"
        ~ "MRD normal BM (fusion+)",
      timepoint == "MRD" & !fusion
        ~ "MRD normal BM (fusion-)",
      timepoint != "MRD"
        ~ "Dx / Relapse"
    ),
    mrd_class = factor(mrd_class, levels = c(
      "MRD blast (fusion+)",
      "MRD normal BM (fusion+)",
      "MRD normal BM (fusion-)",
      "Dx / Relapse"
    ))
  ) %>%
  arrange(desc(mrd_class == "Dx / Relapse"),
          desc(mrd_class == "MRD normal BM (fusion-)"))

# All MRD cells use pale lavender (#DEC9E9 = C369_MRD_blast colour).
# Shape + stroke encode evidence strength:
#   MRD blast (fusion+)         — shape 21, bold dark purple outline (confirmed blast)
#   MRD normal BM (fusion+)     — shape 21, thin medium purple outline (ambiguous)
#   MRD normal BM (fusion-)         — shape 16, no outline (background MRD)
#   Dx / Relapse                — shape 16, grey (context only)
mrd_fills <- c(
  "MRD blast (fusion+)"              = "#DEC9E9",
  "MRD normal BM (fusion+)"  = "#DEC9E9",
  "MRD normal BM (fusion-)"              = "#DEC9E9",
  "Dx / Relapse"                     = "grey88"
)
mrd_stroke_cols <- c(
  "MRD blast (fusion+)"              = "#6A2E8A",   # dark purple — confirmed blast
  "MRD normal BM (fusion+)"  = "#9970AB",   # medium purple — ambiguous
  "MRD normal BM (fusion-)"              = "#DEC9E9",   # matches fill — no visible outline
  "Dx / Relapse"                     = "grey88"     # matches fill — no visible outline
)
mrd_shapes <- c(
  "MRD blast (fusion+)"              = 21,
  "MRD normal BM (fusion+)"  = 21,
  "MRD normal BM (fusion-)"              = 16,
  "Dx / Relapse"                     = 16
)
mrd_strokes <- c(
  "MRD blast (fusion+)"              = 0.8,
  "MRD normal BM (fusion+)"  = 0.4,
  "MRD normal BM (fusion-)"              = 0,
  "Dx / Relapse"                     = 0
)

# Compute cluster region centroids for annotation labels
# Using predicted_CellType_Broad to identify lineage groups in the background
region_annots <- bind_rows(
  # Blast clusters — labelled by timepoint
  umap_df %>%
    filter(mrd_class == "Dx / Relapse",
           cell_class %in% c("Diagnosis blast", "Relapse blast")) %>%
    mutate(lineage = if_else(cell_class == "Diagnosis blast",
                             "C369 Dx blasts", "C369 Rel blasts")) %>%
    group_by(lineage) %>%
    summarise(x = median(UMAP_1), y = median(UMAP_2), .groups = "drop"),

  # Normal BM — labelled by lineage (Pro-B/Pre-B excluded: in B-ALL these
  # are blast cells labelled by BoneMarrowMap, not normal B-lineage cells)
  umap_df %>%
    filter(mrd_class == "Dx / Relapse", cell_class == "Normal BM") %>%
    mutate(lineage = case_when(
      bmm_label %in% c("Late Erythroid", "Early Erythroid",
                        "Erythroid Progenitor", "MEP") ~ "Erythroid /\nProgenitors",
      bmm_label %in% c("Monocyte", "Pro-Monocyte", "cDC", "pDC") ~ "Myeloid",
      bmm_label %in% c("Naive T", "CD4 Memory T",
                        "CD8 Memory T", "NK")           ~ "T / NK",
      bmm_label %in% c("B", "Plasma Cell")              ~ "B cells",
      TRUE ~ NA_character_
    )) %>%
    filter(!is.na(lineage)) %>%
    group_by(lineage) %>%
    summarise(x = median(UMAP_1), y = median(UMAP_2), .groups = "drop")
)

ggplot(umap_df, aes(UMAP_1, UMAP_2,
                    fill   = mrd_class,
                    colour = mrd_class,
                    shape  = mrd_class,
                    size   = mrd_class,
                    alpha  = mrd_class,
                    stroke = mrd_class)) +
  geom_point() +
  # Cluster region labels
  geom_text(data = region_annots,
            aes(x = x, y = y, label = lineage),
            inherit.aes = FALSE,
            size = 2.8, colour = "grey30", fontface = "italic",
            lineheight = 0.85) +
  scale_fill_manual(values = mrd_fills, name = NULL) +
  scale_colour_manual(values = mrd_stroke_cols, name = NULL) +
  scale_shape_manual(values = mrd_shapes, name = NULL) +
  scale_discrete_manual(aesthetics = "stroke", values = mrd_strokes,
                        guide = "none") +
  scale_size_manual(
    values = c(
      "MRD blast (fusion+)"              = 2.2,
      "MRD normal BM (fusion+)"  = 1.2,
      "MRD normal BM (fusion-)"              = 1.2,
      "Dx / Relapse"                     = 1.0
    ),
    guide = "none"
  ) +
  scale_alpha_manual(
    values = c(
      "MRD blast (fusion+)"              = 1,
      "MRD normal BM (fusion+)"  = 0.9,
      "MRD normal BM (fusion-)"              = 0.4,
      "Dx / Relapse"                     = 0.4
    ),
    guide = "none"
  ) +
  guides(
    fill = guide_legend(
      override.aes = list(
        size   = 3,
        alpha  = 1,
        shape  = c(21, 21, 16, 16),
        fill   = c("#DEC9E9", "#DEC9E9", "#DEC9E9", "grey88"),
        colour = c("#6A2E8A", "#9970AB", "#DEC9E9", "grey88"),
        stroke = c(0.8, 0.4, 0, 0)
      ),
      ncol = 1
    ),
    colour = "none",
    shape  = "none"
  ) +
  labs(title = NULL, x = NULL, y = NULL) +
  annotation_custom(grob = grid::grobTree(
    grid::segmentsGrob(
      x0 = 0.05, y0 = 0.05, x1 = 0.16, y1 = 0.05,
      arrow = grid::arrow(length = grid::unit(0.15, "cm"), type = "closed"),
      gp = grid::gpar(fill = "grey20", col = "grey20", lwd = 2.5)
    ),
    grid::segmentsGrob(
      x0 = 0.05, y0 = 0.05, x1 = 0.05, y1 = 0.16,
      arrow = grid::arrow(length = grid::unit(0.15, "cm"), type = "closed"),
      gp = grid::gpar(fill = "grey20", col = "grey20", lwd = 2.5)
    ),
    grid::textGrob("UMAP", x = 0.105, y = 0.03,
      gp = grid::gpar(fontsize = 8, col = "grey20", fontface = "bold"))
  )) +
  coord_cartesian(clip = "off") +
  theme_pub() +
  theme(
    legend.position   = "right",
    legend.direction  = "vertical",
    legend.text       = element_text(size = 8),
    axis.text         = element_blank(),
    axis.ticks        = element_blank(),
    axis.line         = element_blank(),
    panel.grid        = element_blank(),
    panel.border      = element_blank(),
    panel.background  = element_blank()
  ) -> fig4_H
fig4_H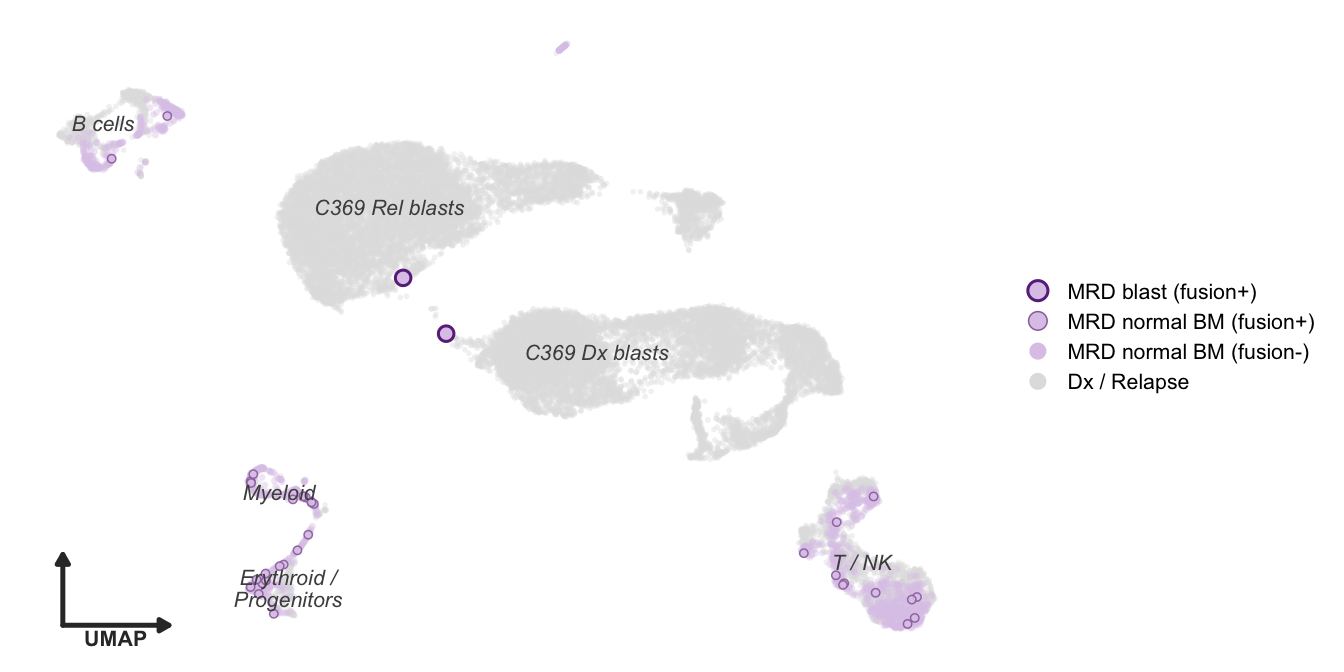
| Version | Author | Date |
|---|---|---|
| c8c7478 | Jovana Maksimovic | 2026-07-16 |
Blast marker expression
Blast markers (DNTT, MME, CD19) and lineage-specific markers (LYZ — myeloid; HBA1 — erythroid; NKG7 — T/NK) are compared across six groups: Dx/Rel blasts, cluster-confirmed MRD blasts (fusion+), and the four broad normal BM cell types identified among fusion-positive MRD cells in the UMAP (B cells, Myeloid, Erythroid/Progenitors, T/NK). The MRD blast expresses DNTT and MME at levels comparable to Dx/Rel blasts, confirming its blast identity. The fusion-positive normal BM cells show no blast marker expression but express their expected lineage markers, confirming they are genuine normal cells rather than residual leukaemia.
# Markers consistent with joint clustering dotplot:
#   blast: DNTT, MME, CD19 | myeloid: CD14 | erythroid: HBB | T/NK: NKG7
markers_mrd <- c("DNTT", "MME", "CD19", "CD79A", "CD14", "HBB", "NKG7")
markers_mrd <- markers_mrd[markers_mrd %in% rownames(seu_c369)]

# Cluster-based marker groups — blasts + 4 UMAP lineage groups (all normal BM cells)
seu_c369$mrd_marker_group <- case_when(
  seu_c369$patient_timepoint %in% c("C369_Diagnosis", "C369_Relapse") &
    seu_c369$fusion_detected &
    seu_c369$cell_class %in% c("Diagnosis blast", "Relapse blast")
    ~ "Dx/Rel blast",
  seu_c369$patient_timepoint == "C369_MRD" &
    seu_c369$cell_class %in% c("Diagnosis blast", "Relapse blast", "MRD blast")
    ~ "MRD blast\n(fusion+)",
  seu_c369$cell_class == "Normal BM" &
    seu_c369$predicted_CellType_Broad %in% c("B", "Plasma Cell")
    ~ "B cells",
  seu_c369$cell_class == "Normal BM" &
    seu_c369$predicted_CellType_Broad %in% c("Monocyte", "Pro-Monocyte", "cDC", "pDC")
    ~ "Myeloid",
  seu_c369$cell_class == "Normal BM" &
    seu_c369$predicted_CellType_Broad %in% c("Late Erythroid", "Early Erythroid",
                                              "Erythroid Progenitor", "MEP")
    ~ "Erythroid /\nProgenitors",
  seu_c369$cell_class == "Normal BM" &
    seu_c369$predicted_CellType_Broad %in% c("Naive T", "CD4 Memory T",
                                              "CD8 Memory T", "NK")
    ~ "T / NK",
  TRUE ~ NA_character_
)

grp_levels <- c("Dx/Rel blast", "MRD blast\n(fusion+)",
                "B cells", "Myeloid", "Erythroid /\nProgenitors", "T / NK")

# Use DotPlot() to extract scaled expression — consistent with joint clustering dotplot
# Subset to cells with a valid group (exclude NAs) before calling DotPlot
DefaultAssay(seu_c369) <- "SCT"
seu_c369$mrd_marker_group <- factor(seu_c369$mrd_marker_group, levels = grp_levels)

seu_dot <- subset(seu_c369,
                  cells = colnames(seu_c369)[!is.na(seu_c369$mrd_marker_group)])
Idents(seu_dot) <- "mrd_marker_group"

dot_data <- DotPlot(
  seu_dot,
  features = markers_mrd,
  idents   = grp_levels
)$data %>%
  mutate(
    features.plot = factor(features.plot, levels = rev(markers_mrd)),
    id            = factor(id, levels = grp_levels)
  )

group_n <- seu_dot@meta.data %>%
  count(mrd_marker_group) %>%
  mutate(
    id    = factor(mrd_marker_group, levels = grp_levels),
    label = paste0("n=", comma(n))
  )

ggplot(dot_data, aes(x = id, y = features.plot,
                     size = pct.exp, colour = avg.exp.scaled)) +
  geom_point(alpha = 0.9) +
  geom_text(
    data = group_n,
    aes(x = id, y = Inf, label = label),
    size = 2.5, colour = "grey30", fontface = "italic",
    vjust = -0.3, inherit.aes = FALSE
  ) +
  geom_vline(xintercept = 1.5, linetype = "dashed",
             colour = "grey60", linewidth = 0.4) +
  geom_vline(xintercept = 2.5, linetype = "dashed",
             colour = "grey60", linewidth = 0.4) +
  scale_colour_distiller(
    palette  = "Purples",
    direction = 1,
    name     = "Avg. expr.\n(scaled)",
    na.value = "grey80",
    guide    = guide_colourbar(direction      = "vertical",
                               title.position = "top",
                               barwidth       = 0.5,
                               barheight      = 4)
  ) +
  scale_size_continuous(
    name   = "% expr.",
    range  = c(0.5, 8),
    breaks = c(1, 25, 50, 75),
    limits = c(0, 100),
    guide  = guide_legend(direction      = "vertical",
                          title.position = "top",
                          ncol           = 1)
  ) +
  labs(x = NULL, y = NULL) +
  theme_classic(base_size = 11) +
  theme(
    axis.text.x      = element_text(size = 8, hjust = 0.5),
    axis.text.y      = element_text(size = 9),
    panel.grid.major = element_line(colour = "grey92", linewidth = 0.3),
    legend.position  = "right",
    legend.box       = "vertical",
    plot.margin      = margin(t = 20, r = 5, b = 25, l = 5)
  ) +
  coord_cartesian(clip = "off") -> fig4_I
fig4_I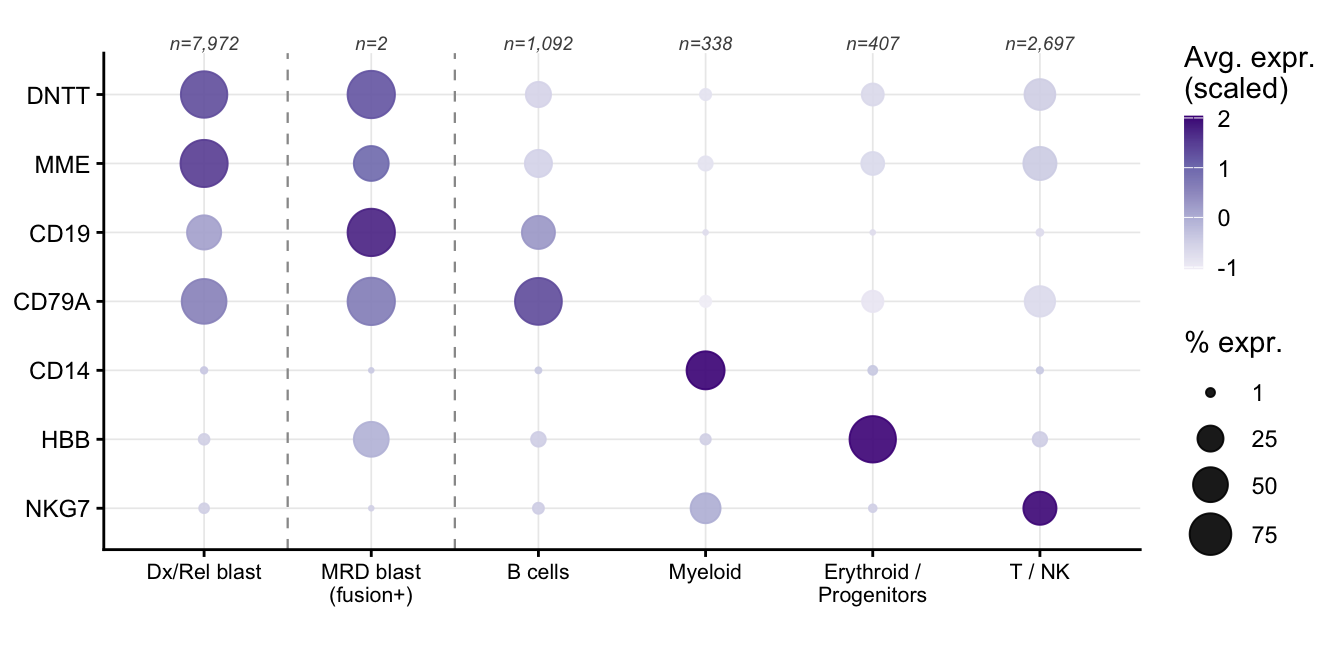
| Version | Author | Date |
|---|---|---|
| c8c7478 | Jovana Maksimovic | 2026-07-16 |
Session info
sessioninfo::session_info()─ Session info ───────────────────────────────────────────────────────────────
setting value
version R version 4.4.1 (2024-06-14)
os macOS 15.7.9
system aarch64, darwin20
ui X11
language (EN)
collate en_US.UTF-8
ctype en_US.UTF-8
tz Australia/Melbourne
date 2026-08-25
pandoc 3.8.3 @ /Applications/RStudio.app/Contents/Resources/app/quarto/bin/tools/aarch64/ (via rmarkdown)
quarto 1.9.38 @ /Applications/RStudio.app/Contents/Resources/app/quarto/bin/quarto
─ Packages ───────────────────────────────────────────────────────────────────
! package * version date (UTC) lib source
P abind 1.4-8 2024-09-12 [?] CRAN (R 4.4.1)
P backports 1.5.0 2024-05-23 [?] CRAN (R 4.4.1)
P BiocManager 1.30.27 2025-11-14 [?] CRAN (R 4.4.3)
P bslib 0.9.0 2025-01-30 [?] CRAN (R 4.4.1)
P cachem 1.1.0 2024-05-16 [?] CRAN (R 4.4.1)
P callr 3.7.6 2024-03-25 [?] CRAN (R 4.4.0)
P checkmate 2.3.2 2024-07-29 [?] CRAN (R 4.4.0)
P cli 3.6.5 2025-04-23 [?] CRAN (R 4.4.1)
P cluster 2.1.6 2023-12-01 [?] CRAN (R 4.4.1)
P clustree * 0.5.1 2023-11-05 [?] CRAN (R 4.4.0)
P codetools 0.2-20 2024-03-31 [?] CRAN (R 4.4.1)
P colorspace 2.1-1 2024-07-26 [?] CRAN (R 4.4.1)
P cowplot 1.1.3 2024-01-22 [?] CRAN (R 4.4.0)
P data.table 1.18.2.1 2026-01-27 [?] CRAN (R 4.4.3)
P deldir 2.0-4 2024-02-28 [?] CRAN (R 4.4.1)
P digest 0.6.37 2024-08-19 [?] CRAN (R 4.4.1)
P dotCall64 1.2 2024-10-04 [?] CRAN (R 4.4.1)
P dplyr * 1.1.4 2023-11-17 [?] CRAN (R 4.4.0)
P evaluate 1.0.3 2025-01-10 [?] CRAN (R 4.4.1)
P farver 2.1.2 2024-05-13 [?] CRAN (R 4.4.1)
P fastDummies 1.7.5 2025-01-20 [?] CRAN (R 4.4.1)
P fastmap 1.2.0 2024-05-15 [?] CRAN (R 4.4.1)
P fitdistrplus 1.2-2 2025-01-07 [?] CRAN (R 4.4.1)
P forcats * 1.0.0 2023-01-29 [?] CRAN (R 4.4.0)
P fs * 1.6.6 2025-04-12 [?] CRAN (R 4.4.1)
P future 1.49.0 2025-05-09 [?] CRAN (R 4.4.1)
P future.apply 1.11.3 2024-10-27 [?] CRAN (R 4.4.1)
P generics 0.1.4 2025-05-09 [?] CRAN (R 4.4.1)
P getPass 0.2-4 2023-12-10 [?] CRAN (R 4.4.1)
P ggforce 0.4.2 2024-02-19 [?] CRAN (R 4.4.0)
P ggplot2 * 4.0.2 2026-02-03 [?] CRAN (R 4.4.3)
P ggraph * 2.2.1 2024-03-07 [?] CRAN (R 4.4.0)
P ggrepel * 0.9.6 2024-09-07 [?] CRAN (R 4.4.1)
P ggridges 0.5.6 2024-01-23 [?] CRAN (R 4.4.0)
P git2r 0.36.2 2025-03-29 [?] CRAN (R 4.4.1)
P globals 0.18.0 2025-05-08 [?] CRAN (R 4.4.1)
P glue * 1.8.0 2024-09-30 [?] CRAN (R 4.4.1)
P goftest 1.2-3 2021-10-07 [?] CRAN (R 4.4.1)
P graphlayouts 1.2.2 2025-01-23 [?] CRAN (R 4.4.1)
P gridExtra 2.3 2017-09-09 [?] CRAN (R 4.4.1)
P gtable 0.3.6 2024-10-25 [?] CRAN (R 4.4.1)
P here * 1.0.1 2020-12-13 [?] CRAN (R 4.4.1)
P hms 1.1.3 2023-03-21 [?] CRAN (R 4.4.0)
P htmltools 0.5.8.1 2024-04-04 [?] CRAN (R 4.4.1)
P htmlwidgets 1.6.4 2023-12-06 [?] CRAN (R 4.4.0)
P httpuv 1.6.16 2025-04-16 [?] CRAN (R 4.4.1)
P httr 1.4.7 2023-08-15 [?] CRAN (R 4.4.0)
P ica 1.0-3 2022-07-08 [?] CRAN (R 4.4.1)
P igraph 2.1.4 2025-01-23 [?] CRAN (R 4.4.1)
P irlba 2.3.5.1 2022-10-03 [?] CRAN (R 4.4.0)
P jquerylib 0.1.4 2021-04-26 [?] CRAN (R 4.4.0)
P jsonlite 2.0.0 2025-03-27 [?] CRAN (R 4.4.1)
P KernSmooth 2.23-24 2024-05-17 [?] CRAN (R 4.4.1)
P knitr 1.50 2025-03-16 [?] CRAN (R 4.4.1)
P labeling 0.4.3 2023-08-29 [?] CRAN (R 4.4.1)
P later 1.4.2 2025-04-08 [?] CRAN (R 4.4.1)
P lattice 0.22-6 2024-03-20 [?] CRAN (R 4.4.1)
P lazyeval 0.2.2 2019-03-15 [?] CRAN (R 4.4.1)
P lifecycle 1.0.4 2023-11-07 [?] CRAN (R 4.4.1)
P listenv 0.9.1 2024-01-29 [?] CRAN (R 4.4.1)
P lmtest 0.9-40 2022-03-21 [?] CRAN (R 4.4.1)
P lubridate * 1.9.4 2024-12-08 [?] CRAN (R 4.4.1)
P magrittr 2.0.3 2022-03-30 [?] CRAN (R 4.4.1)
P MASS 7.3-60.2 2024-04-26 [?] CRAN (R 4.4.1)
P Matrix 1.7-0 2024-04-26 [?] CRAN (R 4.4.1)
P matrixStats 1.5.0 2025-01-07 [?] CRAN (R 4.4.1)
P memoise 2.0.1 2021-11-26 [?] CRAN (R 4.4.0)
P mime 0.13 2025-03-17 [?] CRAN (R 4.4.1)
P miniUI 0.1.2 2025-04-17 [?] CRAN (R 4.4.1)
P nlme 3.1-164 2023-11-27 [?] CRAN (R 4.4.1)
P parallelly 1.45.0 2025-06-02 [?] CRAN (R 4.4.1)
P patchwork * 1.3.0 2024-09-16 [?] CRAN (R 4.4.1)
P pbapply 1.7-4 2025-07-20 [?] CRAN (R 4.4.1)
P pillar 1.10.2 2025-04-05 [?] CRAN (R 4.4.1)
P pkgconfig 2.0.3 2019-09-22 [?] CRAN (R 4.4.1)
P plotly 4.10.4 2024-01-13 [?] CRAN (R 4.4.0)
P plyr 1.8.9 2023-10-02 [?] CRAN (R 4.4.1)
P png 0.1-8 2022-11-29 [?] CRAN (R 4.4.1)
P polyclip 1.10-7 2024-07-23 [?] CRAN (R 4.4.1)
P processx 3.8.6 2025-02-21 [?] CRAN (R 4.4.1)
P progressr 0.15.1 2024-11-22 [?] CRAN (R 4.4.1)
P promises 1.3.3 2025-05-29 [?] CRAN (R 4.4.1)
P ps 1.9.1 2025-04-12 [?] CRAN (R 4.4.1)
P purrr * 1.0.4 2025-02-05 [?] CRAN (R 4.4.1)
P R6 2.6.1 2025-02-15 [?] CRAN (R 4.4.1)
P RANN 2.6.2 2024-08-25 [?] CRAN (R 4.4.1)
P RColorBrewer 1.1-3 2022-04-03 [?] CRAN (R 4.4.1)
P Rcpp 1.1.1-1.1 2026-04-24 [?] CRAN (R 4.4.1)
P RcppAnnoy 0.0.22 2024-01-23 [?] CRAN (R 4.4.1)
P RcppHNSW 0.6.0 2024-02-04 [?] CRAN (R 4.4.1)
P readr * 2.1.5 2024-01-10 [?] CRAN (R 4.4.0)
renv 1.1.4 2025-03-20 [1] CRAN (R 4.4.1)
P reshape2 1.4.4 2020-04-09 [?] CRAN (R 4.4.0)
P reticulate 1.42.0 2025-03-25 [?] CRAN (R 4.4.1)
P rlang 1.1.6 2025-04-11 [?] CRAN (R 4.4.1)
P rmarkdown 2.29 2024-11-04 [?] CRAN (R 4.4.1)
P ROCR 1.0-11 2020-05-02 [?] CRAN (R 4.4.0)
P rprojroot 2.0.4 2023-11-05 [?] CRAN (R 4.4.1)
P RSpectra 0.16-2 2024-07-18 [?] CRAN (R 4.4.0)
P rstudioapi 0.17.1 2024-10-22 [?] CRAN (R 4.4.1)
P Rtsne 0.17 2023-12-07 [?] CRAN (R 4.4.1)
P S7 0.2.0 2024-11-07 [?] CRAN (R 4.4.1)
P sass 0.4.10 2025-04-11 [?] CRAN (R 4.4.1)
P scales * 1.4.0 2025-04-24 [?] CRAN (R 4.4.1)
P scattermore 1.2 2023-06-12 [?] CRAN (R 4.4.0)
P sctransform 0.4.2 2025-04-30 [?] CRAN (R 4.4.1)
P sessioninfo 1.2.3 2025-02-05 [?] CRAN (R 4.4.1)
P Seurat * 5.3.0 2025-04-23 [?] CRAN (R 4.4.1)
P SeuratObject * 5.1.0 2025-04-22 [?] CRAN (R 4.4.1)
P shiny 1.10.0 2024-12-14 [?] CRAN (R 4.4.1)
P sp * 2.2-0 2025-02-01 [?] CRAN (R 4.4.1)
P spam 2.11-1 2025-01-20 [?] CRAN (R 4.4.1)
P spatstat.data 3.1-6 2025-03-17 [?] CRAN (R 4.4.1)
P spatstat.explore 3.4-3 2025-05-21 [?] CRAN (R 4.4.1)
P spatstat.geom 3.4-1 2025-05-20 [?] CRAN (R 4.4.1)
P spatstat.random 3.4-1 2025-05-20 [?] CRAN (R 4.4.1)
P spatstat.sparse 3.1-0 2024-06-21 [?] CRAN (R 4.4.0)
P spatstat.univar 3.1-3 2025-05-08 [?] CRAN (R 4.4.1)
P spatstat.utils 3.1-4 2025-05-15 [?] CRAN (R 4.4.1)
P stringi 1.8.7 2025-03-27 [?] CRAN (R 4.4.1)
P stringr * 1.6.0 2025-11-04 [?] CRAN (R 4.4.1)
P survival 3.6-4 2024-04-24 [?] CRAN (R 4.4.1)
P tensor 1.5 2012-05-05 [?] CRAN (R 4.4.1)
P tibble * 3.2.1 2023-03-20 [?] CRAN (R 4.4.0)
P tidygraph 1.3.1 2024-01-30 [?] CRAN (R 4.4.0)
P tidyr * 1.3.1 2024-01-24 [?] CRAN (R 4.4.1)
P tidyselect 1.2.1 2024-03-11 [?] CRAN (R 4.4.0)
P tidyverse * 2.0.0 2023-02-22 [?] CRAN (R 4.4.0)
P timechange 0.3.0 2024-01-18 [?] CRAN (R 4.4.1)
P tweenr 2.0.3 2024-02-26 [?] CRAN (R 4.4.0)
P tzdb 0.5.0 2025-03-15 [?] CRAN (R 4.4.1)
P utf8 1.2.5 2025-05-01 [?] CRAN (R 4.4.1)
P uwot 0.2.3 2025-02-24 [?] CRAN (R 4.4.1)
P vctrs 0.6.5 2023-12-01 [?] CRAN (R 4.4.0)
P viridis 0.6.5 2024-01-29 [?] CRAN (R 4.4.0)
P viridisLite 0.4.2 2023-05-02 [?] CRAN (R 4.4.1)
P whisker 0.4.1 2022-12-05 [?] CRAN (R 4.4.1)
P withr 3.0.2 2024-10-28 [?] CRAN (R 4.4.1)
P workflowr * 1.7.1 2023-08-23 [?] CRAN (R 4.4.0)
P xfun 0.56 2026-01-18 [?] CRAN (R 4.4.3)
P xtable 1.8-4 2019-04-21 [?] CRAN (R 4.4.1)
P yaml 2.3.10 2024-07-26 [?] CRAN (R 4.4.1)
P zoo 1.8-14 2025-04-10 [?] CRAN (R 4.4.1)
[1] /Users/maksimovicjovana/projects/active/flex-fusion-probes/renv/library/macos/R-4.4/aarch64-apple-darwin20
[2] /Users/maksimovicjovana/Library/Caches/org.R-project.R/R/renv/sandbox/macos/R-4.4/aarch64-apple-darwin20/f7156815
* ── Packages attached to the search path.
P ── Loaded and on-disk path mismatch.
──────────────────────────────────────────────────────────────────────────────
sessionInfo()R version 4.4.1 (2024-06-14)
Platform: aarch64-apple-darwin20
Running under: macOS 15.7.9
Matrix products: default
BLAS: /Library/Frameworks/R.framework/Versions/4.4-arm64/Resources/lib/libRblas.0.dylib
LAPACK: /Library/Frameworks/R.framework/Versions/4.4-arm64/Resources/lib/libRlapack.dylib; LAPACK version 3.12.0
locale:
[1] en_US.UTF-8/en_US.UTF-8/en_US.UTF-8/C/en_US.UTF-8/en_US.UTF-8
time zone: Australia/Melbourne
tzcode source: internal
attached base packages:
[1] stats graphics grDevices datasets utils methods base
other attached packages:
[1] clustree_0.5.1 ggraph_2.2.1 scales_1.4.0 fs_1.6.6
[5] glue_1.8.0 here_1.0.1 ggrepel_0.9.6 patchwork_1.3.0
[9] lubridate_1.9.4 forcats_1.0.0 stringr_1.6.0 dplyr_1.1.4
[13] purrr_1.0.4 readr_2.1.5 tidyr_1.3.1 tibble_3.2.1
[17] ggplot2_4.0.2 tidyverse_2.0.0 Seurat_5.3.0 SeuratObject_5.1.0
[21] sp_2.2-0 workflowr_1.7.1
loaded via a namespace (and not attached):
[1] RColorBrewer_1.1-3 rstudioapi_0.17.1 jsonlite_2.0.0
[4] magrittr_2.0.3 spatstat.utils_3.1-4 farver_2.1.2
[7] rmarkdown_2.29 vctrs_0.6.5 ROCR_1.0-11
[10] memoise_2.0.1 spatstat.explore_3.4-3 htmltools_0.5.8.1
[13] sass_0.4.10 sctransform_0.4.2 parallelly_1.45.0
[16] KernSmooth_2.23-24 bslib_0.9.0 htmlwidgets_1.6.4
[19] ica_1.0-3 plyr_1.8.9 plotly_4.10.4
[22] zoo_1.8-14 cachem_1.1.0 whisker_0.4.1
[25] igraph_2.1.4 mime_0.13 lifecycle_1.0.4
[28] pkgconfig_2.0.3 Matrix_1.7-0 R6_2.6.1
[31] fastmap_1.2.0 fitdistrplus_1.2-2 future_1.49.0
[34] shiny_1.10.0 digest_0.6.37 colorspace_2.1-1
[37] ps_1.9.1 rprojroot_2.0.4 tensor_1.5
[40] RSpectra_0.16-2 irlba_2.3.5.1 labeling_0.4.3
[43] progressr_0.15.1 timechange_0.3.0 spatstat.sparse_3.1-0
[46] httr_1.4.7 polyclip_1.10-7 abind_1.4-8
[49] compiler_4.4.1 withr_3.0.2 backports_1.5.0
[52] S7_0.2.0 viridis_0.6.5 fastDummies_1.7.5
[55] ggforce_0.4.2 MASS_7.3-60.2 sessioninfo_1.2.3
[58] tools_4.4.1 lmtest_0.9-40 httpuv_1.6.16
[61] future.apply_1.11.3 goftest_1.2-3 callr_3.7.6
[64] nlme_3.1-164 promises_1.3.3 grid_4.4.1
[67] checkmate_2.3.2 Rtsne_0.17 getPass_0.2-4
[70] cluster_2.1.6 reshape2_1.4.4 generics_0.1.4
[73] gtable_0.3.6 spatstat.data_3.1-6 tzdb_0.5.0
[76] hms_1.1.3 data.table_1.18.2.1 utf8_1.2.5
[79] tidygraph_1.3.1 spatstat.geom_3.4-1 RcppAnnoy_0.0.22
[82] RANN_2.6.2 pillar_1.10.2 spam_2.11-1
[85] RcppHNSW_0.6.0 later_1.4.2 splines_4.4.1
[88] tweenr_2.0.3 lattice_0.22-6 renv_1.1.4
[91] survival_3.6-4 deldir_2.0-4 tidyselect_1.2.1
[94] miniUI_0.1.2 pbapply_1.7-4 knitr_1.50
[97] git2r_0.36.2 gridExtra_2.3 scattermore_1.2
[100] xfun_0.56 graphlayouts_1.2.2 matrixStats_1.5.0
[103] stringi_1.8.7 lazyeval_0.2.2 yaml_2.3.10
[106] evaluate_1.0.3 codetools_0.2-20 BiocManager_1.30.27
[109] cli_3.6.5 uwot_0.2.3 xtable_1.8-4
[112] reticulate_1.42.0 processx_3.8.6 jquerylib_0.1.4
[115] Rcpp_1.1.1-1.1 globals_0.18.0 spatstat.random_3.4-1
[118] png_0.1-8 spatstat.univar_3.1-3 parallel_4.4.1
[121] dotCall64_1.2 listenv_0.9.1 viridisLite_0.4.2
[124] ggridges_0.5.6 rlang_1.1.6 cowplot_1.1.3