Analysis of scRNA-seq & CITE-seq Data Combined
Post-process Other Cells Sub-clustering Results
Jovana Maksimovic
December 20, 2022
Last updated: 2022-12-20
Checks: 7 0
Knit directory:
paed-cf-cite-seq/
This reproducible R Markdown analysis was created with workflowr (version 1.7.0). The Checks tab describes the reproducibility checks that were applied when the results were created. The Past versions tab lists the development history.
Great! Since the R Markdown file has been committed to the Git repository, you know the exact version of the code that produced these results.
Great job! The global environment was empty. Objects defined in the global environment can affect the analysis in your R Markdown file in unknown ways. For reproduciblity it’s best to always run the code in an empty environment.
The command set.seed(20210524) was run prior to running the code in the R Markdown file.
Setting a seed ensures that any results that rely on randomness, e.g.
subsampling or permutations, are reproducible.
Great job! Recording the operating system, R version, and package versions is critical for reproducibility.
Nice! There were no cached chunks for this analysis, so you can be confident that you successfully produced the results during this run.
Great job! Using relative paths to the files within your workflowr project makes it easier to run your code on other machines.
Great! You are using Git for version control. Tracking code development and connecting the code version to the results is critical for reproducibility.
The results in this page were generated with repository version 508dee7. See the Past versions tab to see a history of the changes made to the R Markdown and HTML files.
Note that you need to be careful to ensure that all relevant files for the
analysis have been committed to Git prior to generating the results (you can
use wflow_publish or wflow_git_commit). workflowr only
checks the R Markdown file, but you know if there are other scripts or data
files that it depends on. Below is the status of the Git repository when the
results were generated:
Ignored files:
    Ignored:    .Rhistory
    Ignored:    .Rproj.user/
    Ignored:    analysis/obsolete/
    Ignored:    code/obsolete/
    Ignored:    data/190930_A00152_0150_BHTYCMDSXX/
    Ignored:    data/CellRanger/
    Ignored:    data/GSE127465_RAW/
    Ignored:    data/Homo_sapiens.gene_info
    Ignored:    data/SCEs/02_ZILIONIS.sct_normalised.SEU.rds
    Ignored:    data/SCEs/03_C133_Neeland.demultiplexed.SCE.rds
    Ignored:    data/SCEs/03_C133_Neeland.emptyDrops.SCE.rds
    Ignored:    data/SCEs/03_C133_Neeland.preprocessed.SCE.rds
    Ignored:    data/SCEs/03_CF_BAL_Pilot.CellRanger_v6.SCE.rds
    Ignored:    data/SCEs/03_CF_BAL_Pilot.emptyDrops.SCE.rds
    Ignored:    data/SCEs/03_CF_BAL_Pilot.preprocessed.SCE.rds
    Ignored:    data/SCEs/03_COMBO.clustered.SEU.rds
    Ignored:    data/SCEs/03_COMBO.clustered_annotated_macrophages_diet.SEU.rds
    Ignored:    data/SCEs/03_COMBO.clustered_annotated_others_diet.SEU.rds
    Ignored:    data/SCEs/03_COMBO.clustered_annotated_tcells_diet.SEU.rds
    Ignored:    data/SCEs/03_COMBO.clustered_diet.SEU.rds
    Ignored:    data/SCEs/03_COMBO.integrated.SEU.rds
    Ignored:    data/SCEs/03_COMBO.zilionis_mapped.SEU.rds
    Ignored:    data/SCEs/04_C133_Neeland.adt_dsb_normalised.rds
    Ignored:    data/SCEs/04_C133_Neeland.adt_integrated.rds
    Ignored:    data/SCEs/04_C133_Neeland.all_integrated.SEU.rds
    Ignored:    data/SCEs/04_CF_BAL_Pilot.CellRanger_v6.SCE.rds
    Ignored:    data/SCEs/04_CF_BAL_Pilot.emptyDrops.SCE.rds
    Ignored:    data/SCEs/04_CF_BAL_Pilot.preprocessed.SCE.rds
    Ignored:    data/SCEs/04_CF_BAL_Pilot.transfer_adt.SEU.rds
    Ignored:    data/SCEs/04_COMBO.clean_clustered.SEU.rds
    Ignored:    data/SCEs/04_COMBO.clean_clustered.SEU_bk.rds
    Ignored:    data/SCEs/04_COMBO.clean_integrated.SEU.rds
    Ignored:    data/SCEs/04_COMBO.clean_integrated.SEU_bk.rds
    Ignored:    data/SCEs/04_COMBO.clean_macrophages_diet.SEU.rds
    Ignored:    data/SCEs/04_COMBO.clean_others_diet.SEU.rds
    Ignored:    data/SCEs/04_COMBO.clean_tcells_diet.SEU.rds
    Ignored:    data/SCEs/04_COMBO.clustered.SEU.rds
    Ignored:    data/SCEs/04_COMBO.clustered_annotated_adt_diet.SEU.rds
    Ignored:    data/SCEs/04_COMBO.clustered_annotated_lung_diet.SEU.rds
    Ignored:    data/SCEs/04_COMBO.clustered_annotated_macrophages_diet.SEU.rds
    Ignored:    data/SCEs/04_COMBO.clustered_annotated_others_diet.SEU.rds
    Ignored:    data/SCEs/04_COMBO.clustered_annotated_tcells_diet.SEU.rds
    Ignored:    data/SCEs/04_COMBO.clustered_diet.SEU.rds
    Ignored:    data/SCEs/04_COMBO.integrated.SEU.rds
    Ignored:    data/SCEs/04_COMBO.macrophages_clustered.SEU.rds
    Ignored:    data/SCEs/04_COMBO.macrophages_integrated.SEU.rds
    Ignored:    data/SCEs/04_COMBO.others_clustered.SEU.rds
    Ignored:    data/SCEs/04_COMBO.others_integrated.SEU.rds
    Ignored:    data/SCEs/04_COMBO.tcells_clustered.SEU.rds
    Ignored:    data/SCEs/04_COMBO.tcells_integrated.SEU.rds
    Ignored:    data/SCEs/04_COMBO.zilionis_mapped.SEU.rds
    Ignored:    data/SCEs/05_CF_BAL_Pilot.transfer_adt.SEU.rds
    Ignored:    data/SCEs/05_COMBO.clean_clustered.SEU.rds
    Ignored:    data/SCEs/05_COMBO.clean_integrated.SEU.rds
    Ignored:    data/SCEs/05_COMBO.clean_macrophages_diet.SEU.rds
    Ignored:    data/SCEs/05_COMBO.clean_others_diet.SEU.rds
    Ignored:    data/SCEs/05_COMBO.clean_tcells_diet.SEU.rds
    Ignored:    data/SCEs/05_COMBO.clustered_annotated_adt_diet.SEU.rds
    Ignored:    data/SCEs/05_COMBO.clustered_annotated_lung_diet.SEU.rds
    Ignored:    data/SCEs/05_COMBO.clustered_annotated_macrophages_diet.SEU.rds
    Ignored:    data/SCEs/05_COMBO.clustered_annotated_others_diet.SEU.rds
    Ignored:    data/SCEs/05_COMBO.clustered_annotated_tcells_diet.SEU.rds
    Ignored:    data/SCEs/05_COMBO.macrophages_clustered.SEU.rds
    Ignored:    data/SCEs/05_COMBO.macrophages_integrated.SEU.rds
    Ignored:    data/SCEs/05_COMBO.others_clustered.SEU.rds
    Ignored:    data/SCEs/05_COMBO.others_integrated.SEU.rds
    Ignored:    data/SCEs/05_COMBO.tcells_clustered.SEU.rds
    Ignored:    data/SCEs/05_COMBO.tcells_integrated.SEU.rds
    Ignored:    data/SCEs/06_COMBO.clean_clustered.DIET.rds
    Ignored:    data/SCEs/06_COMBO.clean_clustered.SEU.rds
    Ignored:    data/SCEs/06_COMBO.clean_integrated.SEU.rds
    Ignored:    data/SCEs/06_COMBO.clean_macrophages_diet.SEU.rds
    Ignored:    data/SCEs/06_COMBO.clean_others_diet.SEU.rds
    Ignored:    data/SCEs/06_COMBO.clean_tcells_diet.SEU.rds
    Ignored:    data/SCEs/06_COMBO.macrophages_clustered.SEU.rds
    Ignored:    data/SCEs/06_COMBO.macrophages_clustered_dbl.SEU.rds
    Ignored:    data/SCEs/06_COMBO.macrophages_integrated.SEU.rds
    Ignored:    data/SCEs/06_COMBO.macrophages_integrated_dbl.SEU.rds
    Ignored:    data/SCEs/06_COMBO.others_clustered.SEU.rds
    Ignored:    data/SCEs/06_COMBO.others_integrated.SEU.rds
    Ignored:    data/SCEs/06_COMBO.tcells_clustered.SEU.rds
    Ignored:    data/SCEs/06_COMBO.tcells_integrated.SEU.rds
    Ignored:    data/SCEs/07_COMBO.clean_integrated.SEU.rds
    Ignored:    data/SCEs/07_COMBO.clean_macrophages_diet.SEU.rds
    Ignored:    data/SCEs/07_COMBO.macrophages_clustered.SEU.rds
    Ignored:    data/SCEs/07_COMBO.macrophages_integrated.SEU.rds
    Ignored:    data/SCEs/C133_Neeland.CellRanger.SCE.rds
    Ignored:    data/SCEs/experiment1_doublets.rds
    Ignored:    data/SCEs/experiment2_doublets.rds
    Ignored:    data/SCEs/obsolete/
    Ignored:    data/cellsnp-lite/
    Ignored:    data/emptyDrops/obsolete/
    Ignored:    data/obsolete/
    Ignored:    data/sample_sheets/obsolete/
    Ignored:    output/marker-analysis/obsolete/
    Ignored:    output/obsolete/
    Ignored:    rename_captures.R
    Ignored:    renv/library/
    Ignored:    renv/staging/
    Ignored:    wflow_background.R

Unstaged changes:
    Modified:   data/macrophage_subcluster_annotation_16.12.22.csv
Note that any generated files, e.g. HTML, png, CSS, etc., are not included in this status report because it is ok for generated content to have uncommitted changes.
These are the previous versions of the repository in which changes were made
to the R Markdown (analysis/13_COMBO.postprocess_others.Rmd) and HTML (docs/13_COMBO.postprocess_others.html)
files. If you’ve configured a remote Git repository (see
?wflow_git_remote), click on the hyperlinks in the table below to
view the files as they were in that past version.
| File | Version | Author | Date | Message |
|---|---|---|---|---|
| Rmd | 508dee7 | Jovana Maksimovic | 2022-12-20 | wflow_publish(c("analysis/postprocess_.Rmd")) |
| html | 16ace9e | Jovana Maksimovic | 2022-12-19 | Build site. |
| Rmd | e799f52 | Jovana Maksimovic | 2022-12-19 | wflow_publish(c("analysis/emptyDrops.Rmd", "analysis/postprocess*.Rmd", |
| html | 63f8ee8 | Jovana Maksimovic | 2022-12-15 | Build site. |
| Rmd | 916bafa | Jovana Maksimovic | 2022-12-15 | wflow_publish(c("analysis/.emptyDrops.Rmd", "analysis/postprocess_*.Rmd", |
| Rmd | f3b7b92 | Jovana Maksimovic | 2022-06-16 | Submission version |
| html | f3b7b92 | Jovana Maksimovic | 2022-06-16 | Submission version |
1 Load libraries
2 Load Data
out <- here("data/SCEs/06_COMBO.others_clustered.SEU.rds")
seuInt <- readRDS(file = out)

seuInt
An object of class Seurat
33706 features across 5967 samples within 3 assays
Active assay: integrated (3000 features, 3000 variable features)
2 other assays present: RNA, SCT
2 dimensional reductions calculated: pca, umap3 Sub-cluster annotation
3.1 Load manual annotations
labels <- read_csv(here("data/others_subcluster_annotation_29.05.22.csv"))

seuInt@meta.data %>%
  left_join(labels %>%
              mutate(Annotation = ifelse(is.na(Annotation),
                                         "SUSPECT",
                                         Annotation),
                     Broad = ifelse(is.na(Broad),
                                         "SUSPECT",
                                         Broad)) %>%
              mutate(Cluster = as.factor(Cluster),
                     Annotation = as.factor(Annotation)),
            by = c("integrated_snn_res.1" = "Cluster")) -> ann

ann %>% dplyr::pull(Annotation) -> seuInt$Annotation
ann %>% dplyr::pull(Broad) -> seuInt$Broad

seuInt$Annotation <- fct_drop(seuInt$Annotation)
seuInt$Broad <- fct_drop(seuInt$Broad)
seuInt
An object of class Seurat
33706 features across 5967 samples within 3 assays
Active assay: integrated (3000 features, 3000 variable features)
2 other assays present: RNA, SCT
2 dimensional reductions calculated: pca, umap3.2 Check for doublet enrichment
We have already removed a total of 3826 heterogenic, cross-sample doublets based on vireo and hashedDrops calls. However, those methods cannot detect heterotypic and homotypic within-sample doublets. We have also run scds and scDblFinder to detect putative within-sample doublets.
Load doublet detection results and match up with annotated cells.
e1Doublets <- readRDS(here("data/SCEs/experiment1_doublets.rds"))
e1Doublets$cell <- paste0("A-", e1Doublets$cell)
e2Doublets <- readRDS(here("data/SCEs/experiment2_doublets.rds"))
e2Doublets$cell <- paste0("B-", e2Doublets$cell)

doublets <- rbind(e1Doublets, e2Doublets)
m <- match(colnames(seuInt), doublets$cell)
doublets <- doublets[m,]
all(doublets$cell == colnames(seuInt))
[1] TRUENo clusters are comprised of >10% putative doublets.
table(doublets$scDblFinder.class == "doublet" & doublets$hybrid_call,
      seuInt$Annotation) %>%
  data.frame %>%
  group_by(Var2) %>%
  mutate(prop = Freq/sum(Freq)) %>%
  ungroup() %>%
  ggplot(aes(x = Var2, y = prop, fill = Var1)) +
  geom_col() +
  theme(axis.text.x = element_text(angle = 90, vjust = 0.5, hjust = 1)) +
  geom_hline(yintercept = 0.1, linetype = "dashed") +
  labs(fill = "Doublet",
       x = "Fine annotation",
       y = "Proportion") -> p1

table(doublets$scDblFinder.class == "doublet" & doublets$hybrid_call,
      seuInt$Annotation) %>%
  data.frame %>%
  ggplot(aes(x = Var2, y = Freq, fill = Var1)) +
  geom_col() +
  theme(axis.text.x = element_text(angle = 90, vjust = 0.5, hjust = 1)) +
  labs(fill = "Doublet",
       x = "Fine annotation",
       y = "Frequency") -> p2

(p2 | p1) + plot_layout(guides = "collect") &
  theme(legend.position = "bottom")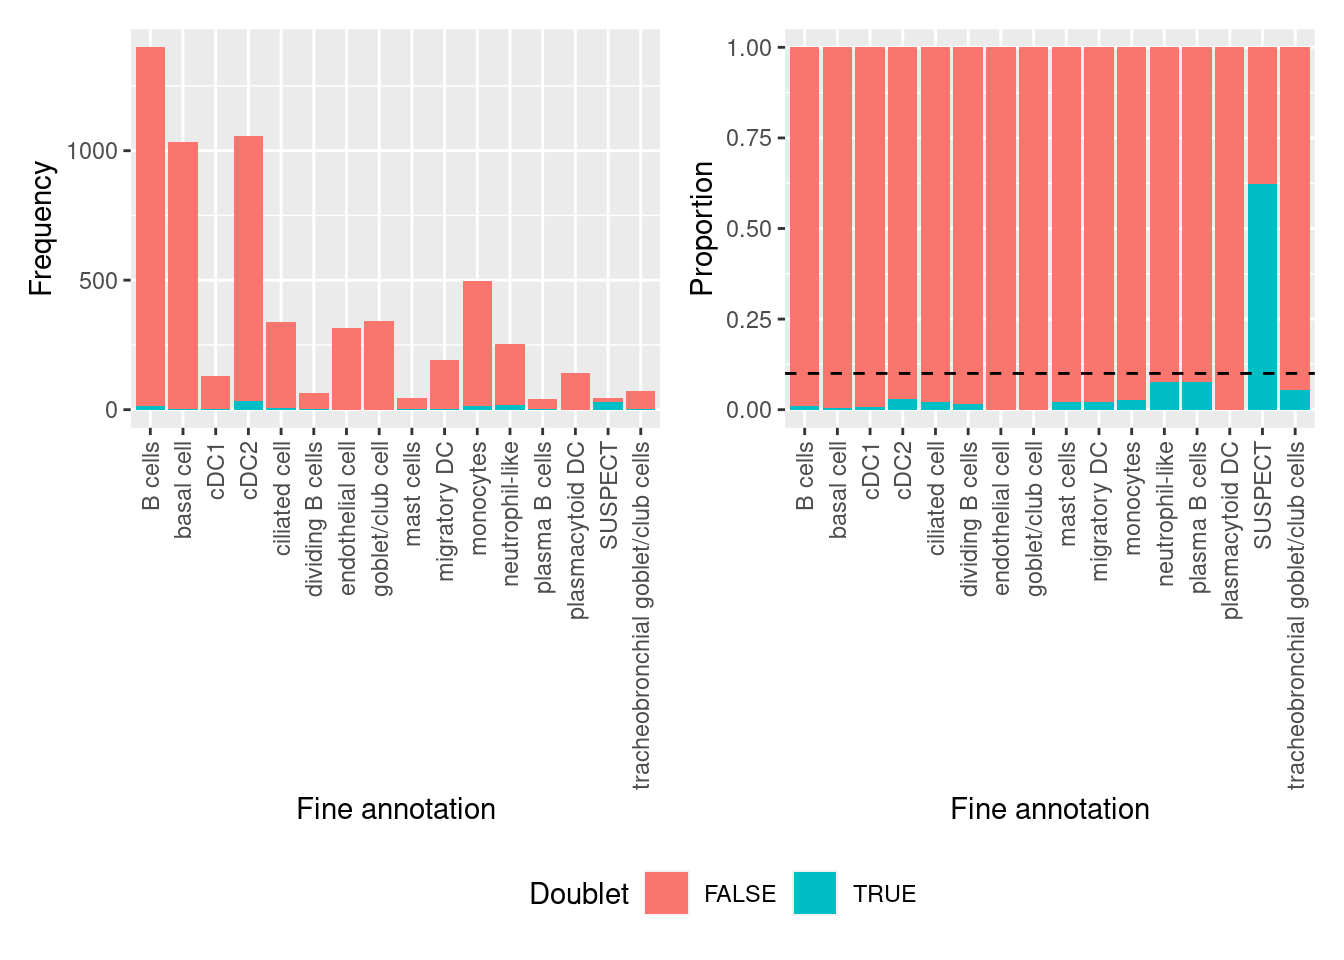
Calculate if doublets are statistically over-represented in any clusters using Fisher’s Exact Test. Only the SUSPECT cluster and the neutrophil-like clusters are significantly over-represented for putative doublets. As the SUSPECT cluster will be filtered out and the neutrophil-like cluster has <10% putative doublets, there will be no further cell filtering.
tab <- table(doublets$scDblFinder.class == "doublet" & doublets$hybrid_call,
      seuInt$Annotation)
dblStats <- table(doublets$scDblFinder.class == "doublet" & doublets$hybrid_call)

apply(tab, 2, function(x){
  dblFreq <- matrix(c(x[2], dblStats[2] - x[2], x[1], dblStats[1] - x[1]),
                      nrow = 2,
                  dimnames = list(c("In cluster", "Not in cluster"),
                                  c("Doublet", "Singlet")))
  fisher.test(dblFreq, alternative = "greater")$p.value
}) -> pvals

pvals %>%
  data.frame %>%
  rownames_to_column(var = "cell") %>%
  dplyr::rename("p.value" = ".") %>%
  mutate(FDR = p.adjust(p.value, method = "BH")) %>%
  ggplot(aes(y = -log10(FDR), x = cell,
             fill = FDR < 0.05)) +
  theme(axis.text.x = element_text(angle = 90, vjust = 0.5, hjust = 1)) +
geom_col() 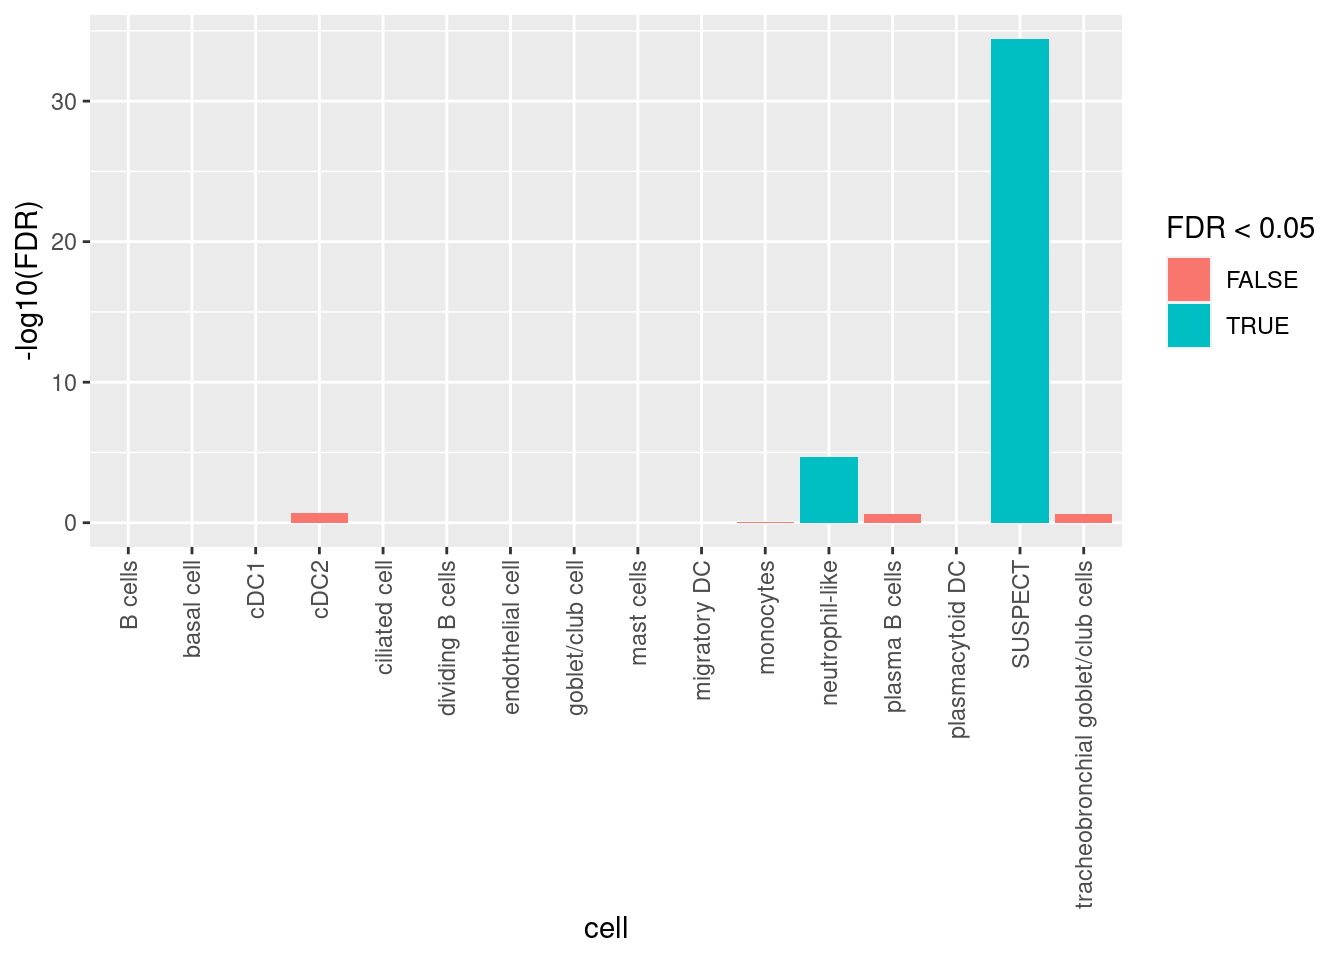
| Version | Author | Date |
|---|---|---|
| 16ace9e | Jovana Maksimovic | 2022-12-19 |
3.3 Visulalise annotations
options(ggrepel.max.overlaps = Inf)
DimPlot(seuInt, reduction = 'umap', label = TRUE, repel = TRUE,
        label.size = 2.5, group.by = "integrated_snn_res.1") +
  NoLegend() -> p1
DimPlot(seuInt, reduction = 'umap', label = TRUE, repel = TRUE,
        label.size = 2.5, group.by = "Annotation") +
  NoLegend() +
  scale_color_paletteer_d("miscpalettes::pastel") -> p2
DimPlot(seuInt, reduction = 'umap', label = TRUE, repel = TRUE,
        label.size = 2.5, group.by = "Broad") +
  NoLegend() +
  scale_color_paletteer_d("miscpalettes::pastel") -> p3

(p1 | p2 | p3) & theme(text = element_text(size = 8),
                  axis.text = element_text(size = 8))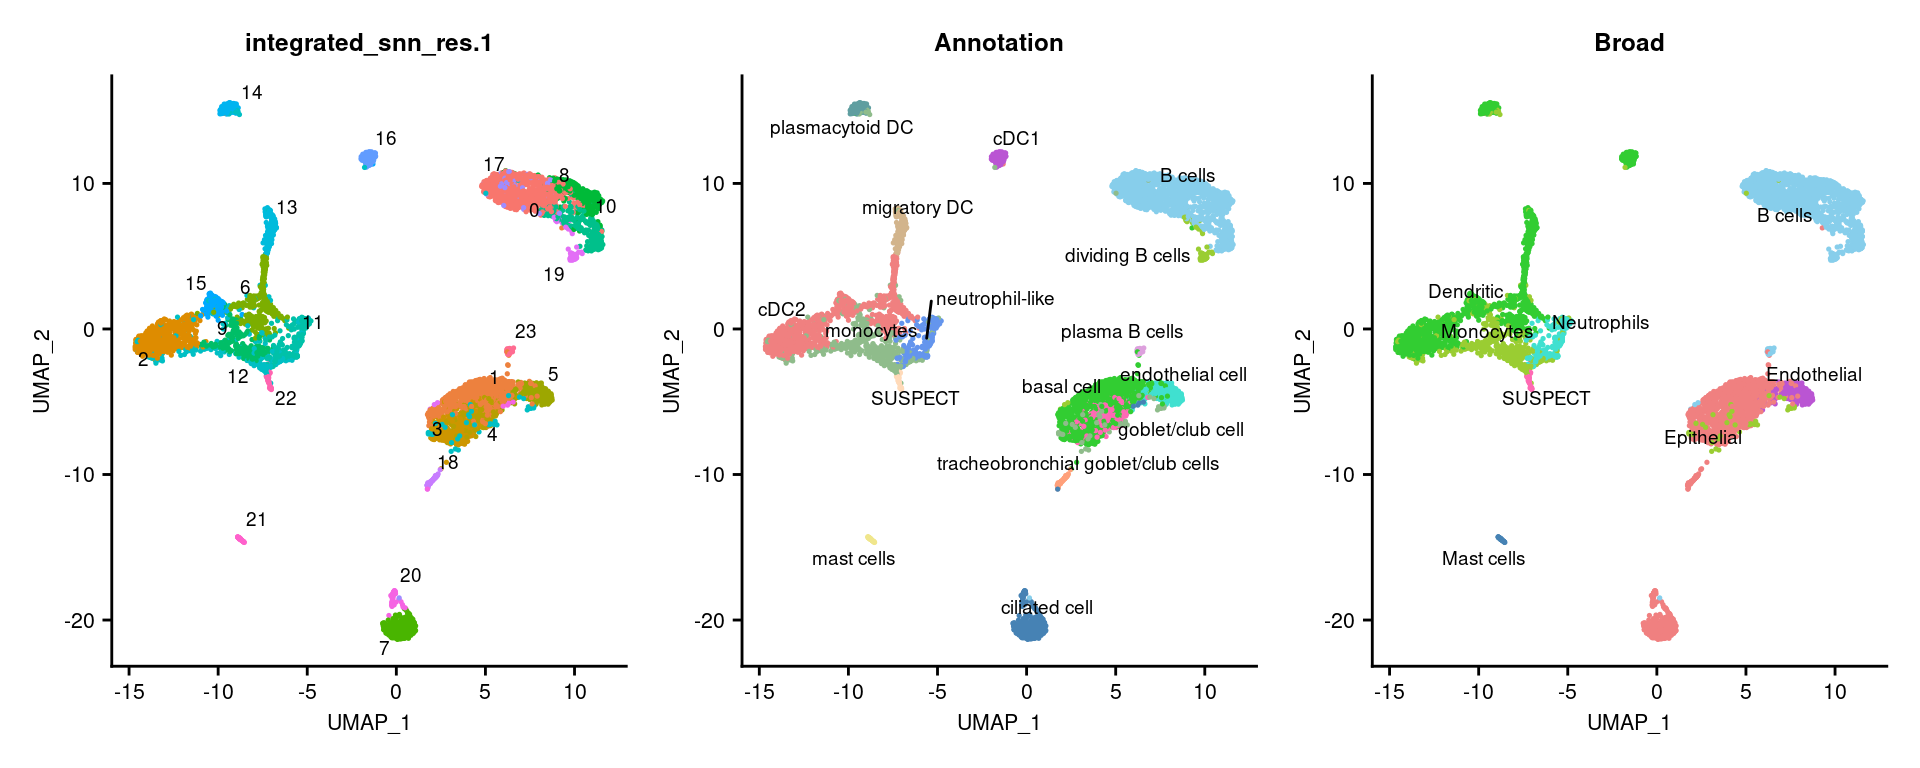
3.3.1 No. cells per cluster
seuInt@meta.data %>%
  ggplot(aes(x = Annotation, fill = Annotation)) +
  geom_bar() +
  geom_text(aes(label = ..count..), stat = "count",
            vjust = -0.5, colour = "black", size = 2) +
  theme(axis.text.x = element_text(angle = 90, vjust = 0.5, hjust = 1)) +
  NoLegend() +
  scale_fill_paletteer_d("miscpalettes::pastel")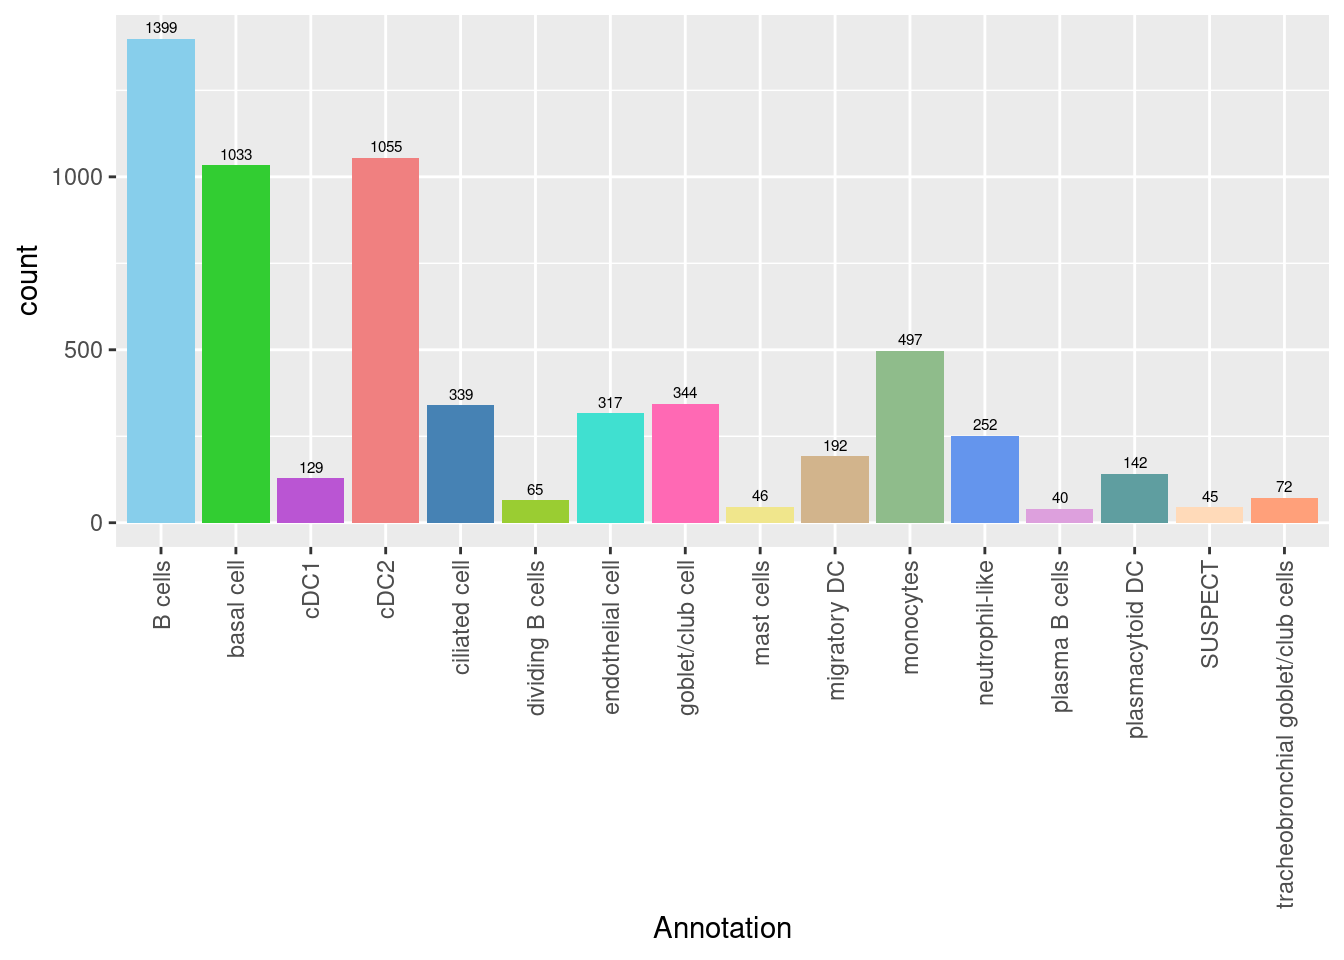
| Version | Author | Date |
|---|---|---|
| 16ace9e | Jovana Maksimovic | 2022-12-19 |
seuInt@meta.data %>%
  ggplot(aes(x = Broad, fill = Broad)) +
  geom_bar() +
  geom_text(aes(label = ..count..), stat = "count",
            vjust = -0.5, colour = "black", size = 2) +
  theme(axis.text.x = element_text(angle = 90, vjust = 0.5, hjust = 1)) +
  NoLegend() +
  scale_fill_paletteer_d("miscpalettes::pastel")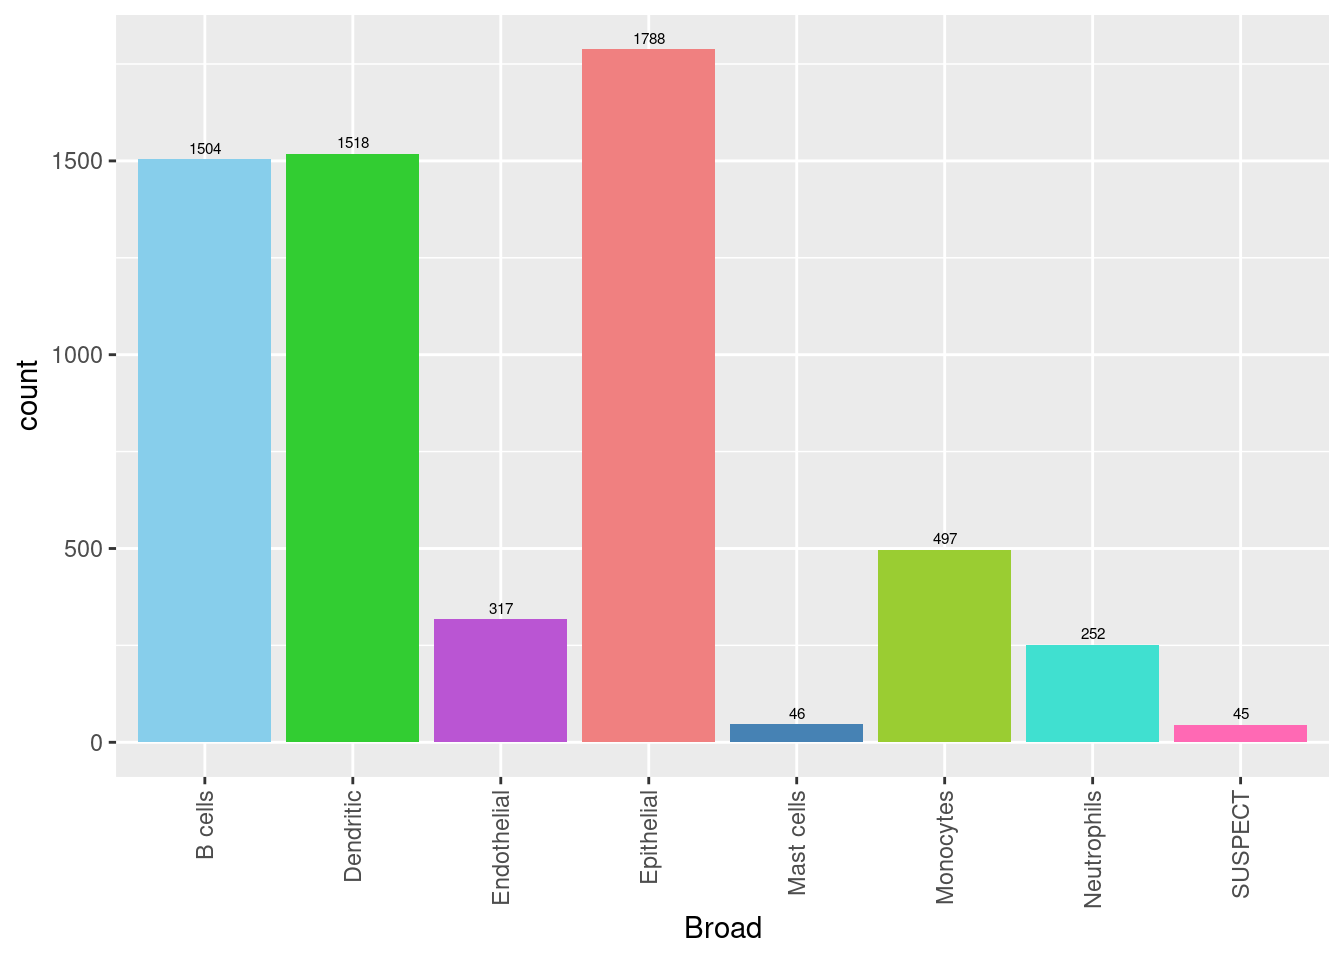
| Version | Author | Date |
|---|---|---|
| 16ace9e | Jovana Maksimovic | 2022-12-19 |
3.3.2 Remove SUSPECT clusters
seuInt <- subset(seuInt, cells = which(seuInt$Annotation != "SUSPECT"))
seuInt$Annotation <- fct_drop(seuInt$Annotation)
seuInt$Broad <- fct_drop(seuInt$Broad)

DefaultAssay(seuInt) <- "integrated"
seuInt <- RunPCA(seuInt, verbose = FALSE, dims = 1:30) %>%
  RunUMAP(verbose = FALSE, dims = 1:30)
seuInt@meta.data %>%
count(Annotation) %>%
mutate(perc = round(n/sum(n)*100,1)) %>%
dplyr::rename(`Cell Label` = "Annotation",
`No. Cells` = n,
`% Cells` = perc) %>%
knitr::kable()| Cell Label | No. Cells | % Cells |
|---|---|---|
| B cells | 1399 | 23.6 |
| basal cell | 1033 | 17.4 |
| cDC1 | 129 | 2.2 |
| cDC2 | 1055 | 17.8 |
| ciliated cell | 339 | 5.7 |
| dividing B cells | 65 | 1.1 |
| endothelial cell | 317 | 5.4 |
| goblet/club cell | 344 | 5.8 |
| mast cells | 46 | 0.8 |
| migratory DC | 192 | 3.2 |
| monocytes | 497 | 8.4 |
| neutrophil-like | 252 | 4.3 |
| plasma B cells | 40 | 0.7 |
| plasmacytoid DC | 142 | 2.4 |
| tracheobronchial goblet/club cells | 72 | 1.2 |
3.4 Visualise annotations
DimPlot(seuInt, reduction = 'umap', label = TRUE, repel = TRUE,
        label.size = 3, group.by = "Annotation") +
  NoLegend() +
  scale_color_paletteer_d("miscpalettes::pastel") -> p2

DimPlot(seuInt, reduction = 'umap', label = TRUE, repel = TRUE,
        label.size = 3, group.by = "Broad") +
  NoLegend() +
  scale_color_paletteer_d("miscpalettes::pastel") -> p1

(p1) & theme(text = element_text(size = 8),
                  axis.text = element_text(size = 8))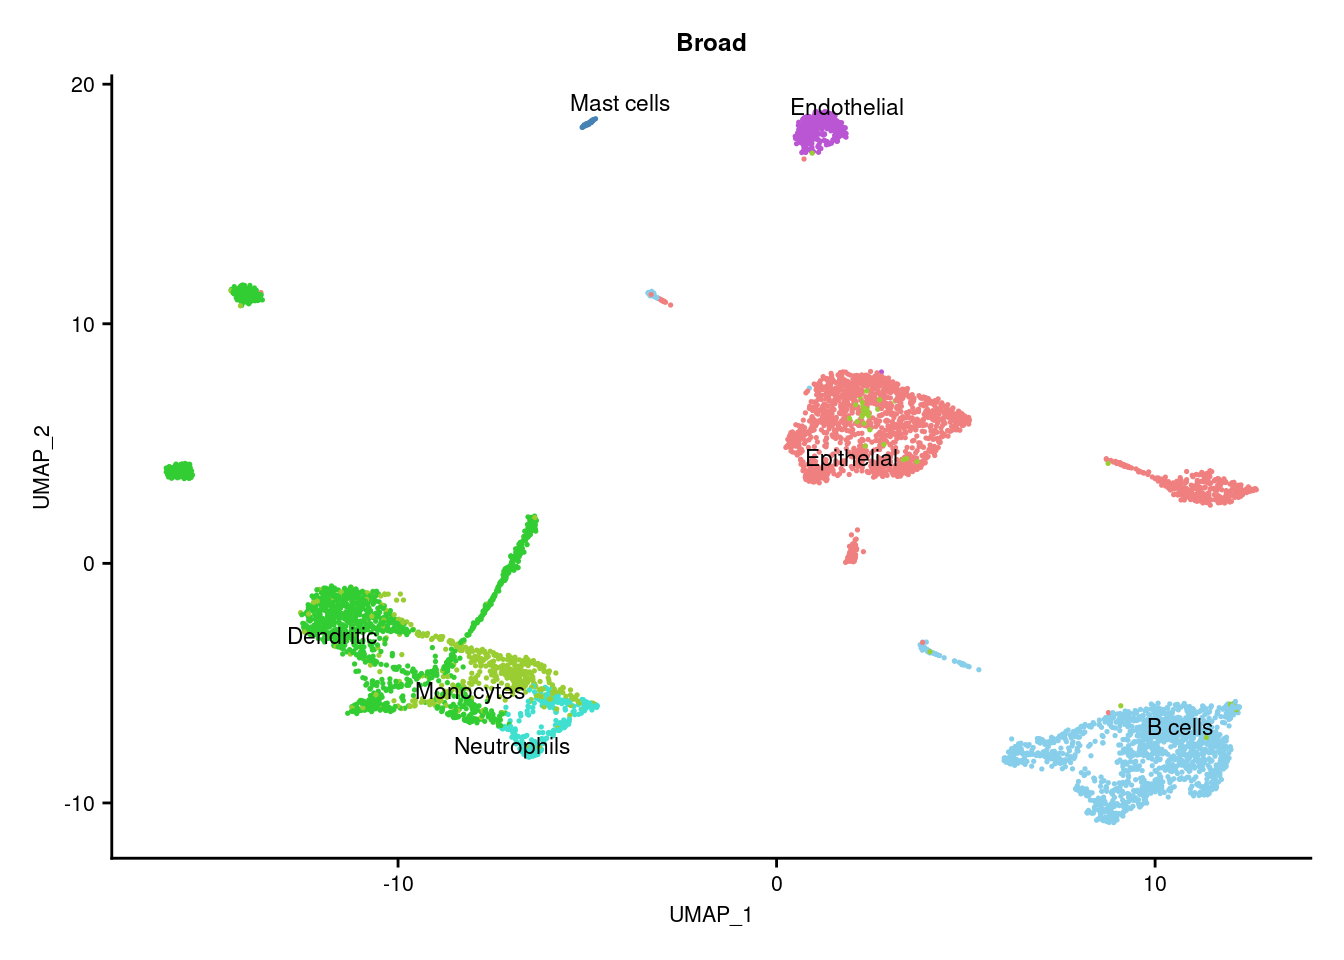
(p2) & theme(text = element_text(size = 8),
                  axis.text = element_text(size = 8)) -> f4a
f4a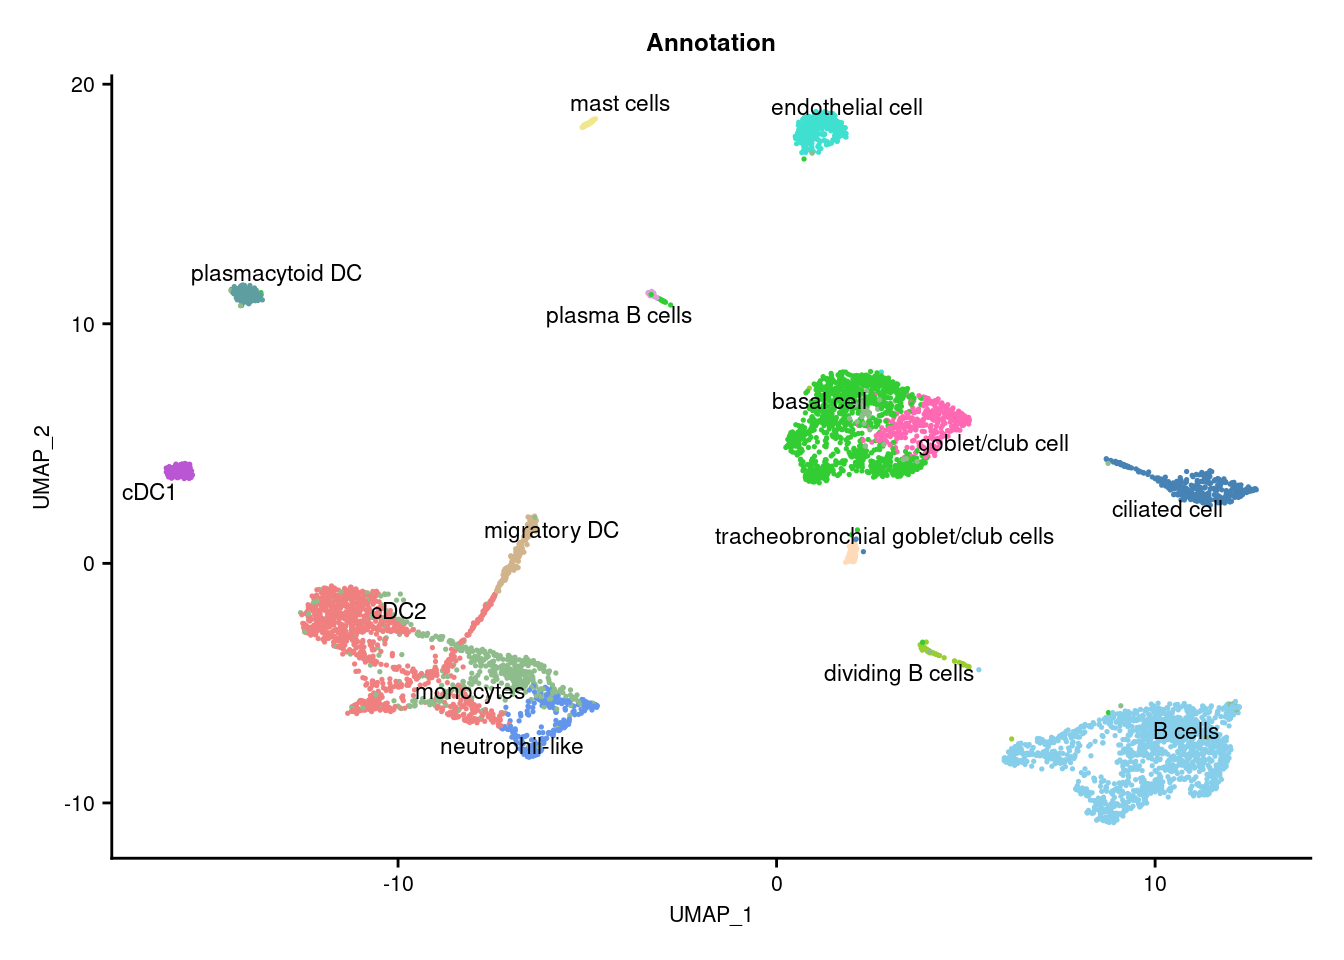
3.5 Cepo cluster marker genes
cepoMarkers <- Cepo(seuInt[["RNA"]]@data,
                   seuInt$Annotation,
                   exprsPct = 0.1,
                   logfc = 1)

sapply(1:ncol(cepoMarkers$stats), function(i){
  names(sort(cepoMarkers$stats[,i], decreasing = TRUE))[1:20]
}) -> dat

colnames(dat) <- colnames(cepoMarkers$stats)
dat %>% knitr::kable()| B.cells | basal.cell | cDC1 | cDC2 | ciliated.cell | dividing.B.cells | endothelial.cell | goblet.club.cell | mast.cells | migratory.DC | monocytes | neutrophil.like | plasma.B.cells | plasmacytoid.DC | tracheobronchial.goblet.club.cells |
|---|---|---|---|---|---|---|---|---|---|---|---|---|---|---|
| MS4A1 | KRT6A | CLEC9A | CLEC10A | DNAH9 | MS4A1 | ACKR1 | TFF1 | TPSAB1 | CCR7 | CLEC10A | FCN1 | TNFRSF17 | SCT | TSPAN8 |
| TNFRSF13C | KRT17 | XCR1 | FPR3 | MORN5 | PAX5 | RAMP3 | AZGP1 | MS4A2 | LAMP3 | FPR3 | CD300E | MZB1 | GZMB | FAM3D |
| CD19 | KRT5 | LGALS2 | CD1E | C11orf88 | FCRLA | NNMT | FST | CPA3 | LAD1 | CSF1R | FPR1 | ZBP1 | CLEC4C | KLK11 |
| LINC00926 | PI3 | CADM1 | CD1C | DYNLRB2 | TNFRSF13C | CLDN5 | MUC5AC | SLC18A2 | CCL22 | LILRB3 | LILRB2 | DERL3 | LILRA4 | SERPINB3 |
| TNFRSF13B | SFN | C1orf54 | FCER1A | CAPSL | CD79A | SPARCL1 | SYT8 | HDC | IDO1 | F13A1 | VCAN | JCHAIN | MAP1A | CYP2F1 |
| CD79A | AZGP1 | ENPP1 | LGALS2 | C11orf97 | CD19 | TM4SF18 | KRT17 | TPSB2 | SLCO5A1 | TREM2 | IL1B | CD27 | PTCRA | CHST9 |
| PAX5 | S100A2 | GNAO1 | AXL | SNTN | VPREB3 | VWF | TM4SF1 | GATA2 | TNFRSF11A | FCGR2B | LILRB3 | TNFRSF13B | MZB1 | CCNO |
| IGHD | TCN1 | S100B | SLC8A1 | TSPAN19 | TCL1A | RAMP2 | KRT7 | IL1RL1 | GPR157 | CLEC5A | S100A8 | POU2AF1 | LRRC26 | ADH1C |
| CD79B | SYT8 | RAB7B | CSF1R | C1orf194 | POU2AF1 | TIMP3 | PI3 | KCNH2 | CST7 | FPR1 | LILRA5 | CD79A | PACSIN1 | CXCL17 |
| CD22 | KRT7 | P2RY6 | CST7 | ENKUR | BCAS4 | CLEC14A | IGFBP3 | KIT | ANKRD33B | SLC8A1 | ITGAM | TENT5C | FAM129C | SOX2 |
| FCRL5 | S100A14 | SNX22 | IGSF6 | TMEM190 | CD79B | LDB2 | S100A2 | NTRK1 | TREML1 | PLXDC2 | OSM | FCRL5 | LAMP5 | AQP5 |
| VPREB3 | FST | DNASE1L3 | FCGR2B | DYDC2 | BIRC5 | FAM167B | PTGES | TPSD1 | CCL19 | IGSF6 | CSF1R | IGHA1 | PLD4 | TMPRSS4 |
| FCMR | S100A16 | CLNK | PKIB | SPAG6 | PCLAF | PLVAP | KRT6A | GCSAML | IL7R | FGL2 | AQP9 | PRDM1 | JCHAIN | MUC4 |
| BLK | RHOV | FLT3 | JAML | TEKT1 | CD22 | CCL14 | CLDN10 | LIF | IL4I1 | C3AR1 | CLEC4E | CD79B | SMPD3 | CRYM |
| LINC02397 | LYPD3 | FBXO27 | P2RY13 | EFCAB1 | MYBL2 | PCDH17 | STEAP4 | SLC45A3 | TVP23A | FCGR2A | CCL3 | CPNE5 | DRD4 | SLC44A4 |
| FCRLA | TM4SF1 | IDO1 | CPVL | C9orf135 | TLR10 | RBP7 | AQP5 | KRT1 | HMSD | ITGAM | APOBEC3A | SLAMF7 | SHD | UPK1B |
| FCER2 | KRT6B | SLAMF8 | CLEC5A | FAM216B | AURKB | ESAM | MSLN | SIGLEC6 | FLT3 | MS4A6A | SEMA6B | TXNDC5 | DERL3 | KRT7 |
| BANK1 | PITX1 | CST7 | FGL2 | CFAP53 | ACY3 | NUAK1 | RARRES1 | CDK15 | PTGIR | CLEC7A | CCR1 | GLCCI1 | SELL | CYP4B1 |
| FCRL2 | FAM83A | BATF3 | SUCNR1 | FAM183A | MKI67 | CAVIN2 | AGR2 | GRAP2 | LGALS2 | TNFSF13B | CSF3R | NUGGC | LILRB4 | CHL1 |
| SPIB | TFF1 | WDFY4 | FPR1 | RSPH1 | ASF1B | NR2F2 | GPRC5A | TMEM233 | NR4A3 | AXL | FYB1 | FKBP11 | SPIB | F3 |
3.5.1 Cepo marker gene dot plot
Genes duplicated between clusters are excluded.
DefaultAssay(seuInt) <- "RNA"

maxGenes <- 5
sigGenes <- lapply(1:ncol(dat), function(i){
  dat[,i][1:maxGenes]
})
sig <- unlist(sigGenes)
geneCols <- c(rep(rep(c("blue","black"), each = maxGenes),
                  ceiling(ncol(dat)/2)))[1:length(sig)][!duplicated(sig)]

geneCols <- rep(paletteer_d("miscpalettes::pastel", ncol(dat)),
                each = maxGenes)[1:length(sig)][!duplicated(sig)]

pal <- paletteer::paletteer_d("vapoRwave::cool")
DotPlot(seuInt,
        features = sig[!duplicated(sig)],
        group.by = "Annotation",
        dot.scale = 2.5) +
  FontSize(y.text = 10, x.text = 8) +
  labs(y = element_blank(), x = element_blank()) +
  theme(axis.text.x = element_text(color = geneCols,
                                   angle = 90,
                                   hjust = 1,
                                   vjust = 0.5,
                                   face = "bold"),
        legend.text = element_text(size = 8),
        legend.title = element_text(size = 10)) +
  scale_color_gradient2(low = pal[1],
                        mid = pal[3],
                        high = pal[5]) -> f4c
f4c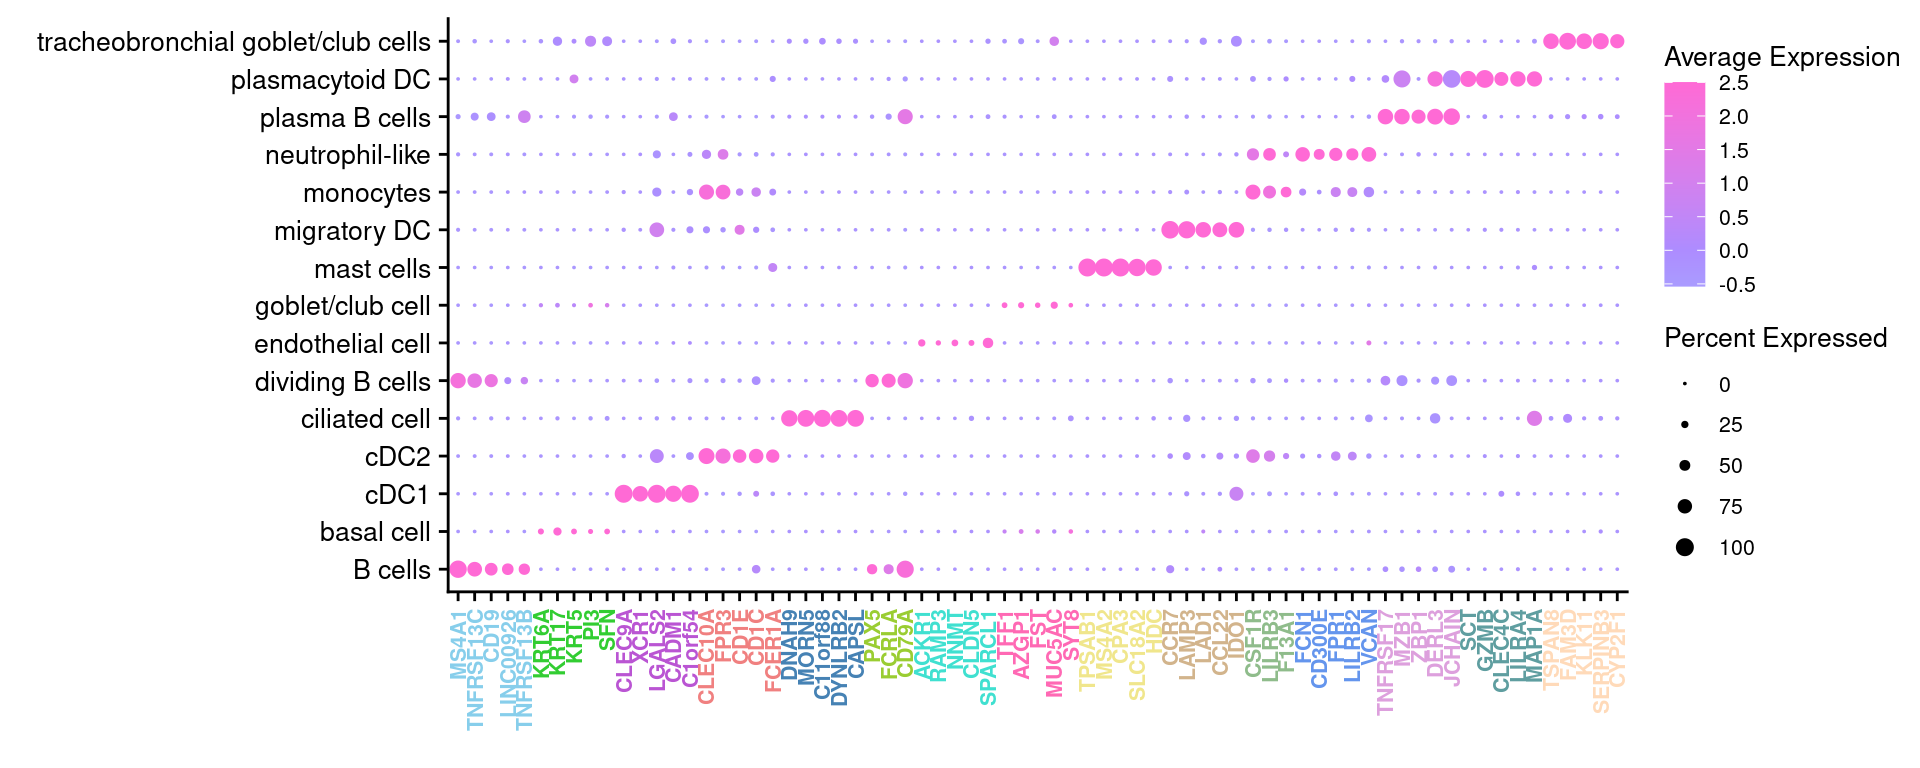
| Version | Author | Date |
|---|---|---|
| 16ace9e | Jovana Maksimovic | 2022-12-19 |
3.6 Visualise cytokines of interest
markers <- read_csv(file = here("data",
                                "other_subclusters_cytokines.csv"),
                    col_names = FALSE)
p <- DotPlot(seuInt,
             features = markers$X1,
             cols = c("grey", "red"),
             dot.scale = 5,
             assay = "RNA",
             group.by = "Annotation") +
  theme(axis.text.x = element_text(angle = 90,
                                   hjust = 1,
                                   vjust = 0.5,
                                   size = 8),
        axis.text.y = element_text(size = 8),
        text = element_text(size = 8)) +
  coord_flip() +
  labs(y = "Label", x = "Cytokine")

p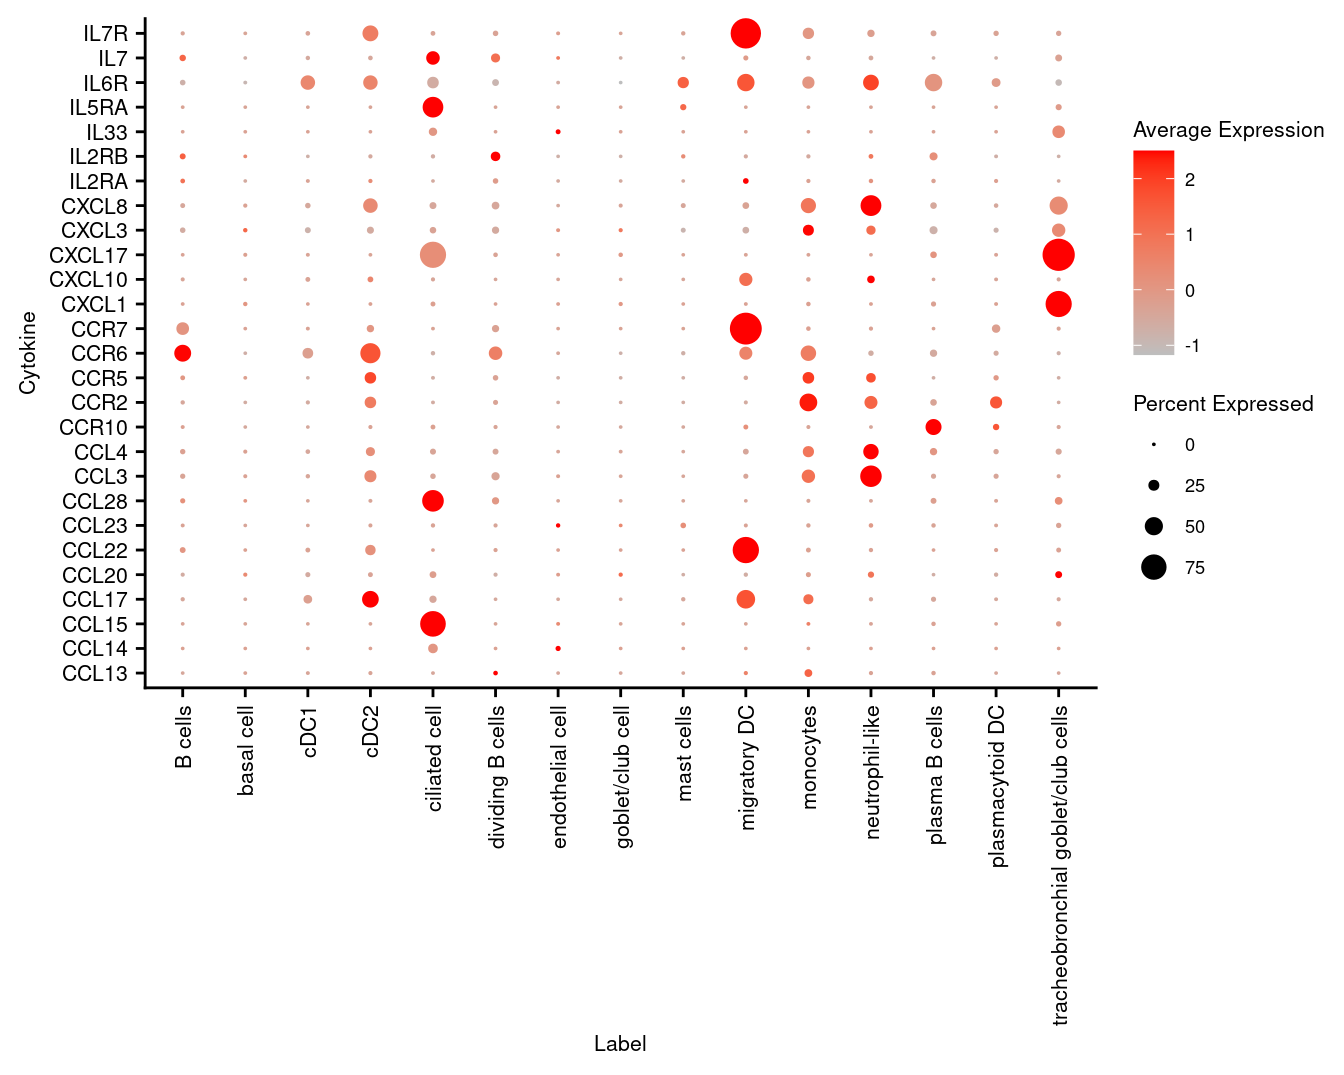
4 Load protein data
4.1 Add to Seurat object
seuAdt <- readRDS(here("data",
                       "SCEs",
                       "05_COMBO.clustered_annotated_adt_diet.SEU.rds"))
seuAdt <- subset(seuAdt, cells = colnames(seuInt))
all(colnames(seuAdt) == colnames(seuInt))
[1] TRUEseuInt[["ADT.dsb"]] <- seuAdt[["ADT.dsb"]]
seuInt[["ADT.raw"]] <- seuAdt[["ADT.raw"]]
seuIntAn object of class Seurat
34028 features across 5922 samples within 5 assays
Active assay: RNA (16001 features, 0 variable features)
4 other assays present: SCT, integrated, ADT.dsb, ADT.raw
2 dimensional reductions calculated: pca, umaprm(seuAdt)
gc() used (Mb) gc trigger (Mb) max used (Mb)
Ncells 9904609 529.0 14642867 782.1 14642867 782.1
Vcells 262468134 2002.5 868076594 6622.9 834347238 6365.64.2 Load protein annotations
prots <- read_csv(file = here("data",
                              "sample_sheets",
                              "TotalSeq-A_Universal_Cocktail_v1.0.csv")) %>%
  dplyr::filter(grepl("^A0", id)) %>%
  dplyr::filter(!grepl("[Ii]sotype", name))
4.3 Visualise all ADTs
Normalised with DSB. C133_Neeland ADT data was transferred to CF_BAL_Pilot using reference mapping and transfer.
cbind(seuInt@meta.data,
      as.data.frame(t(seuInt@assays$ADT.dsb@data))) %>%
  dplyr::group_by(Annotation, experiment) %>%
  dplyr::summarize_at(.vars = prots$id, .funs = median) %>%
  pivot_longer(c(-Annotation, -experiment), names_to = "ADT",
               values_to = "ADT Exp.") %>%
  left_join(prots, by = c("ADT" = "id")) %>%
  mutate(`Cell Label` = Annotation) %>%
  dplyr::rename(Protein = name) |>
  dplyr::filter(experiment == 2) |>
  ungroup() -> dat

plot(density(dat$`ADT Exp.`))
topMax <- 8
abline(v = topMax, lty = 2, col = "grey")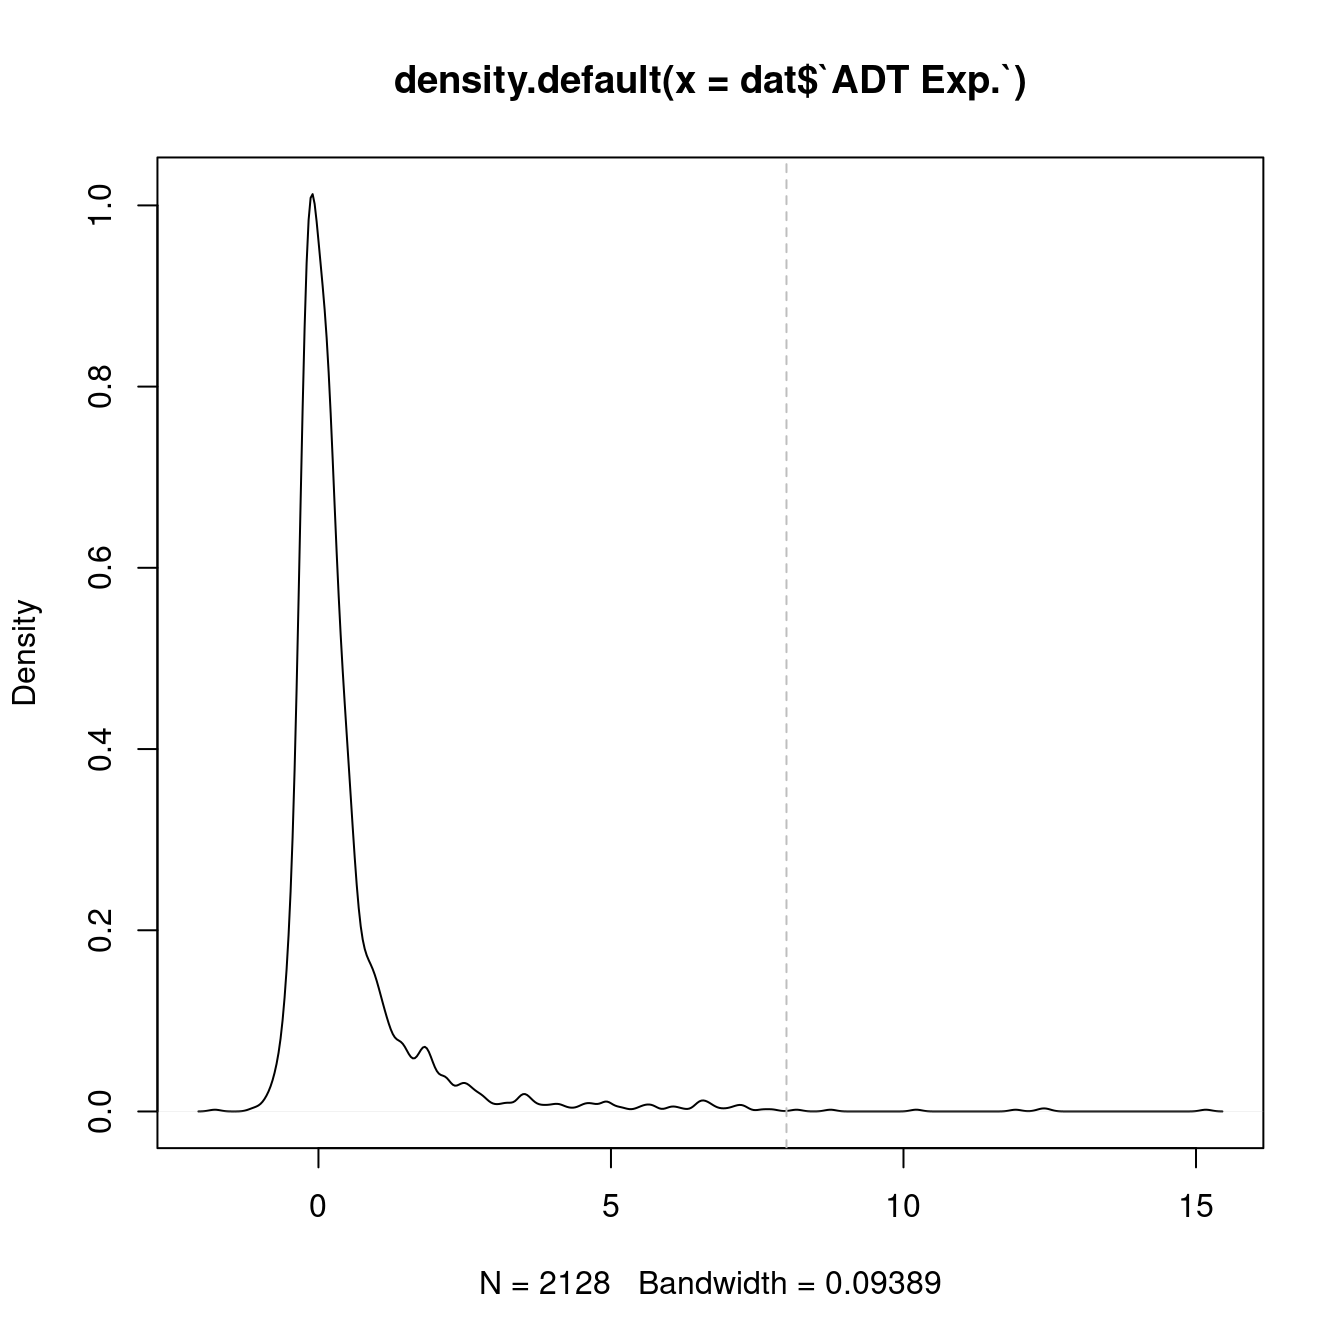
| Version | Author | Date |
|---|---|---|
| 16ace9e | Jovana Maksimovic | 2022-12-19 |
dat |> heatmap(
  .column = `Cell Label`,
  .row = Protein,
  .value = `ADT Exp.`,
  scale = "none",
  rect_gp = grid::gpar(col = "white", lwd = 1),
  show_row_names = TRUE,
  column_names_gp = grid::gpar(fontsize = 10),
  column_title_gp = grid::gpar(fontsize = 12),
  row_names_gp = grid::gpar(fontsize = 8),
  row_title_gp = grid::gpar(fontsize = 12),
  column_title_side = "top",
  palette_value = circlize::colorRamp2(seq(-1, topMax, length.out = 256),
                                       viridis::magma(256)),
heatmap_legend_param = list(direction = "vertical")) 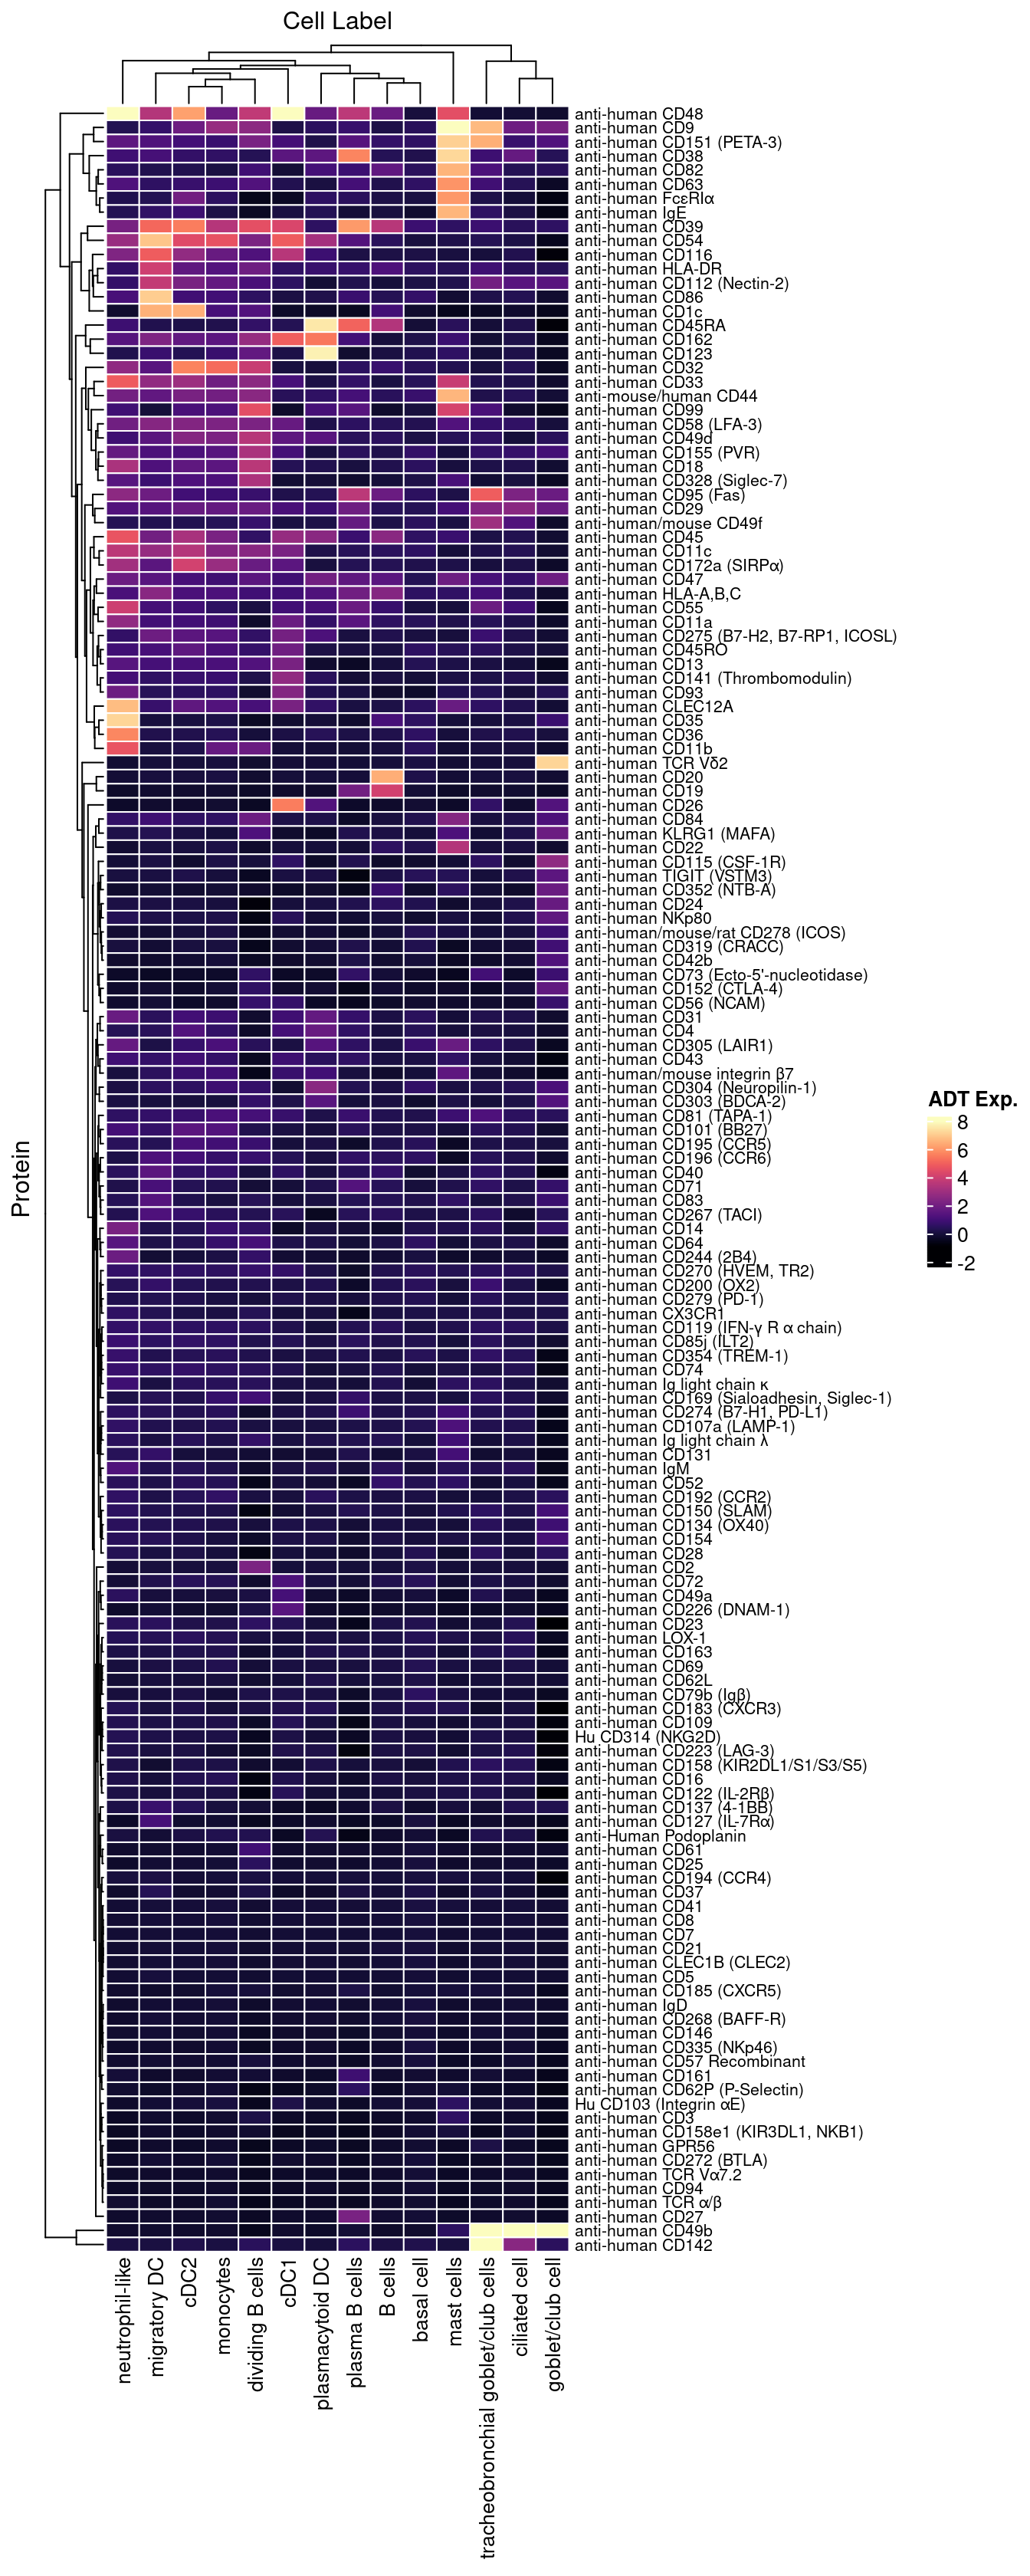
4.4 Visualise ADTs of interest
adt <- read_csv(file = here("data/Proteins_other_22.04.22.csv"))
adt <- adt[!duplicated(adt$DNA_ID),]

pal <- paletteer_d("miscpalettes::pastel", length(levels(seuInt$Annotation)))
names(pal) <- levels(seuInt$Annotation)
pal <- pal[names(pal) %in% unique(as.character(seuInt$Annotation[seuInt$experiment == 2]))]

dat |>
  dplyr::inner_join(adt, by = c("ADT" = "DNA_ID")) |>
  mutate(Protein = `Name for heatmap`) |>
  heatmap(
    .column = Protein,
    .row = `Cell Label`,
    .value = `ADT Exp.`,
    scale = "none",
    rect_gp = grid::gpar(col = "white", lwd = 1),
    show_row_names = TRUE,
    column_names_gp = grid::gpar(fontsize = 10),
    column_title_gp = grid::gpar(fontsize = 12),
    row_names_gp = grid::gpar(fontsize = 10),
    row_title_gp = grid::gpar(fontsize = 12),
    column_title_side = "bottom",
    palette_value = circlize::colorRamp2(seq(-1, topMax, length.out = 256),
                                         viridis::magma(256)),
    heatmap_legend_param = list(direction = "vertical"),
    column_title_side = "bottom") |>
  add_tile(`Cell Label`, show_legend = FALSE,
           show_annotation_name = FALSE,
           palette = pal) -> f4d
f4d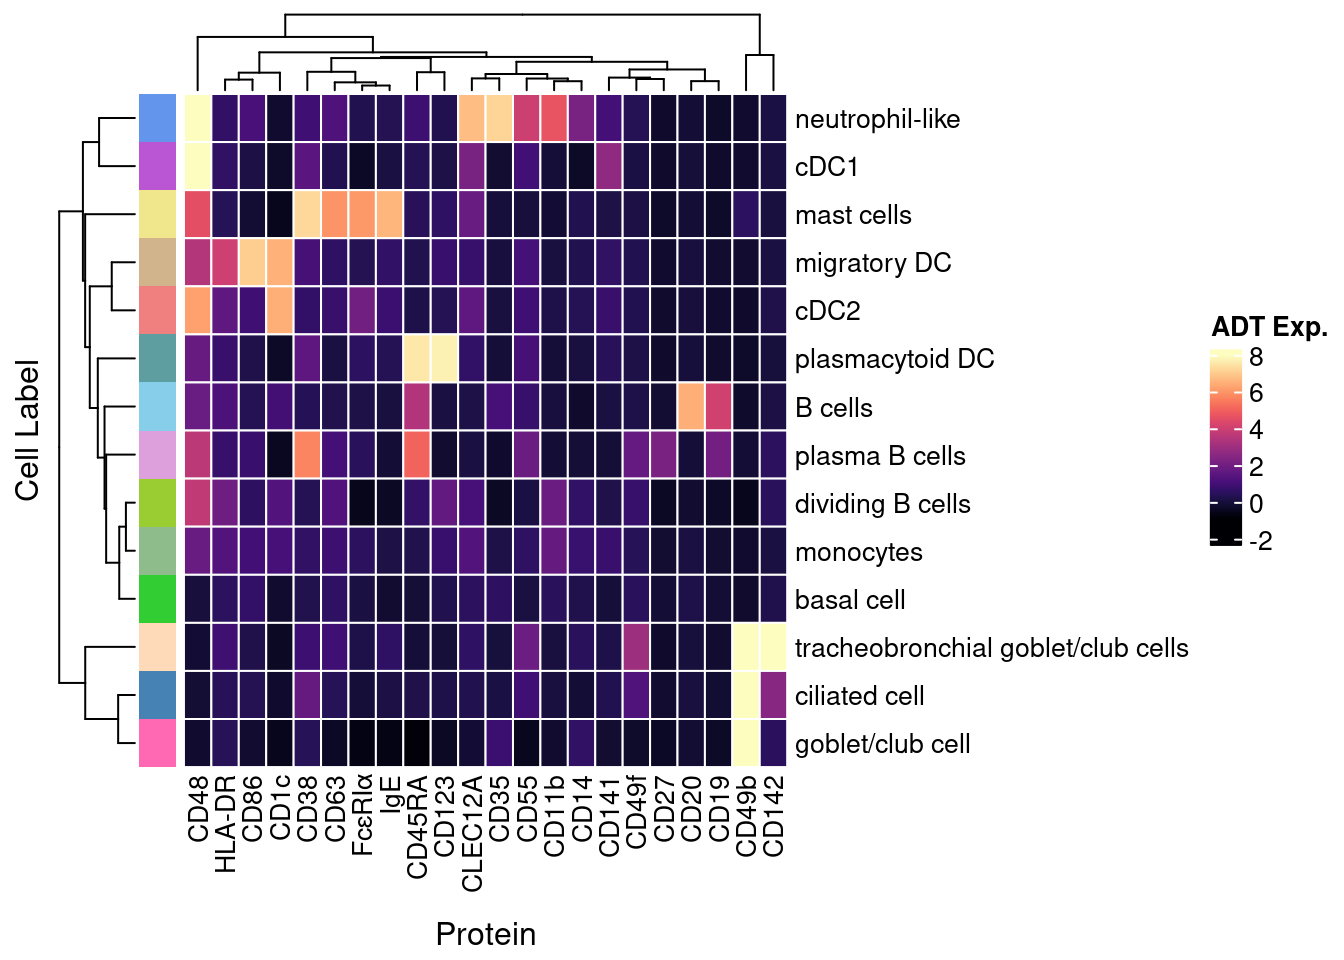
5 Proportions analysis
5.1 Load clinical information
Import clinical characteristics and patient information and associate with genetic_donor IDs.
info <- read.csv(file = here("data/sample_sheets/Sample_information.csv"))
tab <- table(seuInt$HTO, seuInt$donor)
tab <- tab[rownames(tab) != "Unknown",]

apply(tab, 2, function(x){
  names(which(x == max(x)))
}) %>% data.frame %>%
  dplyr::rename("HTO" = ".") %>%
  rownames_to_column(var = "donor") %>%
  inner_join(info, by = c("HTO" = "Sample")) %>%
  mutate(Batch = factor(Batch)) -> info

info %>% knitr::kable()| donor | HTO | Participant | Sex | Age | Disease | Batch |
|---|---|---|---|---|---|---|
| A | A | B1_CF | M | 2.99 | CF | 1 |
| B | B | C1_CF | M | 2.99 | CF | 1 |
| C | C | A1_Ctrl | M | 3.00 | Ctrl | 1 |
| D | D | D1_CF | M | 3.03 | CF | 1 |
| donor_A | Human_HTO_8 | L2_CF | M | 5.95 | CF | 2 |
| donor_B | Human_HTO_1 | E2_CF | F | 5.99 | CF | 2 |
| donor_C | Human_HTO_4 | H2_CF | F | 5.89 | CF | 2 |
| donor_D | Human_HTO_6 | J2_CF | M | 5.05 | CF | 2 |
| donor_E | Human_HTO_3 | G2_CF | F | 4.91 | CF | 2 |
| donor_F | Human_HTO_5 | I2_CF | F | 5.93 | CF | 2 |
| donor_G | Human_HTO_2 | F2_CF | F | 6.02 | CF | 2 |
| donor_H | Human_HTO_7 | K2_CF | M | 4.92 | CF | 2 |
5.2 Sub-cluster proportions (Broad)
# Differences in cell type proportions
props <- getTransformedProps(clusters = seuInt$Broad,
                             sample = seuInt$donor, transform="asin")
props$Proportions %>% knitr::kable()| A | B | C | D | donor_A | donor_B | donor_C | donor_D | donor_E | donor_F | donor_G | donor_H | |
|---|---|---|---|---|---|---|---|---|---|---|---|---|
| B cells | 0.3785851 | 0.0797744 | 0.2993421 | 0.2271540 | 0.2823276 | 0.4326923 | 0.1617647 | 0.2314050 | 0.1491228 | 0.1348315 | 0.0878049 | 0.0571429 |
| Dendritic | 0.0286807 | 0.1482675 | 0.4062500 | 0.5300261 | 0.3556034 | 0.1987179 | 0.5294118 | 0.4793388 | 0.5263158 | 0.3707865 | 0.6585366 | 0.3071429 |
| Endothelial | 0.1038878 | 0.1240935 | 0.0000000 | 0.0000000 | 0.0000000 | 0.0000000 | 0.0000000 | 0.0000000 | 0.0000000 | 0.0000000 | 0.0000000 | 0.0000000 |
| Epithelial | 0.4582537 | 0.6067687 | 0.0748355 | 0.0156658 | 0.1120690 | 0.2564103 | 0.0588235 | 0.0578512 | 0.0701754 | 0.0000000 | 0.0243902 | 0.4500000 |
| Mast cells | 0.0057361 | 0.0024174 | 0.0049342 | 0.0000000 | 0.0452586 | 0.0192308 | 0.0000000 | 0.0000000 | 0.0000000 | 0.0000000 | 0.0000000 | 0.0071429 |
| Monocytes | 0.0076482 | 0.0241741 | 0.1537829 | 0.1775457 | 0.0603448 | 0.0480769 | 0.1617647 | 0.1735537 | 0.2280702 | 0.4606742 | 0.1707317 | 0.1642857 |
| Neutrophils | 0.0172084 | 0.0145044 | 0.0608553 | 0.0496084 | 0.1443966 | 0.0448718 | 0.0882353 | 0.0578512 | 0.0263158 | 0.0337079 | 0.0585366 | 0.0142857 |
5.2.1 Cell proportions by donor
props$Proportions %>%
  data.frame %>%
  inner_join(info, by = c("sample" = "donor")) %>%
ggplot(aes(x = Participant, y = Freq, fill = clusters)) +
  geom_bar(stat = "identity") +
    theme_classic() +
  theme(axis.text.x = element_text(angle = 90,
                                   vjust = 0.5,
                                   hjust = 1),
        legend.text = element_text(size = 8)) +
  labs(y = "Proportion", fill = "Cell Label") +
  scale_fill_paletteer_d("miscpalettes::pastel")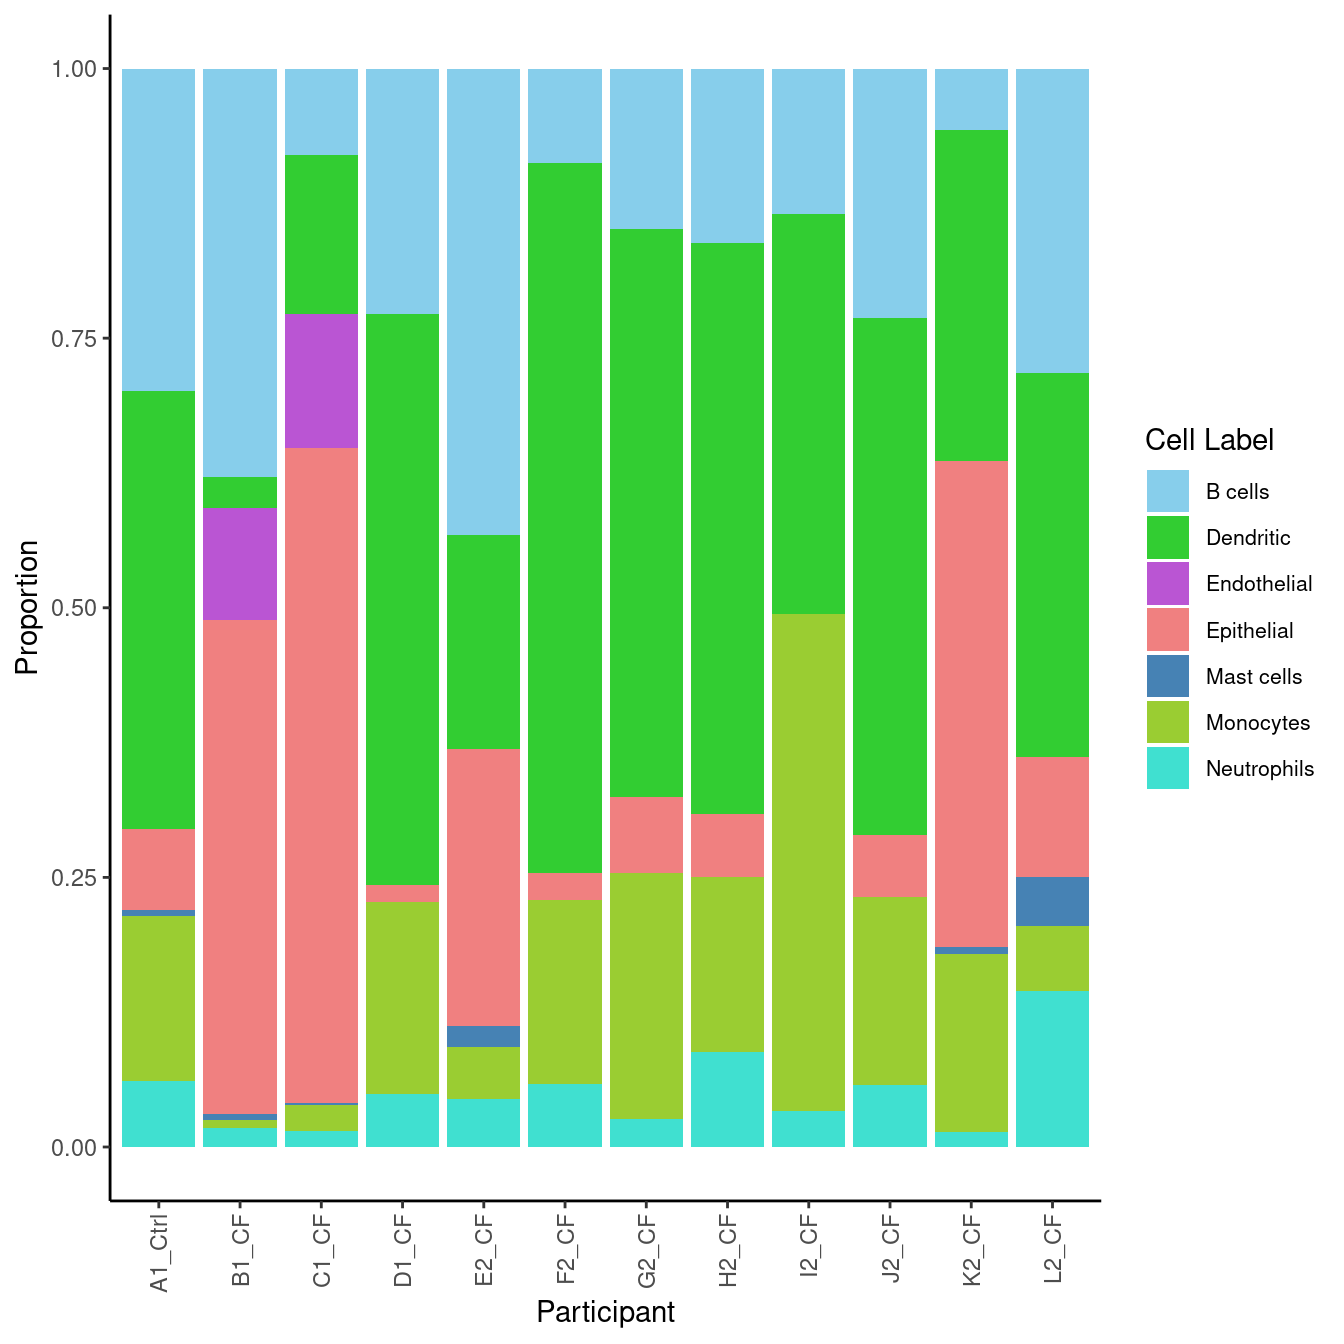
5.3 Sub-cluster proportions (Fine)
# Differences in cell type proportions
props <- getTransformedProps(clusters = seuInt$Annotation,
                             sample = seuInt$donor, transform="asin")
props$Proportions %>% knitr::kable()| A | B | C | D | donor_A | donor_B | donor_C | donor_D | donor_E | donor_F | donor_G | donor_H | |
|---|---|---|---|---|---|---|---|---|---|---|---|---|
| B cells | 0.3473550 | 0.0709106 | 0.2746711 | 0.2219321 | 0.2737069 | 0.4262821 | 0.1617647 | 0.2231405 | 0.1315789 | 0.1235955 | 0.0878049 | 0.0357143 |
| basal cell | 0.3091141 | 0.4190169 | 0.0049342 | 0.0052219 | 0.0129310 | 0.0352564 | 0.0000000 | 0.0000000 | 0.0000000 | 0.0000000 | 0.0097561 | 0.0071429 |
| cDC1 | 0.0012747 | 0.0032232 | 0.0328947 | 0.0626632 | 0.0280172 | 0.0032051 | 0.0147059 | 0.0247934 | 0.0087719 | 0.0112360 | 0.1853659 | 0.0071429 |
| cDC2 | 0.0210325 | 0.1095890 | 0.2828947 | 0.3681462 | 0.2500000 | 0.1698718 | 0.4264706 | 0.3966942 | 0.4035088 | 0.3033708 | 0.2243902 | 0.2571429 |
| ciliated cell | 0.0337795 | 0.0443191 | 0.0460526 | 0.0078329 | 0.0840517 | 0.2051282 | 0.0588235 | 0.0413223 | 0.0701754 | 0.0000000 | 0.0146341 | 0.3500000 |
| dividing B cells | 0.0229446 | 0.0048348 | 0.0139803 | 0.0052219 | 0.0021552 | 0.0032051 | 0.0000000 | 0.0000000 | 0.0087719 | 0.0112360 | 0.0000000 | 0.0000000 |
| endothelial cell | 0.1038878 | 0.1240935 | 0.0000000 | 0.0000000 | 0.0000000 | 0.0000000 | 0.0000000 | 0.0000000 | 0.0000000 | 0.0000000 | 0.0000000 | 0.0000000 |
| goblet/club cell | 0.1102613 | 0.1369863 | 0.0000000 | 0.0000000 | 0.0021552 | 0.0000000 | 0.0000000 | 0.0000000 | 0.0000000 | 0.0000000 | 0.0000000 | 0.0000000 |
| mast cells | 0.0057361 | 0.0024174 | 0.0049342 | 0.0000000 | 0.0452586 | 0.0192308 | 0.0000000 | 0.0000000 | 0.0000000 | 0.0000000 | 0.0000000 | 0.0071429 |
| migratory DC | 0.0012747 | 0.0161160 | 0.0633224 | 0.0731070 | 0.0474138 | 0.0096154 | 0.0588235 | 0.0413223 | 0.0964912 | 0.0337079 | 0.0634146 | 0.0285714 |
| monocytes | 0.0076482 | 0.0241741 | 0.1537829 | 0.1775457 | 0.0603448 | 0.0480769 | 0.1617647 | 0.1735537 | 0.2280702 | 0.4606742 | 0.1707317 | 0.1642857 |
| neutrophil-like | 0.0172084 | 0.0145044 | 0.0608553 | 0.0496084 | 0.1443966 | 0.0448718 | 0.0882353 | 0.0578512 | 0.0263158 | 0.0337079 | 0.0585366 | 0.0142857 |
| plasma B cells | 0.0082855 | 0.0040290 | 0.0106908 | 0.0000000 | 0.0064655 | 0.0032051 | 0.0000000 | 0.0082645 | 0.0087719 | 0.0000000 | 0.0000000 | 0.0214286 |
| plasmacytoid DC | 0.0050988 | 0.0193392 | 0.0271382 | 0.0261097 | 0.0301724 | 0.0160256 | 0.0294118 | 0.0165289 | 0.0175439 | 0.0224719 | 0.1853659 | 0.0142857 |
| tracheobronchial goblet/club cells | 0.0050988 | 0.0064464 | 0.0238487 | 0.0026110 | 0.0129310 | 0.0160256 | 0.0000000 | 0.0165289 | 0.0000000 | 0.0000000 | 0.0000000 | 0.0928571 |
5.3.1 Cell proportions by donor
props$Proportions %>%
  data.frame %>%
  inner_join(info, by = c("sample" = "donor")) %>%
ggplot(aes(x = Participant, y = Freq, fill = clusters)) +
  geom_bar(stat = "identity") +
    theme_classic() +
  theme(axis.text.x = element_text(angle = 90,
                                   vjust = 0.5,
                                   hjust = 1),
        legend.text = element_text(size = 8)) +
  labs(y = "Proportion", fill = "Cell label") +
  scale_fill_paletteer_d("miscpalettes::pastel") -> f4b
6 Save data
out <- here(glue("data/SCEs/06_COMBO.clean_others_diet.SEU.rds"))
if(!file.exists(out)){
  DefaultAssay(seuInt) <- "RNA"
  saveRDS(DietSeurat(seuInt,
                     assays = c("RNA", "ADT.dsb", "ADT.raw"),
                     dimreducs = NULL,
                     graphs = NULL), out)

}
7 Panel figures
layout = "AAAB
          AAAB
          AAAB
          CCCC
          CCCC
          DDDD
          DDDD
          DDDD"
((f4a + ggtitle("")) +
   f4b +
   f4c +
   wrap_heatmap(f4d)) +
  plot_layout(design = layout) +
  plot_annotation(tag_levels = "A") &
  theme(plot.tag = element_text(size = 14, face = "bold"))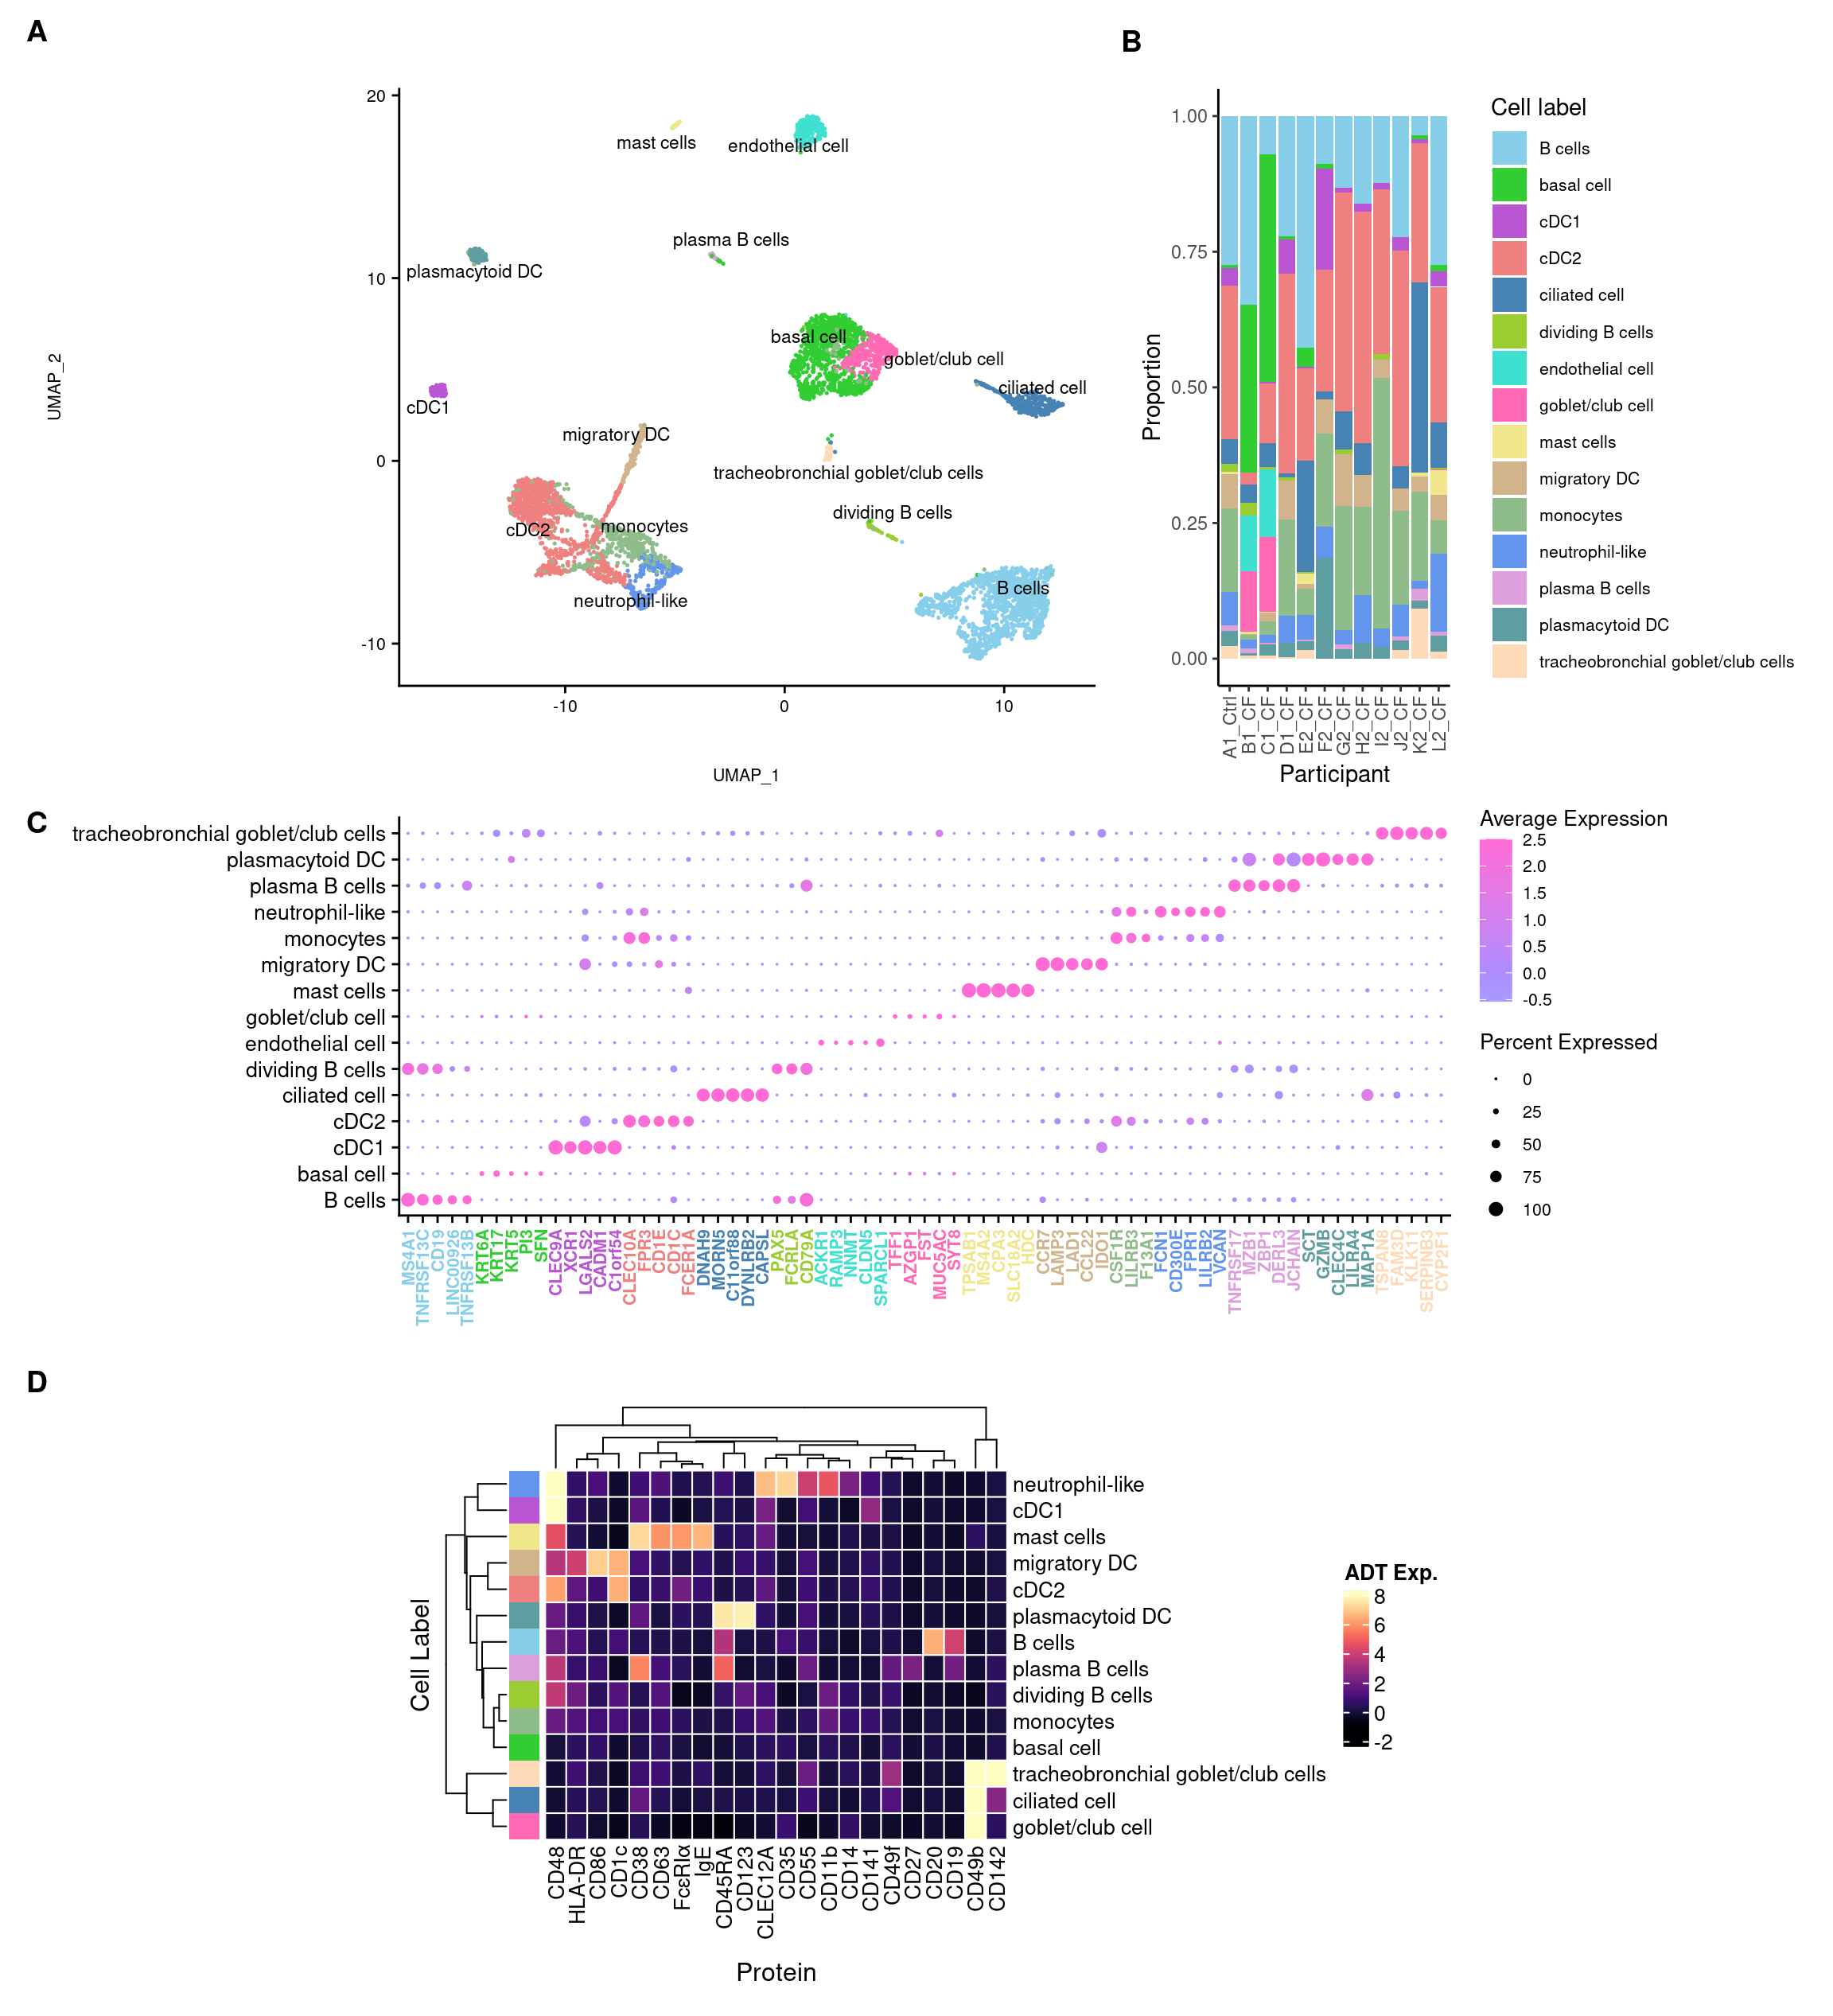
8 Session info
sessioninfo::session_info()─ Session info ───────────────────────────────────────────────────────────────
setting value
version R version 4.1.0 (2021-05-18)
os CentOS Linux 7 (Core)
system x86_64, linux-gnu
ui X11
language (EN)
collate en_AU.UTF-8
ctype en_AU.UTF-8
tz Australia/Melbourne
date 2022-12-20
pandoc 2.17.1.1 @ /usr/lib/rstudio-server/bin/quarto/bin/ (via rmarkdown)
─ Packages ───────────────────────────────────────────────────────────────────
! package * version date (UTC) lib source
P abind 1.4-5 2016-07-21 [?] CRAN (R 4.1.0)
P annotate * 1.72.0 2021-10-26 [?] Bioconductor
P AnnotationDbi * 1.56.2 2021-11-09 [?] Bioconductor
P assertthat 0.2.1 2019-03-21 [?] CRAN (R 4.1.0)
P backports 1.4.1 2021-12-13 [?] CRAN (R 4.1.0)
P beachmat 2.10.0 2021-10-26 [?] Bioconductor
P Biobase * 2.54.0 2021-10-26 [?] Bioconductor
P BiocGenerics * 0.40.0 2021-10-26 [?] Bioconductor
P BiocManager 1.30.16 2021-06-15 [?] CRAN (R 4.1.0)
P BiocParallel 1.28.3 2021-12-09 [?] Bioconductor
P BiocStyle * 2.22.0 2021-10-26 [?] Bioconductor
P Biostrings 2.62.0 2021-10-26 [?] Bioconductor
P bit 4.0.4 2020-08-04 [?] CRAN (R 4.1.0)
P bit64 4.0.5 2020-08-30 [?] CRAN (R 4.0.2)
P bitops 1.0-7 2021-04-24 [?] CRAN (R 4.0.2)
P blob 1.2.2 2021-07-23 [?] CRAN (R 4.1.0)
P bookdown 0.24 2021-09-02 [?] CRAN (R 4.1.0)
P broom 0.7.11 2022-01-03 [?] CRAN (R 4.1.0)
P bslib 0.3.1 2021-10-06 [?] CRAN (R 4.1.0)
P cachem 1.0.6 2021-08-19 [?] CRAN (R 4.1.0)
P callr 3.7.0 2021-04-20 [?] CRAN (R 4.1.0)
P cellranger 1.1.0 2016-07-27 [?] CRAN (R 4.1.0)
P Cepo * 1.0.0 2021-10-26 [?] Bioconductor
P circlize 0.4.13 2021-06-09 [?] CRAN (R 4.1.0)
P cli 3.1.0 2021-10-27 [?] CRAN (R 4.1.0)
P clue 0.3-60 2021-10-11 [?] CRAN (R 4.1.0)
P cluster 2.1.2 2021-04-17 [?] CRAN (R 4.1.0)
P codetools 0.2-18 2020-11-04 [?] CRAN (R 4.1.0)
P colorspace 2.0-2 2021-06-24 [?] CRAN (R 4.0.2)
P ComplexHeatmap 2.10.0 2021-10-26 [?] Bioconductor
P cowplot 1.1.1 2020-12-30 [?] CRAN (R 4.0.2)
P crayon 1.4.2 2021-10-29 [?] CRAN (R 4.1.0)
P data.table 1.14.2 2021-09-27 [?] CRAN (R 4.1.0)
P DBI 1.1.2 2021-12-20 [?] CRAN (R 4.1.0)
P dbplyr 2.1.1 2021-04-06 [?] CRAN (R 4.1.0)
P DelayedArray 0.20.0 2021-10-26 [?] Bioconductor
P DelayedMatrixStats 1.16.0 2021-10-26 [?] Bioconductor
P deldir 1.0-6 2021-10-23 [?] CRAN (R 4.1.0)
P dendextend 1.15.2 2021-10-28 [?] CRAN (R 4.1.0)
P digest 0.6.29 2021-12-01 [?] CRAN (R 4.1.0)
P doParallel 1.0.16 2020-10-16 [?] CRAN (R 4.0.2)
P dplyr * 1.0.7 2021-06-18 [?] CRAN (R 4.1.0)
P edgeR 3.36.0 2021-10-26 [?] Bioconductor
P ellipsis 0.3.2 2021-04-29 [?] CRAN (R 4.0.2)
P evaluate 0.14 2019-05-28 [?] CRAN (R 4.0.2)
P fansi 1.0.0 2022-01-10 [?] CRAN (R 4.1.0)
P farver 2.1.0 2021-02-28 [?] CRAN (R 4.0.2)
P fastmap 1.1.0 2021-01-25 [?] CRAN (R 4.1.0)
P fitdistrplus 1.1-6 2021-09-28 [?] CRAN (R 4.1.0)
P forcats * 0.5.1 2021-01-27 [?] CRAN (R 4.1.0)
P foreach 1.5.1 2020-10-15 [?] CRAN (R 4.0.2)
P fs 1.5.2 2021-12-08 [?] CRAN (R 4.1.0)
P future 1.23.0 2021-10-31 [?] CRAN (R 4.1.0)
P future.apply 1.8.1 2021-08-10 [?] CRAN (R 4.1.0)
P generics 0.1.1 2021-10-25 [?] CRAN (R 4.1.0)
GenomeInfoDb 1.30.1 2022-01-30 [1] Bioconductor
P GenomeInfoDbData 1.2.7 2021-12-21 [?] Bioconductor
P GenomicRanges 1.46.1 2021-11-18 [?] Bioconductor
P GetoptLong 1.0.5 2020-12-15 [?] CRAN (R 4.0.2)
P getPass 0.2-2 2017-07-21 [?] CRAN (R 4.0.2)
P ggplot2 * 3.3.5 2021-06-25 [?] CRAN (R 4.0.2)
P ggrepel 0.9.1 2021-01-15 [?] CRAN (R 4.1.0)
P ggridges 0.5.3 2021-01-08 [?] CRAN (R 4.1.0)
P git2r 0.29.0 2021-11-22 [?] CRAN (R 4.1.0)
P GlobalOptions 0.1.2 2020-06-10 [?] CRAN (R 4.1.0)
P globals 0.14.0 2020-11-22 [?] CRAN (R 4.0.2)
P glue * 1.6.0 2021-12-17 [?] CRAN (R 4.1.0)
P goftest 1.2-3 2021-10-07 [?] CRAN (R 4.1.0)
P graph * 1.72.0 2021-10-26 [?] Bioconductor
P gridExtra 2.3 2017-09-09 [?] CRAN (R 4.1.0)
P GSEABase * 1.56.0 2021-10-26 [?] Bioconductor
P gtable 0.3.0 2019-03-25 [?] CRAN (R 4.1.0)
P haven 2.4.3 2021-08-04 [?] CRAN (R 4.1.0)
P HDF5Array 1.22.1 2021-11-14 [?] Bioconductor
P here * 1.0.1 2020-12-13 [?] CRAN (R 4.0.2)
P highr 0.9 2021-04-16 [?] CRAN (R 4.1.0)
P hms 1.1.1 2021-09-26 [?] CRAN (R 4.1.0)
P htmltools 0.5.2 2021-08-25 [?] CRAN (R 4.1.0)
P htmlwidgets 1.5.4 2021-09-08 [?] CRAN (R 4.1.0)
P httpuv 1.6.5 2022-01-05 [?] CRAN (R 4.1.0)
P httr 1.4.2 2020-07-20 [?] CRAN (R 4.1.0)
P ica 1.0-2 2018-05-24 [?] CRAN (R 4.1.0)
P igraph 1.2.11 2022-01-04 [?] CRAN (R 4.1.0)
P IRanges * 2.28.0 2021-10-26 [?] Bioconductor
P irlba 2.3.5 2021-12-06 [?] CRAN (R 4.1.0)
P iterators 1.0.13 2020-10-15 [?] CRAN (R 4.0.2)
P jquerylib 0.1.4 2021-04-26 [?] CRAN (R 4.1.0)
P jsonlite 1.7.2 2020-12-09 [?] CRAN (R 4.0.2)
P KEGGREST 1.34.0 2021-10-26 [?] Bioconductor
P KernSmooth 2.23-20 2021-05-03 [?] CRAN (R 4.1.0)
P knitr 1.37 2021-12-16 [?] CRAN (R 4.1.0)
P labeling 0.4.2 2020-10-20 [?] CRAN (R 4.0.2)
P later 1.3.0 2021-08-18 [?] CRAN (R 4.1.0)
P lattice 0.20-45 2021-09-22 [?] CRAN (R 4.1.0)
P lazyeval 0.2.2 2019-03-15 [?] CRAN (R 4.1.0)
P leiden 0.3.9 2021-07-27 [?] CRAN (R 4.1.0)
P lifecycle 1.0.1 2021-09-24 [?] CRAN (R 4.1.0)
P limma 3.50.0 2021-10-26 [?] Bioconductor
P listenv 0.8.0 2019-12-05 [?] CRAN (R 4.1.0)
P lmtest 0.9-39 2021-11-07 [?] CRAN (R 4.1.0)
P locfit 1.5-9.4 2020-03-25 [?] CRAN (R 4.1.0)
P lubridate 1.8.0 2021-10-07 [?] CRAN (R 4.1.0)
P magrittr 2.0.1 2020-11-17 [?] CRAN (R 4.0.2)
P MASS 7.3-53.1 2021-02-12 [?] CRAN (R 4.0.2)
P Matrix 1.4-0 2021-12-08 [?] CRAN (R 4.1.0)
P MatrixGenerics 1.6.0 2021-10-26 [?] Bioconductor
P matrixStats 0.61.0 2021-09-17 [?] CRAN (R 4.1.0)
P memoise 2.0.1 2021-11-26 [?] CRAN (R 4.1.0)
P mgcv 1.8-38 2021-10-06 [?] CRAN (R 4.1.0)
P mime 0.12 2021-09-28 [?] CRAN (R 4.1.0)
P miniUI 0.1.1.1 2018-05-18 [?] CRAN (R 4.1.0)
P modelr 0.1.8 2020-05-19 [?] CRAN (R 4.0.2)
P munsell 0.5.0 2018-06-12 [?] CRAN (R 4.1.0)
P nlme 3.1-153 2021-09-07 [?] CRAN (R 4.1.0)
P org.Hs.eg.db 3.14.0 2021-12-21 [?] Bioconductor
P org.Mm.eg.db 3.14.0 2022-01-24 [?] Bioconductor
P paletteer * 1.4.0 2021-07-20 [?] CRAN (R 4.1.0)
P parallelly 1.30.0 2021-12-17 [?] CRAN (R 4.1.0)
P patchwork * 1.1.1 2020-12-17 [?] CRAN (R 4.0.2)
P pbapply 1.5-0 2021-09-16 [?] CRAN (R 4.1.0)
P pillar 1.6.4 2021-10-18 [?] CRAN (R 4.1.0)
P pkgconfig 2.0.3 2019-09-22 [?] CRAN (R 4.1.0)
P plotly 4.10.0 2021-10-09 [?] CRAN (R 4.1.0)
P plyr 1.8.6 2020-03-03 [?] CRAN (R 4.0.2)
P png 0.1-7 2013-12-03 [?] CRAN (R 4.1.0)
P polyclip 1.10-0 2019-03-14 [?] CRAN (R 4.1.0)
P prismatic 1.1.0 2021-10-17 [?] CRAN (R 4.1.0)
P processx 3.5.2 2021-04-30 [?] CRAN (R 4.1.0)
P promises 1.2.0.1 2021-02-11 [?] CRAN (R 4.0.2)
P ps 1.6.0 2021-02-28 [?] CRAN (R 4.1.0)
P purrr * 0.3.4 2020-04-17 [?] CRAN (R 4.0.2)
P R6 2.5.1 2021-08-19 [?] CRAN (R 4.1.0)
P RANN 2.6.1 2019-01-08 [?] CRAN (R 4.1.0)
P RColorBrewer 1.1-2 2014-12-07 [?] CRAN (R 4.0.2)
P Rcpp 1.0.7 2021-07-07 [?] CRAN (R 4.1.0)
P RcppAnnoy 0.0.19 2021-07-30 [?] CRAN (R 4.1.0)
RCurl 1.98-1.6 2022-02-08 [1] CRAN (R 4.1.0)
P readr * 2.1.1 2021-11-30 [?] CRAN (R 4.1.0)
P readxl 1.3.1 2019-03-13 [?] CRAN (R 4.1.0)
P rematch2 2.1.2 2020-05-01 [?] CRAN (R 4.1.0)
P renv 0.15.0-14 2022-01-10 [?] Github (rstudio/renv@a3b90eb)
P reprex 2.0.1 2021-08-05 [?] CRAN (R 4.1.0)
P reshape2 1.4.4 2020-04-09 [?] CRAN (R 4.1.0)
P reticulate 1.22 2021-09-17 [?] CRAN (R 4.1.0)
P rhdf5 2.38.0 2021-10-26 [?] Bioconductor
P rhdf5filters 1.6.0 2021-10-26 [?] Bioconductor
P Rhdf5lib 1.16.0 2021-10-26 [?] Bioconductor
P rjson 0.2.21 2022-01-09 [?] CRAN (R 4.1.0)
P rlang 0.4.12 2021-10-18 [?] CRAN (R 4.1.0)
P rmarkdown 2.11 2021-09-14 [?] CRAN (R 4.1.0)
P ROCR 1.0-11 2020-05-02 [?] CRAN (R 4.1.0)
P rpart 4.1-15 2019-04-12 [?] CRAN (R 4.1.0)
P rprojroot 2.0.2 2020-11-15 [?] CRAN (R 4.0.2)
P RSpectra 0.16-0 2019-12-01 [?] CRAN (R 4.1.0)
P RSQLite 2.2.9 2021-12-06 [?] CRAN (R 4.1.0)
P rstudioapi 0.13 2020-11-12 [?] CRAN (R 4.0.2)
P Rtsne 0.15 2018-11-10 [?] CRAN (R 4.1.0)
P rvest 1.0.2 2021-10-16 [?] CRAN (R 4.1.0)
P S4Vectors * 0.32.3 2021-11-21 [?] Bioconductor
P sass 0.4.0 2021-05-12 [?] CRAN (R 4.1.0)
P scales 1.1.1 2020-05-11 [?] CRAN (R 4.0.2)
P scattermore 0.7 2020-11-24 [?] CRAN (R 4.1.0)
P sctransform 0.3.3 2022-01-13 [?] CRAN (R 4.1.0)
P scuttle 1.4.0 2021-10-26 [?] Bioconductor
P sessioninfo 1.2.2 2021-12-06 [?] CRAN (R 4.1.0)
P Seurat * 4.0.6 2021-12-16 [?] CRAN (R 4.1.0)
P SeuratObject * 4.0.4 2021-11-23 [?] CRAN (R 4.1.0)
P shape 1.4.6 2021-05-19 [?] CRAN (R 4.1.0)
P shiny 1.7.1 2021-10-02 [?] CRAN (R 4.1.0)
P SingleCellExperiment 1.16.0 2021-10-26 [?] Bioconductor
P sparseMatrixStats 1.6.0 2021-10-26 [?] Bioconductor
P spatstat.core 2.3-2 2021-11-26 [?] CRAN (R 4.1.0)
P spatstat.data 2.1-2 2021-12-17 [?] CRAN (R 4.1.0)
P spatstat.geom 2.3-1 2021-12-10 [?] CRAN (R 4.1.0)
P spatstat.sparse 2.1-0 2021-12-17 [?] CRAN (R 4.1.0)
P spatstat.utils 2.3-0 2021-12-12 [?] CRAN (R 4.1.0)
P speckle * 0.0.3 2022-03-09 [?] Github (Oshlack/speckle@fc07773)
P stringi 1.7.6 2021-11-29 [?] CRAN (R 4.1.0)
P stringr * 1.4.0 2019-02-10 [?] CRAN (R 4.0.2)
P SummarizedExperiment 1.24.0 2021-10-26 [?] Bioconductor
P survival 3.2-13 2021-08-24 [?] CRAN (R 4.1.0)
P tensor 1.5 2012-05-05 [?] CRAN (R 4.1.0)
P tibble * 3.1.6 2021-11-07 [?] CRAN (R 4.1.0)
P tidyHeatmap * 1.7.0 2022-05-13 [?] Github (stemangiola/tidyHeatmap@241aec2)
P tidyr * 1.1.4 2021-09-27 [?] CRAN (R 4.1.0)
P tidyselect 1.1.1 2021-04-30 [?] CRAN (R 4.1.0)
P tidyverse * 1.3.1 2021-04-15 [?] CRAN (R 4.1.0)
P tzdb 0.2.0 2021-10-27 [?] CRAN (R 4.1.0)
P utf8 1.2.2 2021-07-24 [?] CRAN (R 4.1.0)
P uwot 0.1.11 2021-12-02 [?] CRAN (R 4.1.0)
P vctrs 0.3.8 2021-04-29 [?] CRAN (R 4.0.2)
P viridis 0.6.2 2021-10-13 [?] CRAN (R 4.1.0)
P viridisLite 0.4.0 2021-04-13 [?] CRAN (R 4.0.2)
P vroom 1.5.7 2021-11-30 [?] CRAN (R 4.1.0)
P whisker 0.4 2019-08-28 [?] CRAN (R 4.0.2)
P withr 2.4.3 2021-11-30 [?] CRAN (R 4.1.0)
P workflowr * 1.7.0 2021-12-21 [?] CRAN (R 4.1.0)
P xfun 0.29 2021-12-14 [?] CRAN (R 4.1.0)
P XML * 3.99-0.8 2021-09-17 [?] CRAN (R 4.1.0)
P xml2 1.3.3 2021-11-30 [?] CRAN (R 4.1.0)
P xtable 1.8-4 2019-04-21 [?] CRAN (R 4.1.0)
P XVector 0.34.0 2021-10-26 [?] Bioconductor
P yaml 2.2.1 2020-02-01 [?] CRAN (R 4.0.2)
P zlibbioc 1.40.0 2021-10-26 [?] Bioconductor
P zoo 1.8-9 2021-03-09 [?] CRAN (R 4.1.0)
[1] /oshlack_lab/jovana.maksimovic/projects/MCRI/melanie.neeland/paed-cf-cite-seq/renv/library/R-4.1/x86_64-pc-linux-gnu
[2] /config/binaries/R/4.1.0/lib64/R/library
P ── Loaded and on-disk path mismatch.
──────────────────────────────────────────────────────────────────────────────
sessionInfo()R version 4.1.0 (2021-05-18)
Platform: x86_64-pc-linux-gnu (64-bit)
Running under: CentOS Linux 7 (Core)
Matrix products: default
BLAS: /config/binaries/R/4.1.0/lib64/R/lib/libRblas.so
LAPACK: /config/binaries/R/4.1.0/lib64/R/lib/libRlapack.so
locale:
[1] LC_CTYPE=en_AU.UTF-8 LC_NUMERIC=C
[3] LC_TIME=en_AU.UTF-8 LC_COLLATE=en_AU.UTF-8
[5] LC_MONETARY=en_AU.UTF-8 LC_MESSAGES=en_AU.UTF-8
[7] LC_PAPER=en_AU.UTF-8 LC_NAME=C
[9] LC_ADDRESS=C LC_TELEPHONE=C
[11] LC_MEASUREMENT=en_AU.UTF-8 LC_IDENTIFICATION=C
attached base packages:
[1] stats4 stats graphics grDevices datasets utils methods
[8] base
other attached packages:
[1] Cepo_1.0.0 GSEABase_1.56.0 graph_1.72.0
[4] annotate_1.72.0 XML_3.99-0.8 AnnotationDbi_1.56.2
[7] IRanges_2.28.0 S4Vectors_0.32.3 Biobase_2.54.0
[10] BiocGenerics_0.40.0 speckle_0.0.3 tidyHeatmap_1.7.0
[13] paletteer_1.4.0 patchwork_1.1.1 SeuratObject_4.0.4
[16] Seurat_4.0.6 glue_1.6.0 here_1.0.1
[19] forcats_0.5.1 stringr_1.4.0 dplyr_1.0.7
[22] purrr_0.3.4 readr_2.1.1 tidyr_1.1.4
[25] tibble_3.1.6 ggplot2_3.3.5 tidyverse_1.3.1
[28] BiocStyle_2.22.0 workflowr_1.7.0
loaded via a namespace (and not attached):
[1] scattermore_0.7 bit64_4.0.5
[3] knitr_1.37 irlba_2.3.5
[5] DelayedArray_0.20.0 data.table_1.14.2
[7] rpart_4.1-15 KEGGREST_1.34.0
[9] RCurl_1.98-1.6 doParallel_1.0.16
[11] generics_0.1.1 org.Mm.eg.db_3.14.0
[13] callr_3.7.0 cowplot_1.1.1
[15] RSQLite_2.2.9 RANN_2.6.1
[17] future_1.23.0 bit_4.0.4
[19] tzdb_0.2.0 spatstat.data_2.1-2
[21] xml2_1.3.3 lubridate_1.8.0
[23] httpuv_1.6.5 SummarizedExperiment_1.24.0
[25] assertthat_0.2.1 viridis_0.6.2
[27] xfun_0.29 hms_1.1.1
[29] jquerylib_0.1.4 evaluate_0.14
[31] promises_1.2.0.1 fansi_1.0.0
[33] dendextend_1.15.2 dbplyr_2.1.1
[35] readxl_1.3.1 igraph_1.2.11
[37] DBI_1.1.2 htmlwidgets_1.5.4
[39] spatstat.geom_2.3-1 ellipsis_0.3.2
[41] RSpectra_0.16-0 backports_1.4.1
[43] bookdown_0.24 prismatic_1.1.0
[45] deldir_1.0-6 sparseMatrixStats_1.6.0
[47] MatrixGenerics_1.6.0 vctrs_0.3.8
[49] SingleCellExperiment_1.16.0 ROCR_1.0-11
[51] abind_1.4-5 cachem_1.0.6
[53] withr_2.4.3 vroom_1.5.7
[55] sctransform_0.3.3 goftest_1.2-3
[57] cluster_2.1.2 lazyeval_0.2.2
[59] crayon_1.4.2 labeling_0.4.2
[61] edgeR_3.36.0 pkgconfig_2.0.3
[63] GenomeInfoDb_1.30.1 nlme_3.1-153
[65] rlang_0.4.12 globals_0.14.0
[67] lifecycle_1.0.1 miniUI_0.1.1.1
[69] modelr_0.1.8 cellranger_1.1.0
[71] rprojroot_2.0.2 polyclip_1.10-0
[73] matrixStats_0.61.0 lmtest_0.9-39
[75] Matrix_1.4-0 Rhdf5lib_1.16.0
[77] zoo_1.8-9 reprex_2.0.1
[79] whisker_0.4 ggridges_0.5.3
[81] GlobalOptions_0.1.2 processx_3.5.2
[83] png_0.1-7 viridisLite_0.4.0
[85] rjson_0.2.21 bitops_1.0-7
[87] getPass_0.2-2 KernSmooth_2.23-20
[89] rhdf5filters_1.6.0 Biostrings_2.62.0
[91] blob_1.2.2 DelayedMatrixStats_1.16.0
[93] shape_1.4.6 parallelly_1.30.0
[95] beachmat_2.10.0 scales_1.1.1
[97] memoise_2.0.1 magrittr_2.0.1
[99] plyr_1.8.6 ica_1.0-2
[101] zlibbioc_1.40.0 compiler_4.1.0
[103] RColorBrewer_1.1-2 clue_0.3-60
[105] fitdistrplus_1.1-6 cli_3.1.0
[107] XVector_0.34.0 listenv_0.8.0
[109] pbapply_1.5-0 ps_1.6.0
[111] MASS_7.3-53.1 mgcv_1.8-38
[113] tidyselect_1.1.1 stringi_1.7.6
[115] highr_0.9 yaml_2.2.1
[117] locfit_1.5-9.4 ggrepel_0.9.1
[119] grid_4.1.0 sass_0.4.0
[121] tools_4.1.0 future.apply_1.8.1
[123] parallel_4.1.0 circlize_0.4.13
[125] rstudioapi_0.13 foreach_1.5.1
[127] git2r_0.29.0 gridExtra_2.3
[129] farver_2.1.0 Rtsne_0.15
[131] digest_0.6.29 BiocManager_1.30.16
[133] shiny_1.7.1 Rcpp_1.0.7
[135] GenomicRanges_1.46.1 broom_0.7.11
[137] scuttle_1.4.0 later_1.3.0
[139] RcppAnnoy_0.0.19 org.Hs.eg.db_3.14.0
[141] httr_1.4.2 ComplexHeatmap_2.10.0
[143] colorspace_2.0-2 rvest_1.0.2
[145] fs_1.5.2 tensor_1.5
[147] reticulate_1.22 splines_4.1.0
[149] uwot_0.1.11 rematch2_2.1.2
[151] spatstat.utils_2.3-0 renv_0.15.0-14
[153] sessioninfo_1.2.2 plotly_4.10.0
[155] xtable_1.8-4 jsonlite_1.7.2
[157] R6_2.5.1 pillar_1.6.4
[159] htmltools_0.5.2 mime_0.12
[161] fastmap_1.1.0 BiocParallel_1.28.3
[163] codetools_0.2-18 utf8_1.2.2
[165] lattice_0.20-45 bslib_0.3.1
[167] spatstat.sparse_2.1-0 leiden_0.3.9
[169] survival_3.2-13 limma_3.50.0
[171] rmarkdown_2.11 munsell_0.5.0
[173] GetoptLong_1.0.5 rhdf5_2.38.0
[175] GenomeInfoDbData_1.2.7 iterators_1.0.13
[177] HDF5Array_1.22.1 haven_2.4.3
[179] reshape2_1.4.4 gtable_0.3.0
[181] spatstat.core_2.3-2