Analysis of scRNA-seq & CITE-seq Data Combined
Cell Type Proportions Analysis
Jovana Maksimovic
December 20, 2022
Last updated: 2022-12-20
Checks: 7 0
Knit directory:
paed-cf-cite-seq/
This reproducible R Markdown analysis was created with workflowr (version 1.7.0). The Checks tab describes the reproducibility checks that were applied when the results were created. The Past versions tab lists the development history.
Great! Since the R Markdown file has been committed to the Git repository, you know the exact version of the code that produced these results.
Great job! The global environment was empty. Objects defined in the global environment can affect the analysis in your R Markdown file in unknown ways. For reproduciblity it’s best to always run the code in an empty environment.
The command set.seed(20210524) was run prior to running the code in the R Markdown file.
Setting a seed ensures that any results that rely on randomness, e.g.
subsampling or permutations, are reproducible.
Great job! Recording the operating system, R version, and package versions is critical for reproducibility.
Nice! There were no cached chunks for this analysis, so you can be confident that you successfully produced the results during this run.
Great job! Using relative paths to the files within your workflowr project makes it easier to run your code on other machines.
Great! You are using Git for version control. Tracking code development and connecting the code version to the results is critical for reproducibility.
The results in this page were generated with repository version 508dee7. See the Past versions tab to see a history of the changes made to the R Markdown and HTML files.
Note that you need to be careful to ensure that all relevant files for the
analysis have been committed to Git prior to generating the results (you can
use wflow_publish or wflow_git_commit). workflowr only
checks the R Markdown file, but you know if there are other scripts or data
files that it depends on. Below is the status of the Git repository when the
results were generated:
Ignored files:
    Ignored:    .Rhistory
    Ignored:    .Rproj.user/
    Ignored:    analysis/obsolete/
    Ignored:    code/obsolete/
    Ignored:    data/190930_A00152_0150_BHTYCMDSXX/
    Ignored:    data/CellRanger/
    Ignored:    data/GSE127465_RAW/
    Ignored:    data/Homo_sapiens.gene_info
    Ignored:    data/SCEs/02_ZILIONIS.sct_normalised.SEU.rds
    Ignored:    data/SCEs/03_C133_Neeland.demultiplexed.SCE.rds
    Ignored:    data/SCEs/03_C133_Neeland.emptyDrops.SCE.rds
    Ignored:    data/SCEs/03_C133_Neeland.preprocessed.SCE.rds
    Ignored:    data/SCEs/03_CF_BAL_Pilot.CellRanger_v6.SCE.rds
    Ignored:    data/SCEs/03_CF_BAL_Pilot.emptyDrops.SCE.rds
    Ignored:    data/SCEs/03_CF_BAL_Pilot.preprocessed.SCE.rds
    Ignored:    data/SCEs/03_COMBO.clustered.SEU.rds
    Ignored:    data/SCEs/03_COMBO.clustered_annotated_macrophages_diet.SEU.rds
    Ignored:    data/SCEs/03_COMBO.clustered_annotated_others_diet.SEU.rds
    Ignored:    data/SCEs/03_COMBO.clustered_annotated_tcells_diet.SEU.rds
    Ignored:    data/SCEs/03_COMBO.clustered_diet.SEU.rds
    Ignored:    data/SCEs/03_COMBO.integrated.SEU.rds
    Ignored:    data/SCEs/03_COMBO.zilionis_mapped.SEU.rds
    Ignored:    data/SCEs/04_C133_Neeland.adt_dsb_normalised.rds
    Ignored:    data/SCEs/04_C133_Neeland.adt_integrated.rds
    Ignored:    data/SCEs/04_C133_Neeland.all_integrated.SEU.rds
    Ignored:    data/SCEs/04_CF_BAL_Pilot.CellRanger_v6.SCE.rds
    Ignored:    data/SCEs/04_CF_BAL_Pilot.emptyDrops.SCE.rds
    Ignored:    data/SCEs/04_CF_BAL_Pilot.preprocessed.SCE.rds
    Ignored:    data/SCEs/04_CF_BAL_Pilot.transfer_adt.SEU.rds
    Ignored:    data/SCEs/04_COMBO.clean_clustered.SEU.rds
    Ignored:    data/SCEs/04_COMBO.clean_clustered.SEU_bk.rds
    Ignored:    data/SCEs/04_COMBO.clean_integrated.SEU.rds
    Ignored:    data/SCEs/04_COMBO.clean_integrated.SEU_bk.rds
    Ignored:    data/SCEs/04_COMBO.clean_macrophages_diet.SEU.rds
    Ignored:    data/SCEs/04_COMBO.clean_others_diet.SEU.rds
    Ignored:    data/SCEs/04_COMBO.clean_tcells_diet.SEU.rds
    Ignored:    data/SCEs/04_COMBO.clustered.SEU.rds
    Ignored:    data/SCEs/04_COMBO.clustered_annotated_adt_diet.SEU.rds
    Ignored:    data/SCEs/04_COMBO.clustered_annotated_lung_diet.SEU.rds
    Ignored:    data/SCEs/04_COMBO.clustered_annotated_macrophages_diet.SEU.rds
    Ignored:    data/SCEs/04_COMBO.clustered_annotated_others_diet.SEU.rds
    Ignored:    data/SCEs/04_COMBO.clustered_annotated_tcells_diet.SEU.rds
    Ignored:    data/SCEs/04_COMBO.clustered_diet.SEU.rds
    Ignored:    data/SCEs/04_COMBO.integrated.SEU.rds
    Ignored:    data/SCEs/04_COMBO.macrophages_clustered.SEU.rds
    Ignored:    data/SCEs/04_COMBO.macrophages_integrated.SEU.rds
    Ignored:    data/SCEs/04_COMBO.others_clustered.SEU.rds
    Ignored:    data/SCEs/04_COMBO.others_integrated.SEU.rds
    Ignored:    data/SCEs/04_COMBO.tcells_clustered.SEU.rds
    Ignored:    data/SCEs/04_COMBO.tcells_integrated.SEU.rds
    Ignored:    data/SCEs/04_COMBO.zilionis_mapped.SEU.rds
    Ignored:    data/SCEs/05_CF_BAL_Pilot.transfer_adt.SEU.rds
    Ignored:    data/SCEs/05_COMBO.clean_clustered.SEU.rds
    Ignored:    data/SCEs/05_COMBO.clean_integrated.SEU.rds
    Ignored:    data/SCEs/05_COMBO.clean_macrophages_diet.SEU.rds
    Ignored:    data/SCEs/05_COMBO.clean_others_diet.SEU.rds
    Ignored:    data/SCEs/05_COMBO.clean_tcells_diet.SEU.rds
    Ignored:    data/SCEs/05_COMBO.clustered_annotated_adt_diet.SEU.rds
    Ignored:    data/SCEs/05_COMBO.clustered_annotated_lung_diet.SEU.rds
    Ignored:    data/SCEs/05_COMBO.clustered_annotated_macrophages_diet.SEU.rds
    Ignored:    data/SCEs/05_COMBO.clustered_annotated_others_diet.SEU.rds
    Ignored:    data/SCEs/05_COMBO.clustered_annotated_tcells_diet.SEU.rds
    Ignored:    data/SCEs/05_COMBO.macrophages_clustered.SEU.rds
    Ignored:    data/SCEs/05_COMBO.macrophages_integrated.SEU.rds
    Ignored:    data/SCEs/05_COMBO.others_clustered.SEU.rds
    Ignored:    data/SCEs/05_COMBO.others_integrated.SEU.rds
    Ignored:    data/SCEs/05_COMBO.tcells_clustered.SEU.rds
    Ignored:    data/SCEs/05_COMBO.tcells_integrated.SEU.rds
    Ignored:    data/SCEs/06_COMBO.clean_clustered.DIET.rds
    Ignored:    data/SCEs/06_COMBO.clean_clustered.SEU.rds
    Ignored:    data/SCEs/06_COMBO.clean_integrated.SEU.rds
    Ignored:    data/SCEs/06_COMBO.clean_macrophages_diet.SEU.rds
    Ignored:    data/SCEs/06_COMBO.clean_others_diet.SEU.rds
    Ignored:    data/SCEs/06_COMBO.clean_tcells_diet.SEU.rds
    Ignored:    data/SCEs/06_COMBO.macrophages_clustered.SEU.rds
    Ignored:    data/SCEs/06_COMBO.macrophages_clustered_dbl.SEU.rds
    Ignored:    data/SCEs/06_COMBO.macrophages_integrated.SEU.rds
    Ignored:    data/SCEs/06_COMBO.macrophages_integrated_dbl.SEU.rds
    Ignored:    data/SCEs/06_COMBO.others_clustered.SEU.rds
    Ignored:    data/SCEs/06_COMBO.others_integrated.SEU.rds
    Ignored:    data/SCEs/06_COMBO.tcells_clustered.SEU.rds
    Ignored:    data/SCEs/06_COMBO.tcells_integrated.SEU.rds
    Ignored:    data/SCEs/07_COMBO.clean_integrated.SEU.rds
    Ignored:    data/SCEs/07_COMBO.clean_macrophages_diet.SEU.rds
    Ignored:    data/SCEs/07_COMBO.macrophages_clustered.SEU.rds
    Ignored:    data/SCEs/07_COMBO.macrophages_integrated.SEU.rds
    Ignored:    data/SCEs/C133_Neeland.CellRanger.SCE.rds
    Ignored:    data/SCEs/experiment1_doublets.rds
    Ignored:    data/SCEs/experiment2_doublets.rds
    Ignored:    data/SCEs/obsolete/
    Ignored:    data/cellsnp-lite/
    Ignored:    data/emptyDrops/obsolete/
    Ignored:    data/obsolete/
    Ignored:    data/sample_sheets/obsolete/
    Ignored:    output/marker-analysis/obsolete/
    Ignored:    output/obsolete/
    Ignored:    rename_captures.R
    Ignored:    renv/library/
    Ignored:    renv/staging/
    Ignored:    wflow_background.R

Unstaged changes:
    Modified:   data/macrophage_subcluster_annotation_16.12.22.csv
Note that any generated files, e.g. HTML, png, CSS, etc., are not included in this status report because it is ok for generated content to have uncommitted changes.
These are the previous versions of the repository in which changes were made
to the R Markdown (analysis/14_COMBO.postprocess_all.Rmd) and HTML (docs/14_COMBO.postprocess_all.html)
files. If you’ve configured a remote Git repository (see
?wflow_git_remote), click on the hyperlinks in the table below to
view the files as they were in that past version.
| File | Version | Author | Date | Message |
|---|---|---|---|---|
| html | 2983a22 | Jovana Maksimovic | 2022-12-19 | Build site. |
| Rmd | 99078c4 | Jovana Maksimovic | 2022-12-19 | wflow_publish(c("analysis/11_COMBO.postprocess_macrophages.Rmd", |
| html | 16ace9e | Jovana Maksimovic | 2022-12-19 | Build site. |
| html | 63f8ee8 | Jovana Maksimovic | 2022-12-15 | Build site. |
| Rmd | 916bafa | Jovana Maksimovic | 2022-12-15 | wflow_publish(c("analysis/.emptyDrops.Rmd", "analysis/postprocess_*.Rmd", |
| Rmd | f3b7b92 | Jovana Maksimovic | 2022-06-16 | Submission version |
| html | f3b7b92 | Jovana Maksimovic | 2022-06-16 | Submission version |
1 Load libraries
suppressPackageStartupMessages(library(BiocStyle))
suppressPackageStartupMessages(library(tidyverse))
suppressPackageStartupMessages(library(here))
suppressPackageStartupMessages(library(glue))
suppressPackageStartupMessages(library(Seurat))
suppressPackageStartupMessages(library(patchwork))
suppressPackageStartupMessages(library(paletteer))
suppressPackageStartupMessages(library(tidyHeatmap))
suppressPackageStartupMessages(library(speckle))
suppressPackageStartupMessages(library(Cepo))
suppressPackageStartupMessages(library(glmGamPoi))
suppressPackageStartupMessages(library(BiocParallel))
suppressPackageStartupMessages(library(limma))
source(here("code/utility.R"))
source(here("code/helper_functions.R"))

set.seed(42)
options(scipen=999)
options(future.globals.maxSize = 6500 * 1024^2)
2 Analyse cell proportions
2.1 Load Data
seu1 <- readRDS(here("data/SCEs/07_COMBO.clean_macrophages_diet.SEU.rds"))
seu2 <- readRDS(here("data/SCEs/06_COMBO.clean_tcells_diet.SEU.rds"))
seu3 <- readRDS(here("data/SCEs/06_COMBO.clean_others_diet.SEU.rds"))
seu <- merge(seu1, y = c(seu2, seu3))
seu
An object of class Seurat
16323 features across 42658 samples within 3 assays
Active assay: RNA (16001 features, 0 variable features)
2 other assays present: ADT.dsb, ADT.raw used (Mb) gc trigger (Mb) max used (Mb)
Ncells 9516871 508.3 14700345 785.1 11543062 616.5
Vcells 458772414 3500.2 1520190279 11598.2 1162014597 8865.52.2 Visualise combined, filtered data
DefaultAssay(seu) <- "RNA"
seu <- NormalizeData(seu) %>%
  FindVariableFeatures() %>%
  ScaleData() %>%
  RunPCA(verbose = FALSE, dims = 1:30) %>%
  RunUMAP(verbose = FALSE, dims = 1:30)
DimPlot(seu, group.by = "experiment", combine = FALSE)[[1]]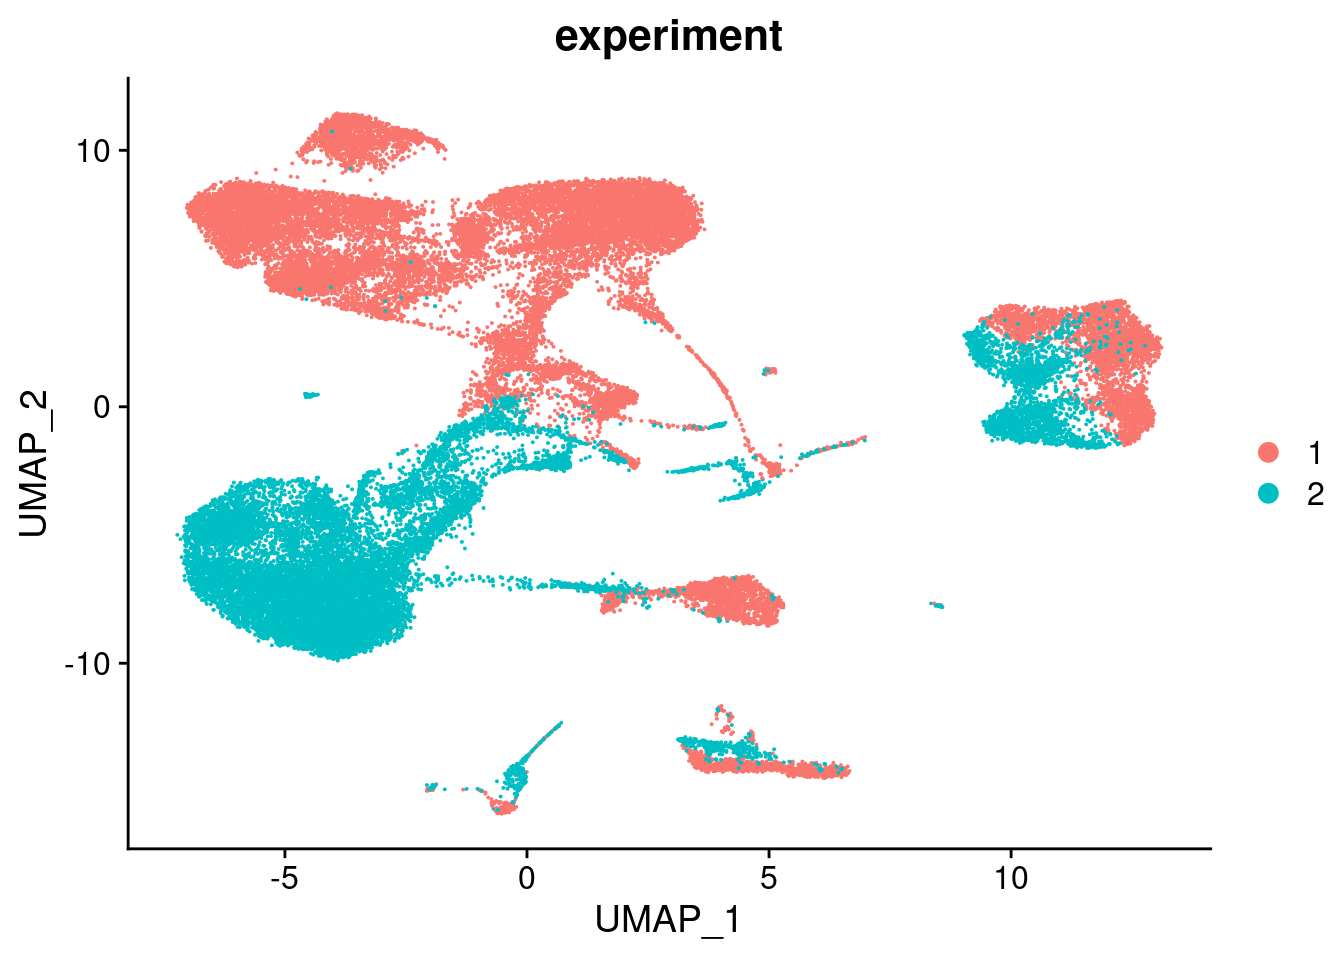
3 Integrate data
Normalise the data using SCTransform and integrate across batches/individuals.
out <- here("data/SCEs/07_COMBO.clean_integrated.SEU.rds")

if(!file.exists(out)) {
  seuInt <- intDat(seu, split = "donor", type = "RNA",
                   reference = unique(as.character(seu$capture[seu$experiment == 1])))
  saveRDS(seuInt, file = out)

} else {
  seuInt <- readRDS(out)

}
used (Mb) gc trigger (Mb) max used (Mb)
Ncells 9656686 515.8 14700345 785.1 14700345 785.1
Vcells 1882914276 14365.5 2702067922 20615.2 1882968820 14366.03.1 Visualise integrated data
seuInt <- RunPCA(seuInt, npcs = 30, verbose = FALSE)
seuInt <- RunUMAP(seuInt, verbose = FALSE, dims = 1:30)
DimPlot(seuInt, group.by = "experiment", combine = FALSE)
[[1]]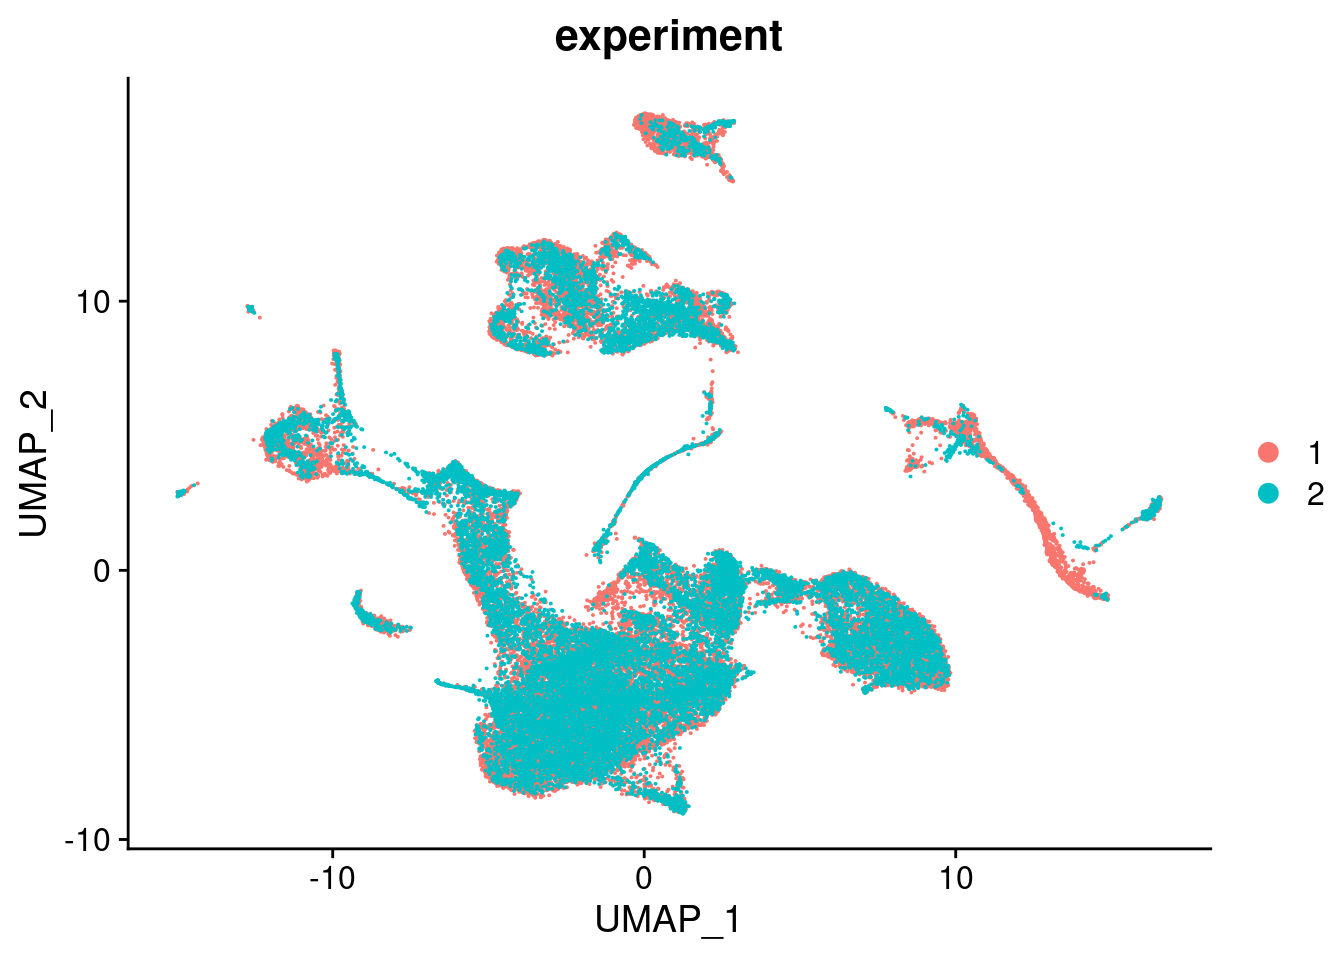
3.2 Visualise labels
options(ggrepel.max.overlaps = Inf)
DimPlot(seuInt, reduction = 'umap', label = TRUE, repel = TRUE,
        label.size = 2.5, group.by = "Annotation") + NoLegend()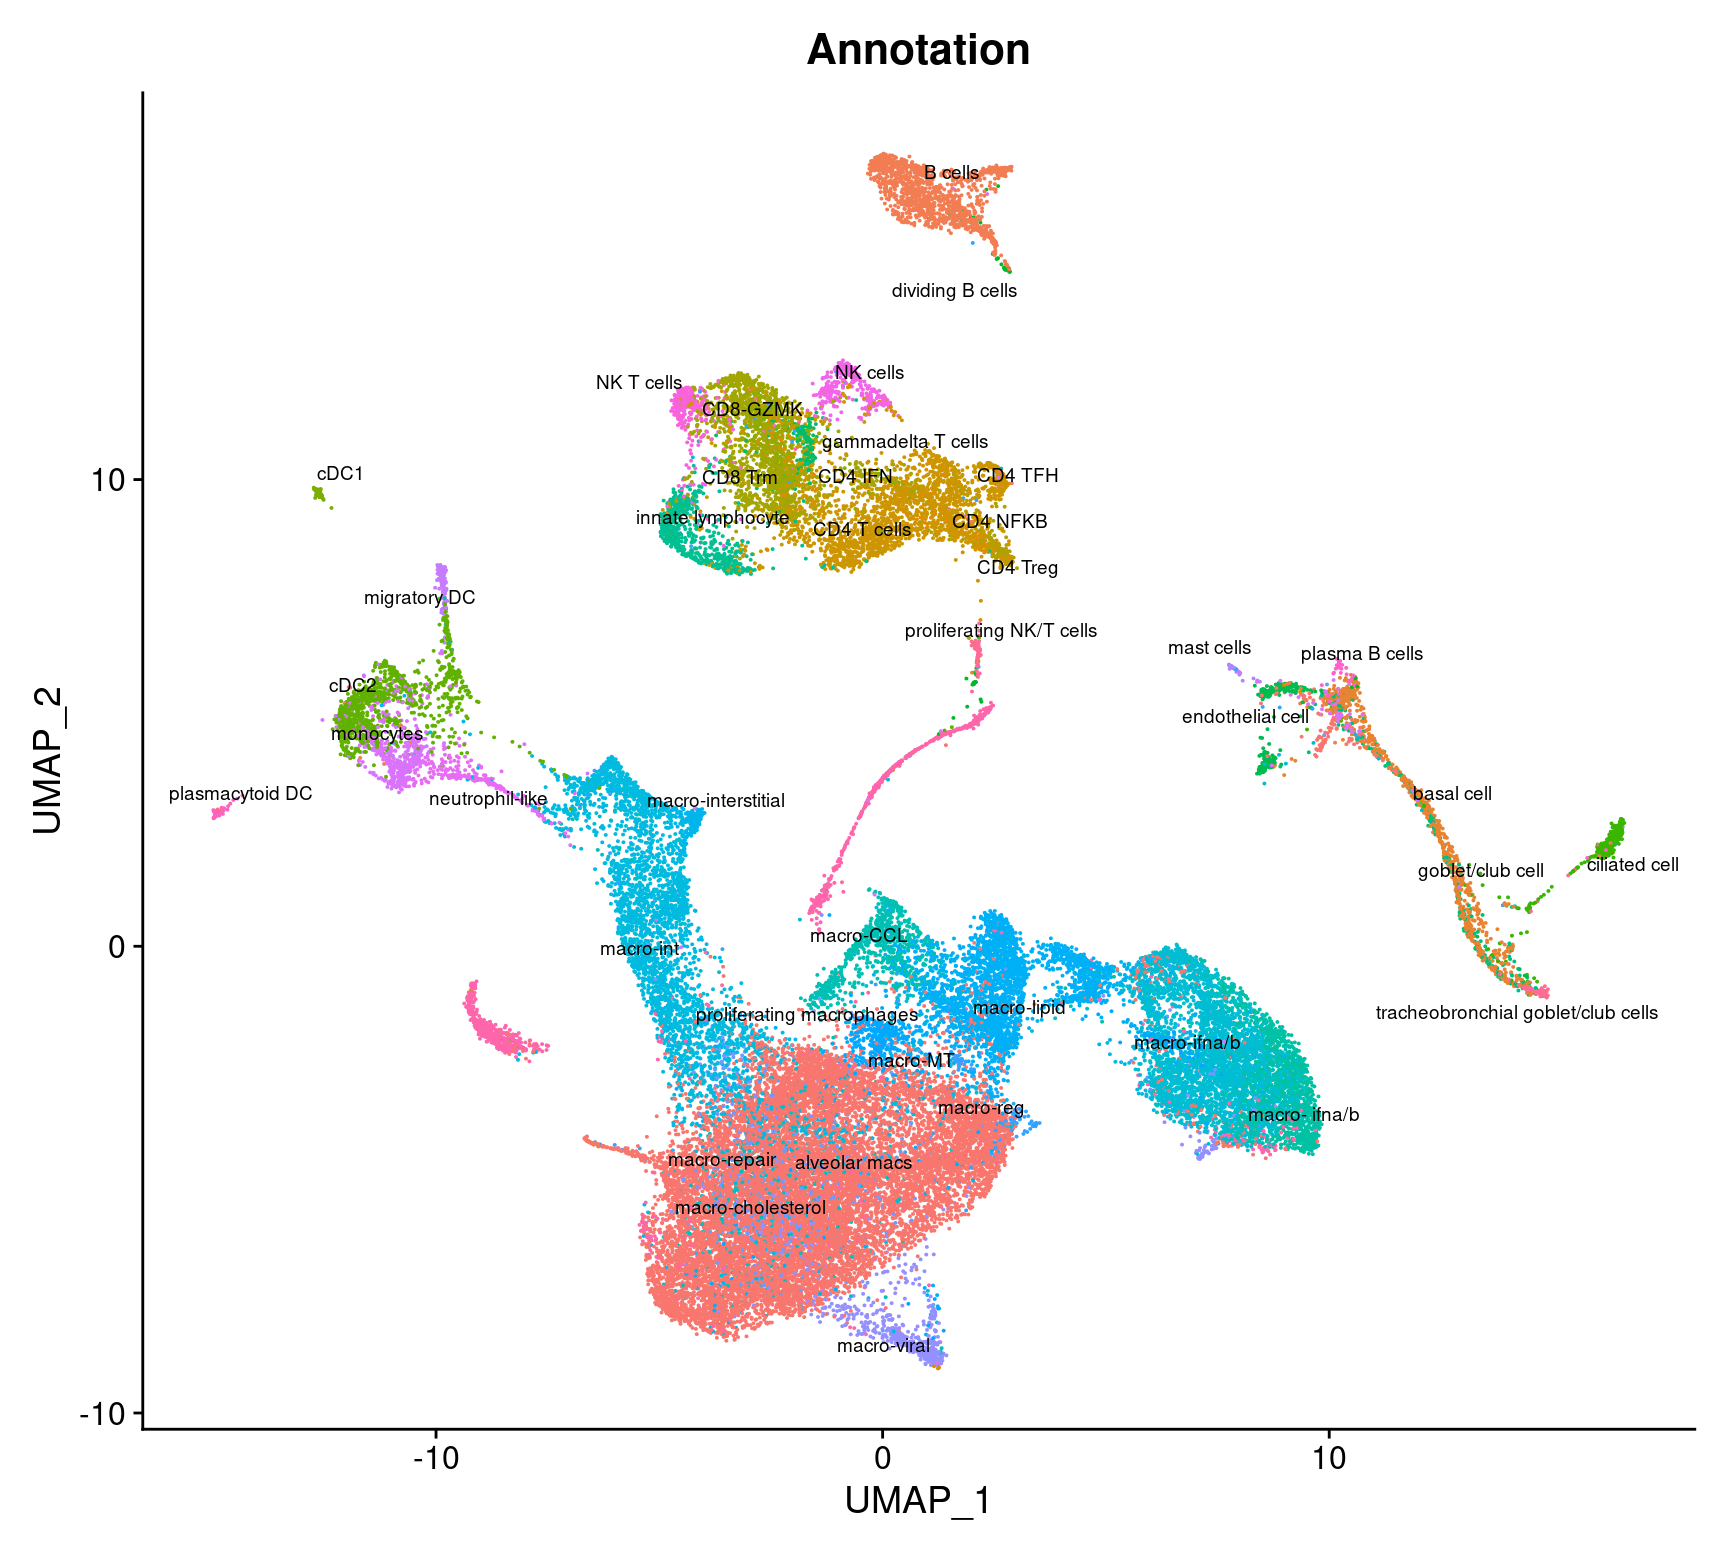
DimPlot(seuInt, reduction = 'umap', label = TRUE, repel = TRUE,
        label.size = 3, group.by = "Broad",
        cols = paletteer::paletteer_d("miscpalettes::pastel",
                                      length(unique(seuInt$Broad)))) +
  NoLegend() -> f1b

f1b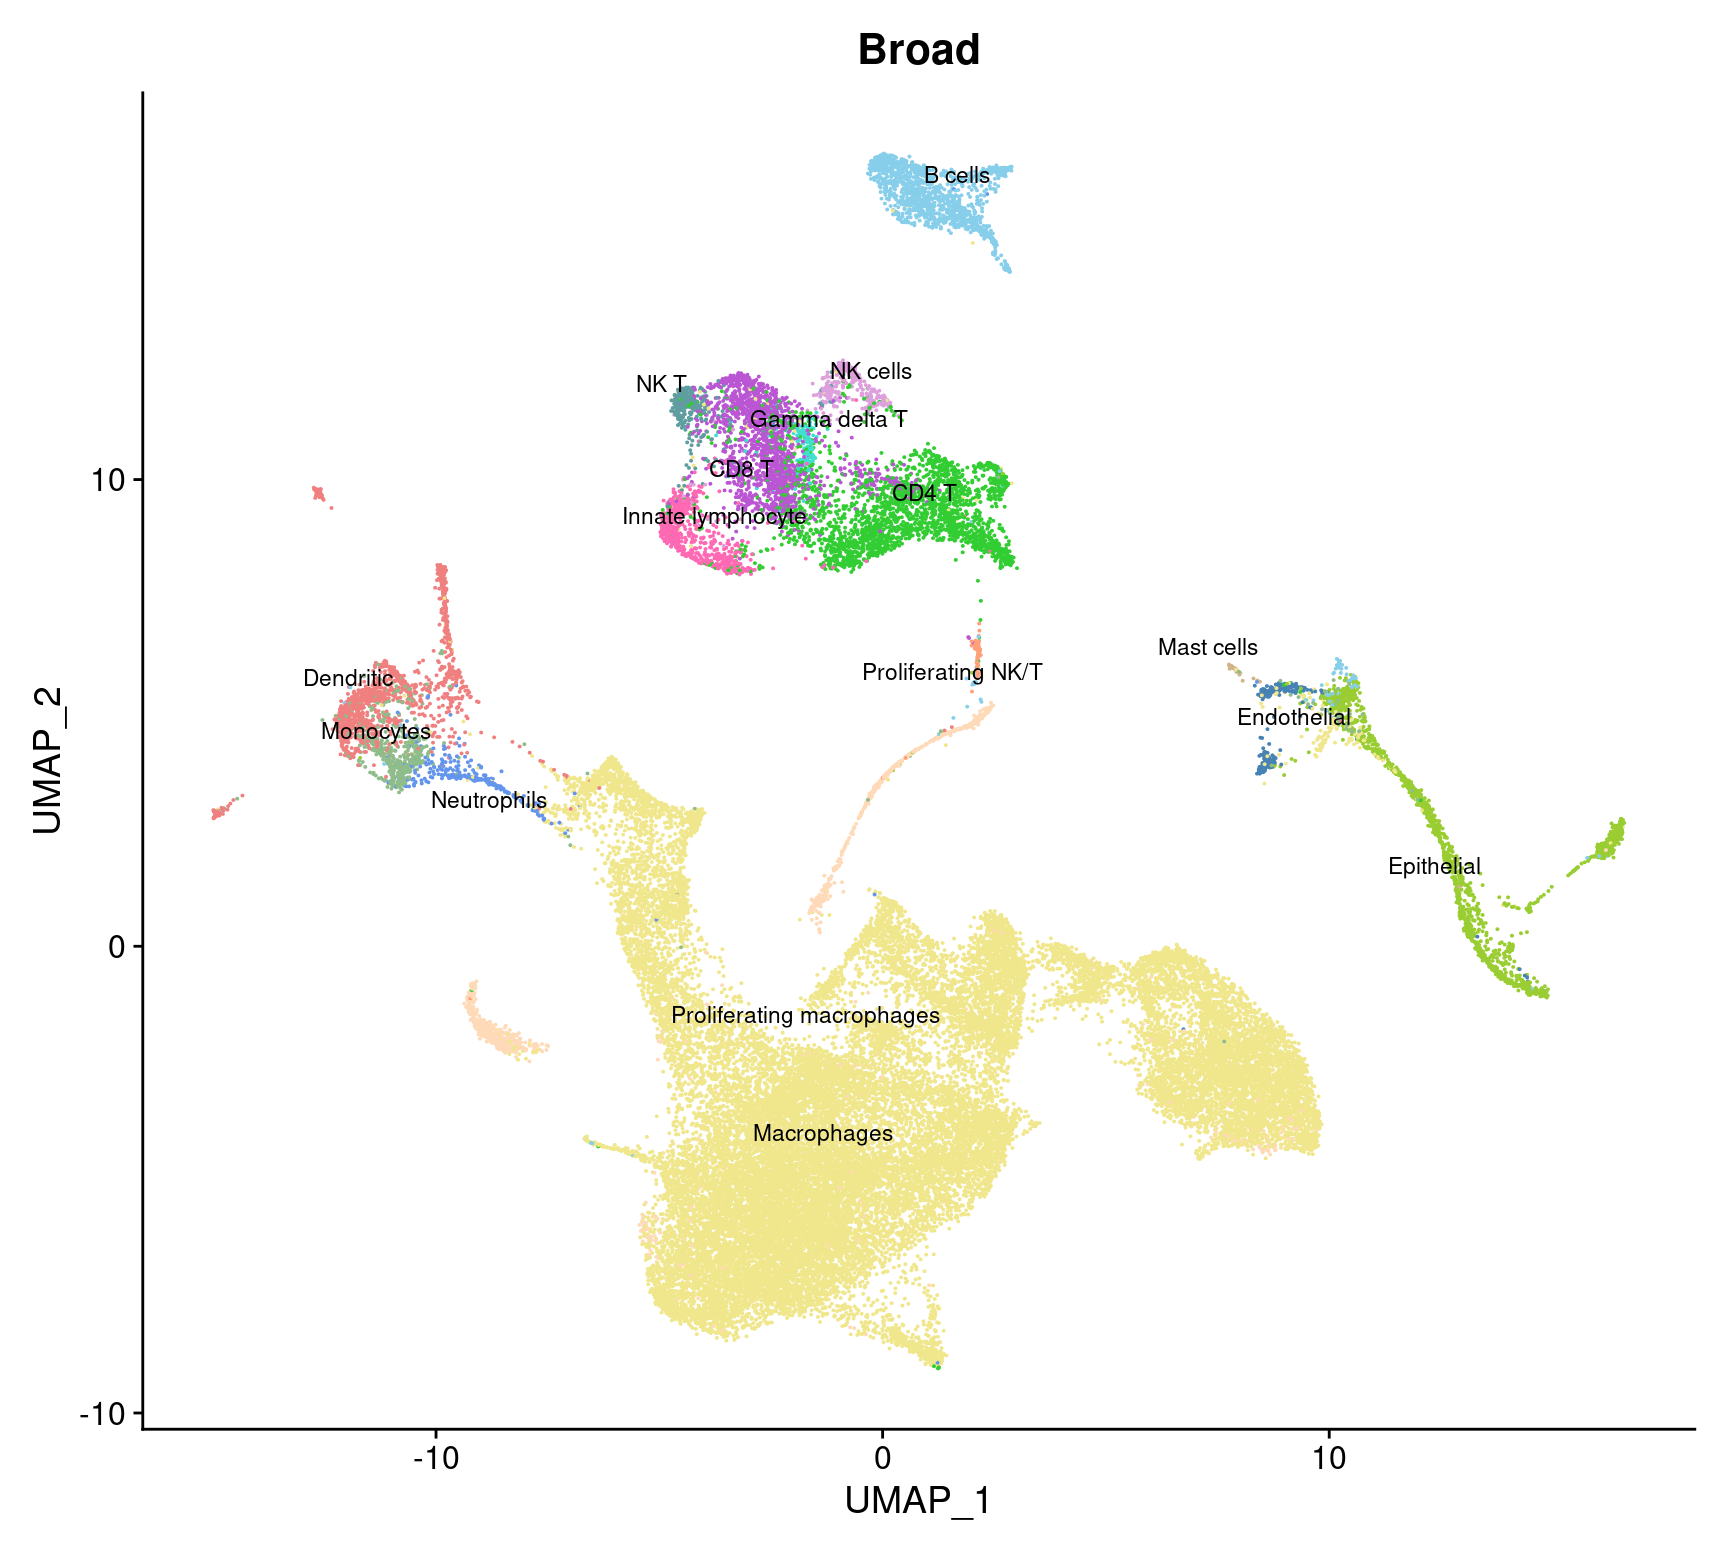
| Version | Author | Date |
|---|---|---|
| 2983a22 | Jovana Maksimovic | 2022-12-19 |
3.2.1 APOC2 gene expression
FeaturePlot(seuInt, features = "APOC2")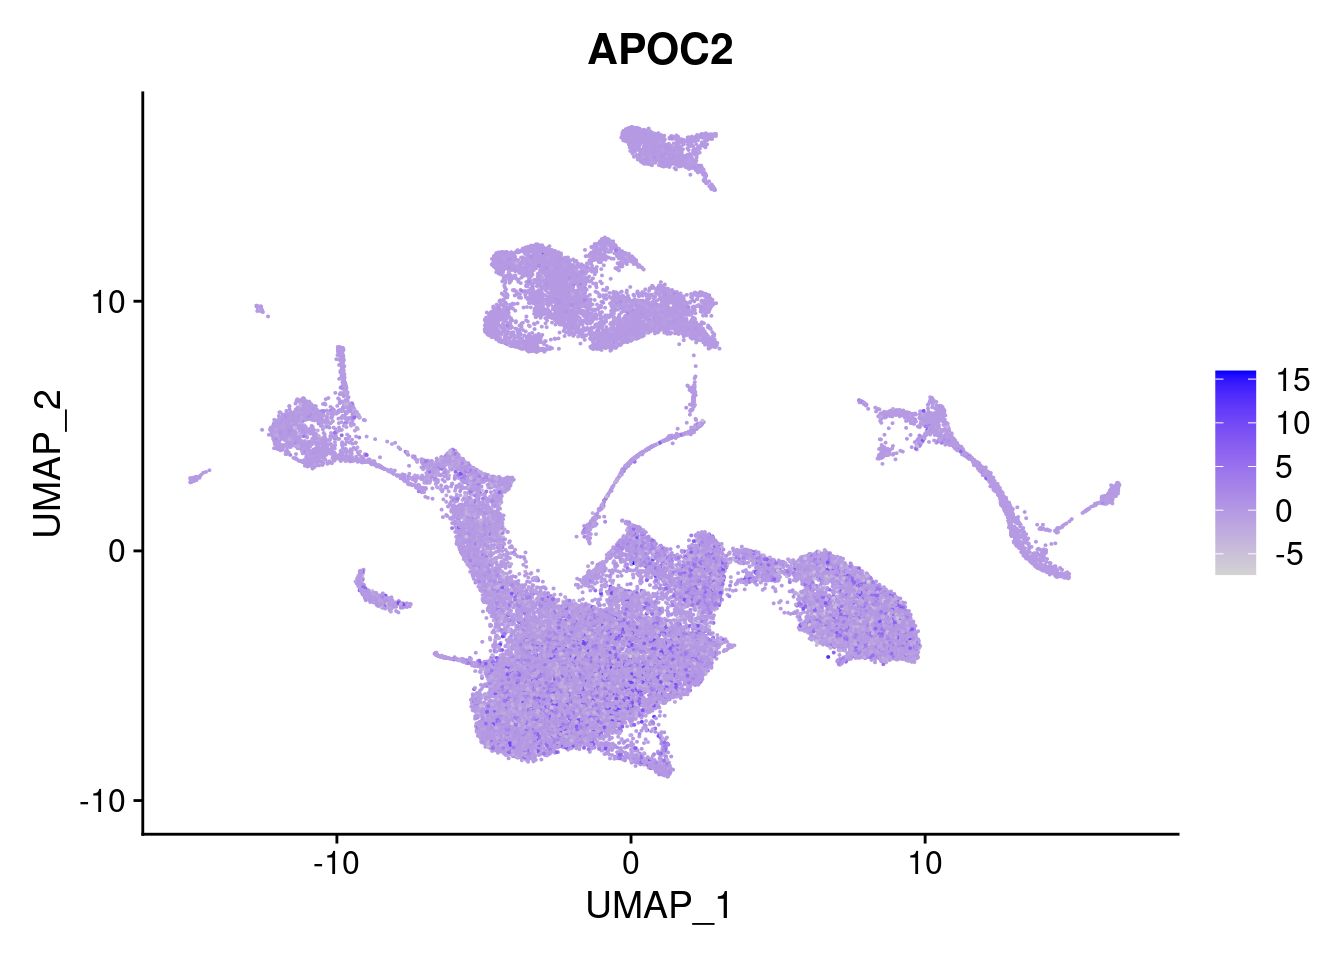
VlnPlot(seuInt, features = "APOC2",
        group.by = "Broad", pt.size = 0,
        log = TRUE) +
  NoLegend() +
  paletteer::scale_fill_paletteer_d("miscpalettes::pastel")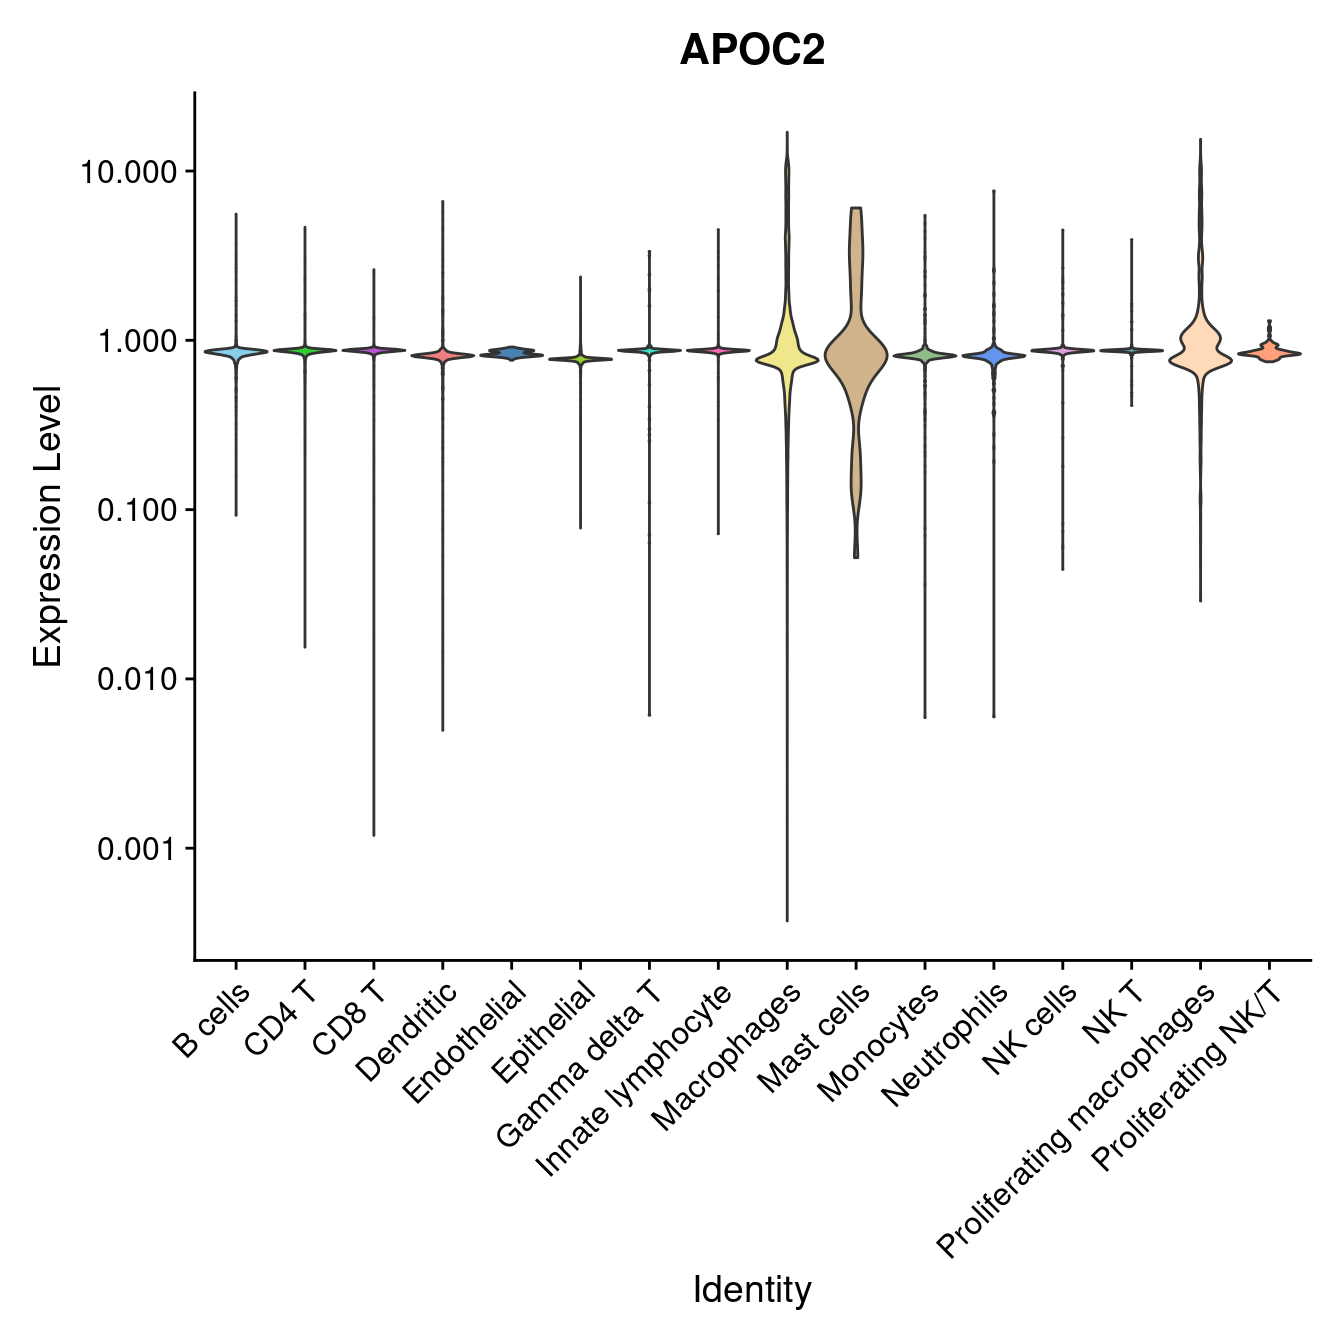
3.3 Cepo cluster marker genes
cepoMarkers <- Cepo(seuInt[["RNA"]]@data,
                   seuInt$Broad,
                   exprsPct = 0.1,
                   logfc = 1)

sapply(1:ncol(cepoMarkers$stats), function(i){
  names(sort(cepoMarkers$stats[,i], decreasing = TRUE))[1:20]
}) -> dat

colnames(dat) <- colnames(cepoMarkers$stats)
dat %>% knitr::kable()| B.cells | CD4.T | CD8.T | Dendritic | Endothelial | Epithelial | Gamma.delta.T | Innate.lymphocyte | Macrophages | Mast.cells | Monocytes | Neutrophils | NK.cells | NK.T | Proliferating.macrophages | Proliferating.NK.T |
|---|---|---|---|---|---|---|---|---|---|---|---|---|---|---|---|
| CD79A | KLRB1 | CD8B | LGALS2 | SPARCL1 | AGR2 | GZMK | LEF1 | CYP27A1 | TPSAB1 | CLEC10A | FCN1 | TRDC | KLRC1 | LPL | TYMS |
| TNFRSF13C | BCL11B | GZMH | CLEC10A | ACKR1 | KRT7 | TRDC | MAL | FFAR4 | CPA3 | FPR3 | CD300E | XCL1 | KLRC2 | HP | MKI67 |
| CD19 | CD3G | CD8A | CD1E | RAMP2 | KRT17 | KLRB1 | CD27 | PPARG | MS4A2 | CSF1R | VCAN | XCL2 | KIR2DL4 | MS4A4A | PCLAF |
| MS4A1 | LINC01943 | GZMA | SERPINF1 | CLDN5 | FXYD3 | TRGC1 | XCL1 | MS4A4A | SLC18A2 | FCGR2B | LILRB2 | KLRF1 | LINC02446 | CYP27A1 | RRM2 |
| TNFRSF13B | SPOCK2 | GZMM | CD1C | NNMT | CLDN4 | KLRG1 | ZNF683 | GPD1 | GATA2 | MARCH1 | FPR1 | KLRC1 | GNLY | GPNMB | NUSAP1 |
| FCRL5 | CTLA4 | LINC02446 | MARCH1 | CLEC14A | KRT19 | GZMM | TRDC | FCGR1A | HDC | F13A1 | IL1B | KLRB1 | CD8B | TREM1 | CDT1 |
| BANK1 | CD3D | KLRD1 | FCER1A | RAMP3 | SMIM22 | PRF1 | TCF7 | SLC7A7 | TPSB2 | FGL2 | LILRB3 | GNLY | ZNF683 | FFAR4 | TOP2A |
| SPIB | MAF | IFNG | FPR3 | ADIRF | SLPI | GZMA | LINC02446 | PILRA | IL1RL1 | MS4A6A | LILRA5 | KRT81 | IFNG | HNMT | ASF1B |
| PAX5 | CD3E | CD3G | PKIB | TM4SF18 | EPCAM | SLC4A10 | KLRC2 | PARAL1 | KIT | LILRB3 | C15orf48 | TXK | GZMB | SLC7A7 | CLSPN |
| CD22 | TRAC | CXCR6 | TSPAN33 | VWF | S100A2 | ZBTB16 | NCR3 | LRP1 | KCNH2 | SLC8A1 | SMIM25 | TNFRSF18 | ITGA1 | PARAL1 | CDCA5 |
| TLR10 | CD6 | PRF1 | CD86 | TM4SF1 | TACSTD2 | CD27 | TRGC2 | HNMT | SLC45A3 | IGSF6 | VEGFA | NCAM1 | CD160 | LRP1 | TPX2 |
| LINC00926 | TRBC1 | ZNF683 | AXL | CAV1 | LCN2 | SAMD3 | RTKN2 | TREM1 | RHEX | TREM2 | S100A8 | KRT86 | CD8A | PHLDA3 | CENPM |
| FCRLA | CXCR6 | LAG3 | BASP1 | NR2F2 | CHST9 | LAG3 | CD7 | PHLDA3 | GCSAML | AXL | CSF1R | PTGDR | GZMH | PPARG | BIRC5 |
| VPREB3 | TNFRSF25 | CD3D | PPP1R14A | DNASE1L3 | MUC16 | DPP4 | CD8B | ITIH5 | SIGLEC6 | CLEC5A | CSF3R | KLRD1 | LINC01871 | CSTA | ZWINT |
| LINC02397 | LCK | CD3E | PLD4 | TIMP3 | TSPAN1 | SPOCK2 | KLRC3 | PCOLCE2 | LIF | CLEC7A | MARCH1 | SAMD3 | KLRD1 | TCF7L2 | CDK1 |
| CD79B | GZMM | BCL11B | RNASE6 | CAVIN1 | ELF3 | CXCR6 | CD3D | GPNMB | NTRK1 | RAB31 | FPR3 | SPINK2 | SCML4 | OLR1 | ASPM |
| IGHD | CD2 | GZMB | GAS6 | RNASE1 | KRT8 | IL18RAP | TRBC1 | OLR1 | TPSD1 | CD86 | FGL2 | IL2RB | PRF1 | RETN | EZH2 |
| MEF2C | TRBC2 | LINC01871 | SLC8A1 | PALMD | CLDN3 | KLRC1 | CD3G | NCF2 | RGS13 | TGFBI | ANPEP | TNFRSF4 | DAPK2 | FCGR1A | UBE2C |
| RALGPS2 | CD247 | TRAC | P2RY13 | FAM167B | DSP | CD247 | CD8A | TCF7L2 | CDK15 | GAS6 | TMEM176B | CD7 | CSF1 | NCF2 | MYBL2 |
| BLK | TRAT1 | CCL4 | MEF2C | CAVIN2 | TMC5 | CD3G | CD3E | C5AR1 | PBX1 | FCGR2A | MARCKS | PRF1 | CLNK | MNDA | CDCA7 |
3.3.1 Cepo marker gene dot plot
Genes duplicated between clusters are excluded.
DefaultAssay(seuInt) <- "RNA"

maxGenes <- 5
sigGenes <- lapply(1:ncol(dat), function(i){
  dat[,i][1:maxGenes]
})
sig <- unlist(sigGenes)
geneCols <- c(rep(rep(c("blue","black"), each = maxGenes),
                  ceiling(ncol(dat)/2)))[1:length(sig)][!duplicated(sig)]

geneCols <- rep(paletteer_d("miscpalettes::pastel", ncol(dat)),
                each = maxGenes)[1:length(sig)][!duplicated(sig)]

pal <- paletteer::paletteer_d("vapoRwave::cool")
DotPlot(seuInt,
        features = sig[!duplicated(sig)],
        group.by = "Broad",
        dot.scale = 2.5) +
  FontSize(y.text = 10, x.text = 8) +
  labs(y = element_blank(), x = element_blank()) +
  theme(axis.text.x = element_text(color = geneCols,
                                   angle = 90,
                                   hjust = 1,
                                   vjust = 0.5),
        legend.text = element_text(size = 8),
        legend.title = element_text(size = 10)) +
  scale_color_gradient2(low = pal[1],
                        mid = pal[3],
                        high = pal[5]) -> f1d
f1d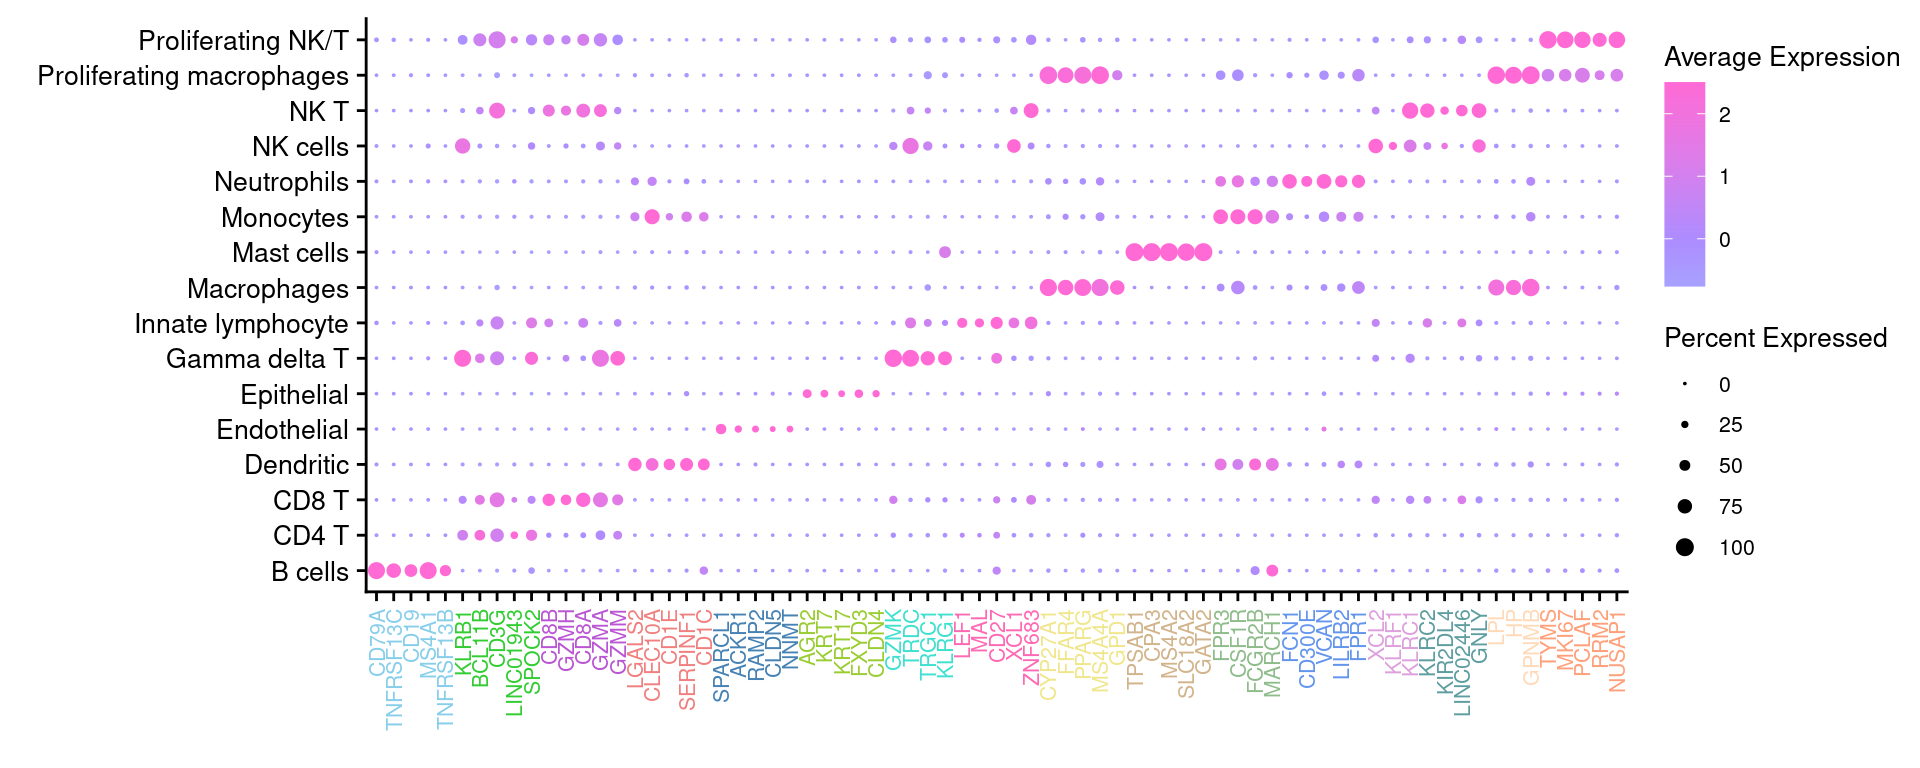
4 Analyse cell type proportions
4.1 Load clinical information
Import clinical characteristics and patient information and associate with genetic_donor IDs.
info <- read.csv(file = here("data/sample_sheets/Sample_information.csv"))
tab <- table(seuInt$HTO, seuInt$donor)

apply(tab, 2, function(x){
  names(which(x == max(x)))
}) %>% data.frame %>%
  dplyr::rename("HTO" = ".") %>%
  rownames_to_column(var = "donor") %>%
  inner_join(info, by = c("HTO" = "Sample")) %>%
  mutate(Batch = factor(Batch)) -> info

info %>% knitr::kable()| donor | HTO | Participant | Sex | Age | Disease | Batch |
|---|---|---|---|---|---|---|
| A | A | B1_CF | M | 2.99 | CF | 1 |
| B | B | C1_CF | M | 2.99 | CF | 1 |
| C | C | A1_Ctrl | M | 3.00 | Ctrl | 1 |
| D | D | D1_CF | M | 3.03 | CF | 1 |
| donor_A | Human_HTO_8 | L2_CF | M | 5.95 | CF | 2 |
| donor_B | Human_HTO_1 | E2_CF | F | 5.99 | CF | 2 |
| donor_C | Human_HTO_4 | H2_CF | F | 5.89 | CF | 2 |
| donor_D | Human_HTO_6 | J2_CF | M | 5.05 | CF | 2 |
| donor_E | Human_HTO_3 | G2_CF | F | 4.91 | CF | 2 |
| donor_F | Human_HTO_5 | I2_CF | F | 5.93 | CF | 2 |
| donor_G | Human_HTO_2 | F2_CF | F | 6.02 | CF | 2 |
| donor_H | Human_HTO_7 | K2_CF | M | 4.92 | CF | 2 |
4.2 Manual annotation proportions (Broad)
# Differences in cell type proportions
props <- getTransformedProps(clusters = seuInt$Broad,
                             sample = seuInt$donor, transform="asin")
props$Proportions %>% knitr::kable()| A | B | C | D | donor_A | donor_B | donor_C | donor_D | donor_E | donor_F | donor_G | donor_H | |
|---|---|---|---|---|---|---|---|---|---|---|---|---|
| B cells | 0.1408250 | 0.0200811 | 0.0476004 | 0.0104379 | 0.0646275 | 0.0939457 | 0.0058170 | 0.0150781 | 0.0057394 | 0.0044978 | 0.0072669 | 0.0036215 |
| CD4 T | 0.0877193 | 0.0519270 | 0.0512619 | 0.0363527 | 0.1771090 | 0.0403619 | 0.0994183 | 0.0301562 | 0.0205942 | 0.0202399 | 0.1893419 | 0.0203712 |
| CD8 T | 0.0429113 | 0.0174442 | 0.0780698 | 0.0260348 | 0.0656142 | 0.0320111 | 0.0634585 | 0.0231556 | 0.0114787 | 0.0116192 | 0.0670166 | 0.0153916 |
| Dendritic | 0.0106686 | 0.0373225 | 0.0646005 | 0.0243551 | 0.0814011 | 0.0431454 | 0.0190375 | 0.0312332 | 0.0202566 | 0.0123688 | 0.0545014 | 0.0194658 |
| Endothelial | 0.0386439 | 0.0312373 | 0.0000000 | 0.0000000 | 0.0000000 | 0.0000000 | 0.0000000 | 0.0000000 | 0.0000000 | 0.0000000 | 0.0000000 | 0.0000000 |
| Epithelial | 0.1704599 | 0.1527383 | 0.0119001 | 0.0007199 | 0.0256537 | 0.0556715 | 0.0021153 | 0.0037695 | 0.0027009 | 0.0000000 | 0.0020186 | 0.0285197 |
| Gamma delta T | 0.0109056 | 0.0032454 | 0.0020923 | 0.0022795 | 0.0009867 | 0.0000000 | 0.0063458 | 0.0000000 | 0.0000000 | 0.0003748 | 0.0242229 | 0.0009054 |
| Innate lymphocyte | 0.0142248 | 0.0115619 | 0.0134693 | 0.0254349 | 0.0133202 | 0.0048713 | 0.0126917 | 0.0140011 | 0.0057394 | 0.0003748 | 0.0464271 | 0.0058850 |
| Macrophages | 0.4388336 | 0.5977688 | 0.6478358 | 0.8267546 | 0.4740997 | 0.6638831 | 0.7176097 | 0.8260635 | 0.8646185 | 0.8845577 | 0.5349213 | 0.8266184 |
| Mast cells | 0.0021337 | 0.0006085 | 0.0007846 | 0.0000000 | 0.0103601 | 0.0041754 | 0.0000000 | 0.0000000 | 0.0000000 | 0.0000000 | 0.0000000 | 0.0004527 |
| Monocytes | 0.0028450 | 0.0060852 | 0.0244540 | 0.0081584 | 0.0138135 | 0.0104384 | 0.0058170 | 0.0113086 | 0.0087779 | 0.0153673 | 0.0141300 | 0.0104120 |
| Neutrophils | 0.0064011 | 0.0036511 | 0.0096770 | 0.0022795 | 0.0330538 | 0.0097425 | 0.0031729 | 0.0037695 | 0.0010128 | 0.0011244 | 0.0048446 | 0.0009054 |
| NK cells | 0.0180180 | 0.0107505 | 0.0086308 | 0.0038392 | 0.0103601 | 0.0062630 | 0.0084611 | 0.0010770 | 0.0030385 | 0.0018741 | 0.0222043 | 0.0009054 |
| NK T | 0.0085349 | 0.0206897 | 0.0104616 | 0.0026395 | 0.0113468 | 0.0173974 | 0.0058170 | 0.0016155 | 0.0000000 | 0.0003748 | 0.0064594 | 0.0040742 |
| Proliferating macrophages | 0.0049787 | 0.0338742 | 0.0279848 | 0.0266347 | 0.0172669 | 0.0180932 | 0.0497091 | 0.0387722 | 0.0557056 | 0.0468516 | 0.0193783 | 0.0620190 |
| Proliferating NK/T | 0.0018966 | 0.0010142 | 0.0011769 | 0.0040792 | 0.0009867 | 0.0000000 | 0.0005288 | 0.0000000 | 0.0003376 | 0.0003748 | 0.0072669 | 0.0004527 |
4.2.1 Cell proportions by donor (Broad)
props$Proportions %>%
  data.frame %>%
  inner_join(info, by = c("sample" = "donor")) %>%
ggplot(aes(x = Participant, y = Freq, fill = clusters)) +
  geom_bar(stat = "identity") +
  theme_classic() +
  theme(axis.text.x = element_text(angle = 90,
                                   vjust = 0.5,
                                   hjust = 1),
        legend.text = element_text(size = 10)) +
  labs(y = "Proportion", fill = "Cell Label") +
  paletteer::scale_fill_paletteer_d("miscpalettes::pastel") -> f1c
f1c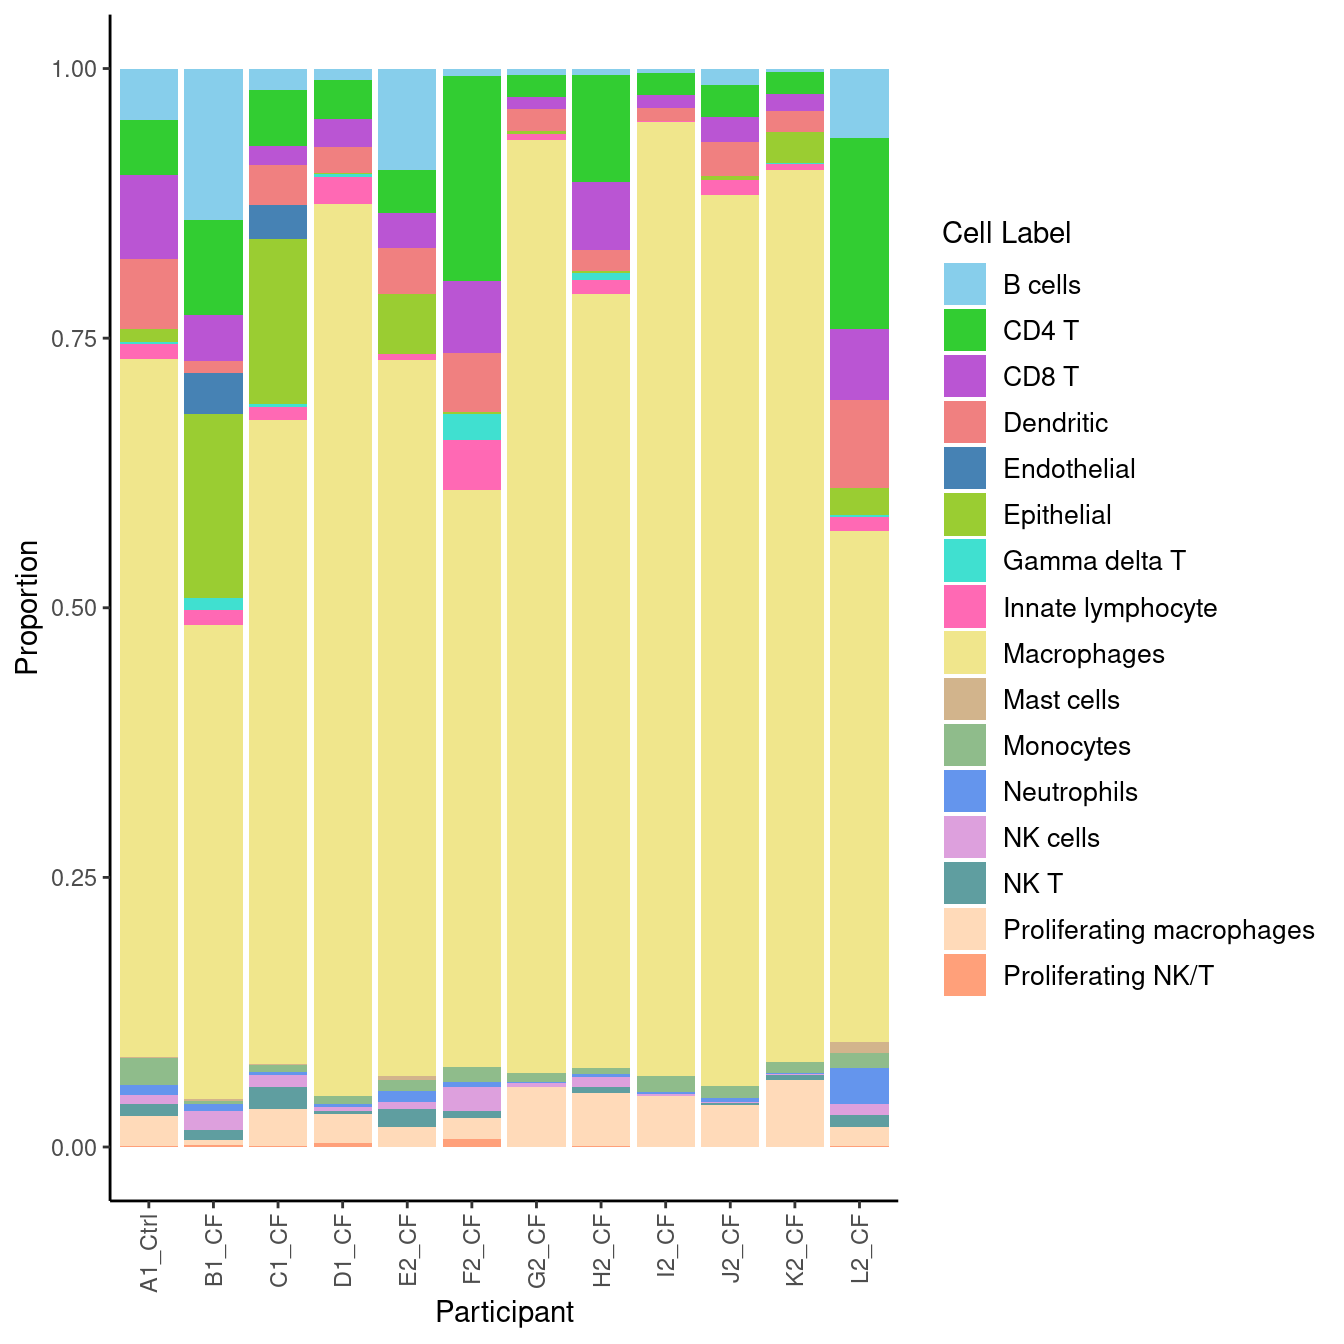
| Version | Author | Date |
|---|---|---|
| 2983a22 | Jovana Maksimovic | 2022-12-19 |
4.2.2 Cell proportions of control sample relative to CF samples (Broad)
props$Proportions %>%
  data.frame %>%
  inner_join(info, by = c("sample" = "donor")) -> dat

ggplot(dat[dat$Participant != "A1_Ctrl",],
       aes(x = clusters, y = Freq)) +
  geom_boxplot() +
  geom_point(data = dat[dat$Participant == "A1_Ctrl", ],
             aes(x = clusters, y = Freq),
             color = "red") +
  theme_classic() +
  theme(axis.text.x = element_text(angle = 90,
                                   vjust = 0.5,
                                   hjust = 1),
        legend.text = element_text(size = 8)) +
  labs(y = "Proportion") +
  NoLegend() -> p1
p1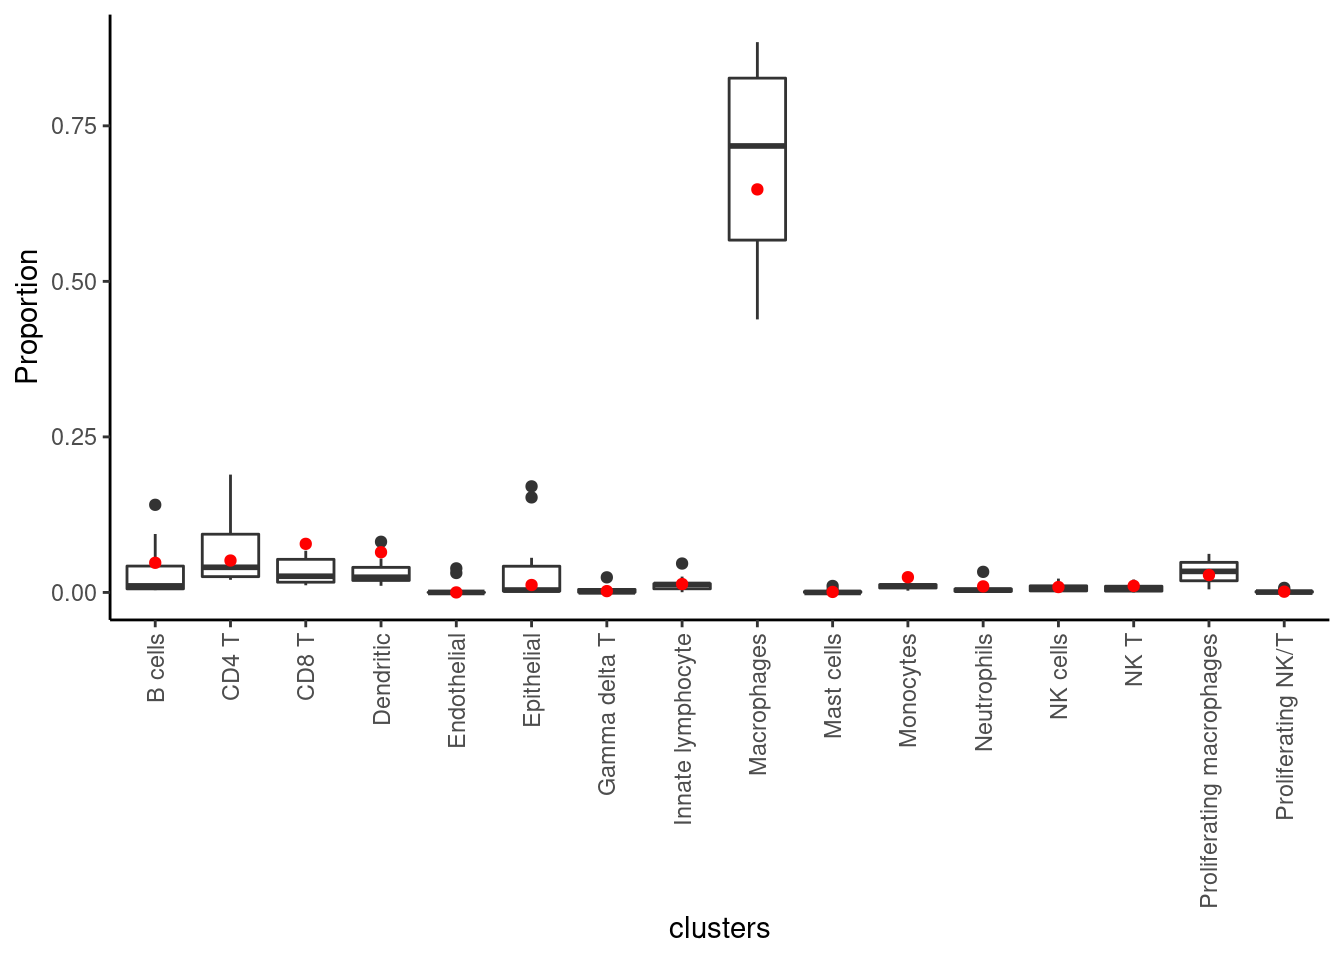
4.2.3 Cell proportions of control sample relative to CF samples (Fine)
macrophages <- c("Macrophages")
tcells <- c("T cell lineage", "Innate lymphoid cell NK")
lung <- c("AT1", "EC arterial", "Rare", "Secretory", "Basal",
          "EC venous", "Multiciliated lineage", "EC capillary",
          "Lymphatic EC mature", "AT2")

seuInt$grouping <- ifelse(seuInt$predicted.ann_level_3 %in% macrophages, "Macrophages",
                          ifelse(seuInt$predicted.ann_level_3 %in% tcells, "T\\NK Cells", "Other Cells"))

propsFine <- getTransformedProps(clusters = seuInt$Annotation,
                             sample = seuInt$donor, transform="asin")

propsFine$Proportions %>%
  data.frame %>%
  inner_join(info, by = c("sample" = "donor")) -> dat

dat %>%
  left_join(seuInt@meta.data %>%
              dplyr::select(Annotation, grouping) %>%
              distinct, by = c("clusters" = "Annotation")) -> dat

lapply(unique(dat$grouping), function(grp) {
ggplot(dat[dat$grouping == grp & dat$Participant != "A1_Ctrl",],
       aes(x = clusters, y = Freq)) +
  geom_boxplot() +
  geom_point(data = dat[dat$grouping == grp & dat$Participant == "A1_Ctrl", ],
             aes(x = clusters, y = Freq),
             color = "red") +
  theme_classic() +
  theme(axis.text.x = element_text(angle = 90,
                                   vjust = 0.5,
                                   hjust = 1),
        legend.text = element_text(size = 8)) +
  labs(y = "Proportion") +
  NoLegend()
}) -> p

c(list(p1), p) -> p

((p[[1]] + theme(axis.title.x = element_blank())) /
  ((p[[2]] + theme(axis.title.x = element_blank())) +
     (p[[3]] + theme(axis.title.y = element_blank(),
                     axis.title.x = element_blank())) +
     (p[[4]] + theme(axis.title.y = element_blank(),
                     axis.title.x = element_blank())))) +
  plot_annotation(tag_levels = "A") &
  theme(plot.tag = element_text(size = 14, face = "bold"))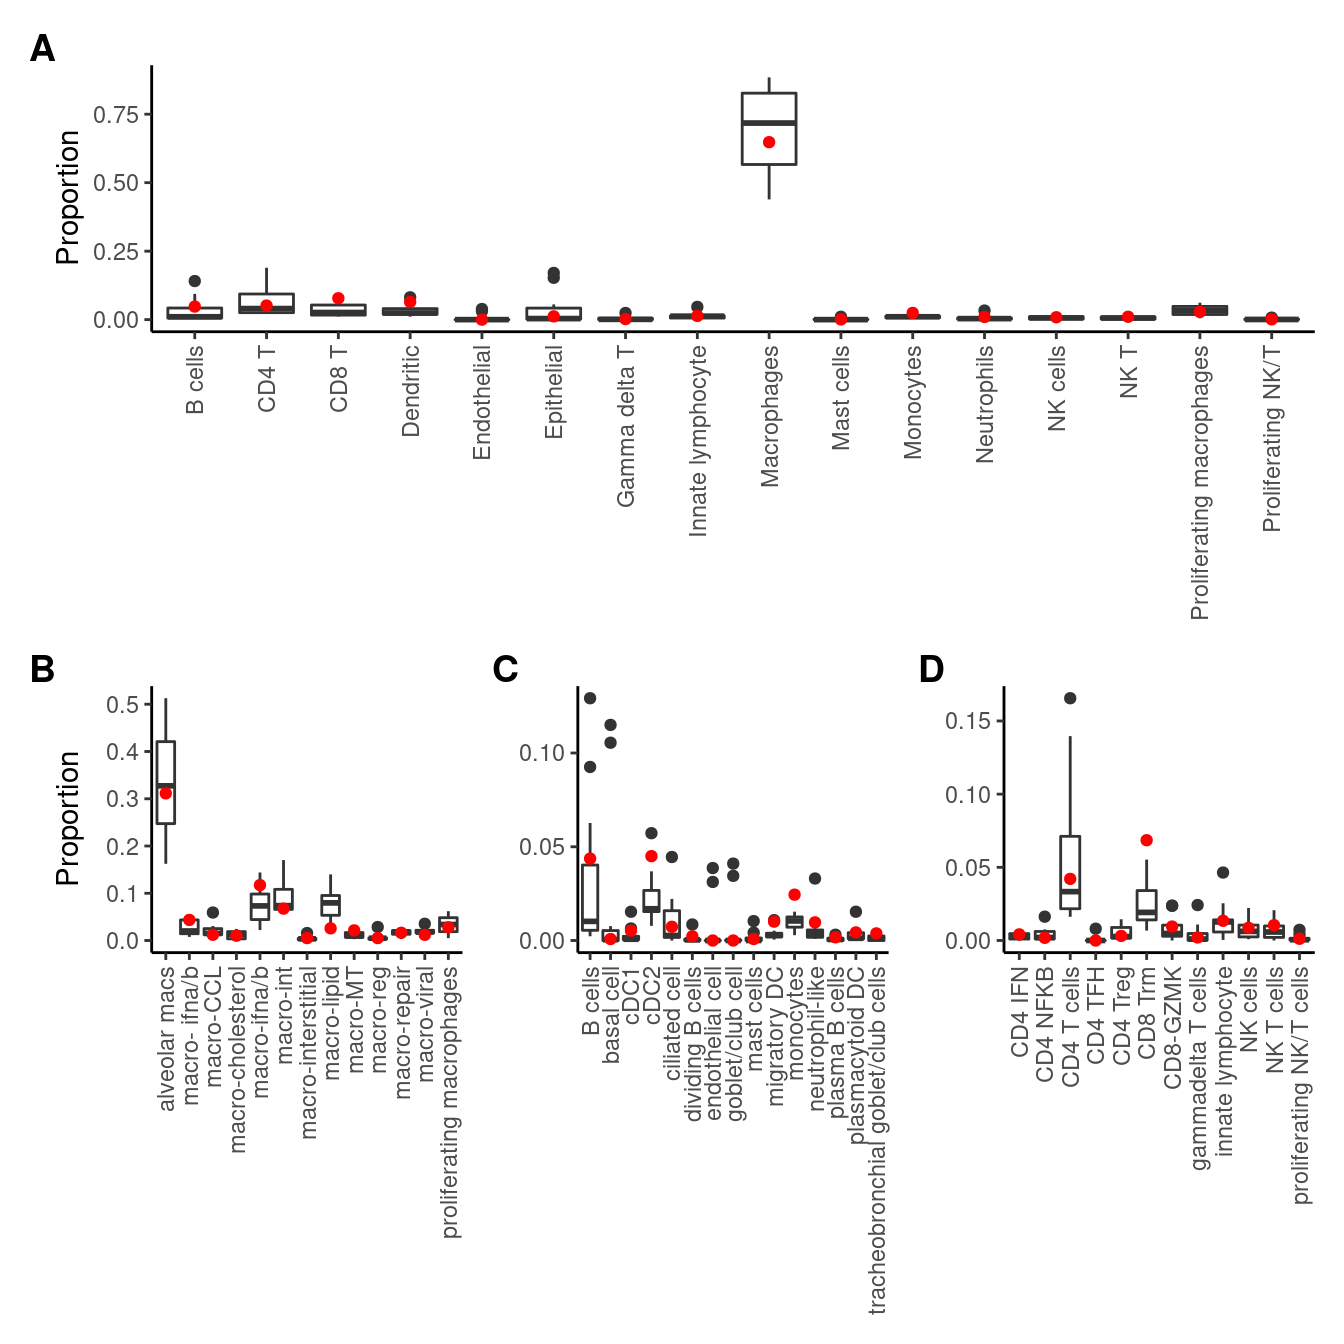
5 Compare flow cytometry and scRNA-seq proportions
5.1 Format proportions for comparison
5.1.1 Flow
flow <- read_csv(file = here("data/CITE-seq_pilot_proportions_final.csv"))

flow %>%
  dplyr::rename(HTO = "...1") %>%
  pivot_longer(cols = -HTO,
               names_to = "cell") %>%
  mutate(value = value / 100) -> flowProps

flowProps %>% head(n = 10) %>% knitr::kable()| HTO | cell | value |
|---|---|---|
| Human_HTO_2 | B cells | 0.0076608 |
| Human_HTO_2 | CD4 T | 0.1901783 |
| Human_HTO_2 | CD8 T | 0.0791989 |
| Human_HTO_2 | Dendritic | 0.0157482 |
| Human_HTO_2 | Macrophages | 0.5330048 |
| Human_HTO_2 | Monocytes | 0.0164748 |
| Human_HTO_2 | Neutrophils | 0.0227456 |
| Human_HTO_2 | Epithelial | 0.0006160 |
| Human_HTO_3 | B cells | 0.0032860 |
| Human_HTO_3 | CD4 T | 0.0269643 |
5.1.2 scRNA-seq
props <- getTransformedProps(clusters = ifelse(seuInt$Broad == "Proliferating macrophages",
                                               "Macrophages",
                                               seuInt$Broad),
                             sample = seuInt$donor, transform="asin")

props$Proportions %>%
  as.data.frame.matrix %>%
  data.frame %>%
  rownames_to_column(var = "cell") %>%
  pivot_longer(cols = -cell) %>%
  inner_join(dplyr::select(info, donor, HTO), by = c("name" = "donor")) %>%
  dplyr::select(-name) -> scProps

scProps %>% head(n = 10) %>% knitr::kable()| cell | value | HTO |
|---|---|---|
| B cells | 0.1408250 | A |
| B cells | 0.0200811 | B |
| B cells | 0.0476004 | C |
| B cells | 0.0104379 | D |
| B cells | 0.0646275 | Human_HTO_8 |
| B cells | 0.0939457 | Human_HTO_1 |
| B cells | 0.0058170 | Human_HTO_4 |
| B cells | 0.0150781 | Human_HTO_6 |
| B cells | 0.0057394 | Human_HTO_3 |
| B cells | 0.0044978 | Human_HTO_5 |
5.2 Test flow cytometry vs. scRNA-seq proportions
Prepare the data for comparison.
flowProps %>% left_join(scProps, by = c("HTO", "cell")) %>%
  left_join(info) -> dat

dat %>%
  dplyr::select(Participant, cell, value.x, value.y) %>%
  pivot_wider(names_from = Participant,
                    names_sep = ".",
                    values_from = c(value.x, value.y)) %>%
  column_to_rownames(var = "cell") -> datw
Setup design matrix etc. for propeller style comparison using arcsin transformation and limma.
Test for difference between flow cytometry and scRNA-seq proportions taking individual into account.
tech <- factor(substr(colnames(datw), 1, 7),
               labels = c("flow", "sc"))
participant <- factor(substr(colnames(datw), 9, 13))

design <- model.matrix(~ 0 + tech + participant)
colnames(design)[1:2] <- levels(tech)

mycontr <- makeContrasts(FvSC = flow-sc,
                         levels = design)

fit <- lmFit(asin(sqrt(datw)), design)
fit.cont <- contrasts.fit(fit, contrasts = mycontr)
fit.cont <- eBayes(fit.cont, robust = TRUE, trend = FALSE)

top <- topTable(fit.cont, coef = 1)
top %>% knitr::kable()| logFC | AveExpr | t | P.Value | adj.P.Val | B | |
|---|---|---|---|---|---|---|
| Neutrophils | 0.0936506 | 0.1133596 | 5.1504648 | 0.0007631 | 0.0061050 | -0.1641039 |
| Dendritic | -0.0755565 | 0.1386891 | -3.9665266 | 0.0037965 | 0.0151861 | -1.7848679 |
| Macrophages | -0.1087933 | 1.0455078 | -2.3693605 | 0.0440176 | 0.1173803 | -4.2269994 |
| CD8 T | 0.0339028 | 0.1981006 | 1.1544616 | 0.2802708 | 0.4633173 | -5.8930122 |
| Epithelial | 0.0124804 | 0.0826590 | 1.0527742 | 0.3219457 | 0.4633173 | -6.0002471 |
| B cells | -0.0116431 | 0.1006070 | -0.9954292 | 0.3474880 | 0.4633173 | -6.0574042 |
| CD4 T | 0.0147809 | 0.2659411 | 0.5366039 | 0.6055356 | 0.6920406 | -6.4155994 |
| Monocytes | 0.0066650 | 0.1090712 | 0.2818535 | 0.7849138 | 0.7849138 | -6.5275829 |
Neutrophils and dendritic cells show statistically significant differences in cell type proportions between technologies.
5.3 Visualise flow cytometry vs. scRNA-seq proportions
A statistically significant difference in cell type proportions between technologies is indicated with an asterisk (*).
p <- vector("list", length(unique(dat$cell)))

for(i in 1:length(p)) {
  tmp <- dat %>%
    dplyr::filter(cell == unique(dat$cell)[i])

  # cors <- cor.test(tmp$value.x, tmp$value.y,
  #                  method = "spearman")
  sig <- ifelse(top[unique(dat$cell)[i], ]$adj.P.Val < 0.05, "*", "")
  lim <- max(c(tmp$value.x, tmp$value.y))

  p[[i]] <- ggplot(tmp,
                   aes(x = value.x, y = value.y, colour = Participant)) +
    geom_point() +
    geom_smooth(method = "lm",
                alpha = 0.15,
                size = 0.5,
                colour = "grey") +
    # annotate("text", -Inf, Inf,
    #          label = glue("rho: {round(cors$estimate, 2)}
    #                        p-value: {scales::scientific(cors$p.value)}"),
    #          hjust = 0, vjust = 1, size = 3) +
    labs(x = "Proportion (Flow Cytometry)",
         y = "Proportion (scRNA-seq)") +
    ylim(c(0, lim)) +
    xlim(c(0, lim)) +
    theme_classic() +
    ggtitle(glue("{unique(dat$cell)[i]}{sig}"))

}

wrap_plots(p, ncol = 3) +
  plot_layout(guides = "collect") &
  theme(legend.position = "bottom",
        axis.title = element_text(size = 10))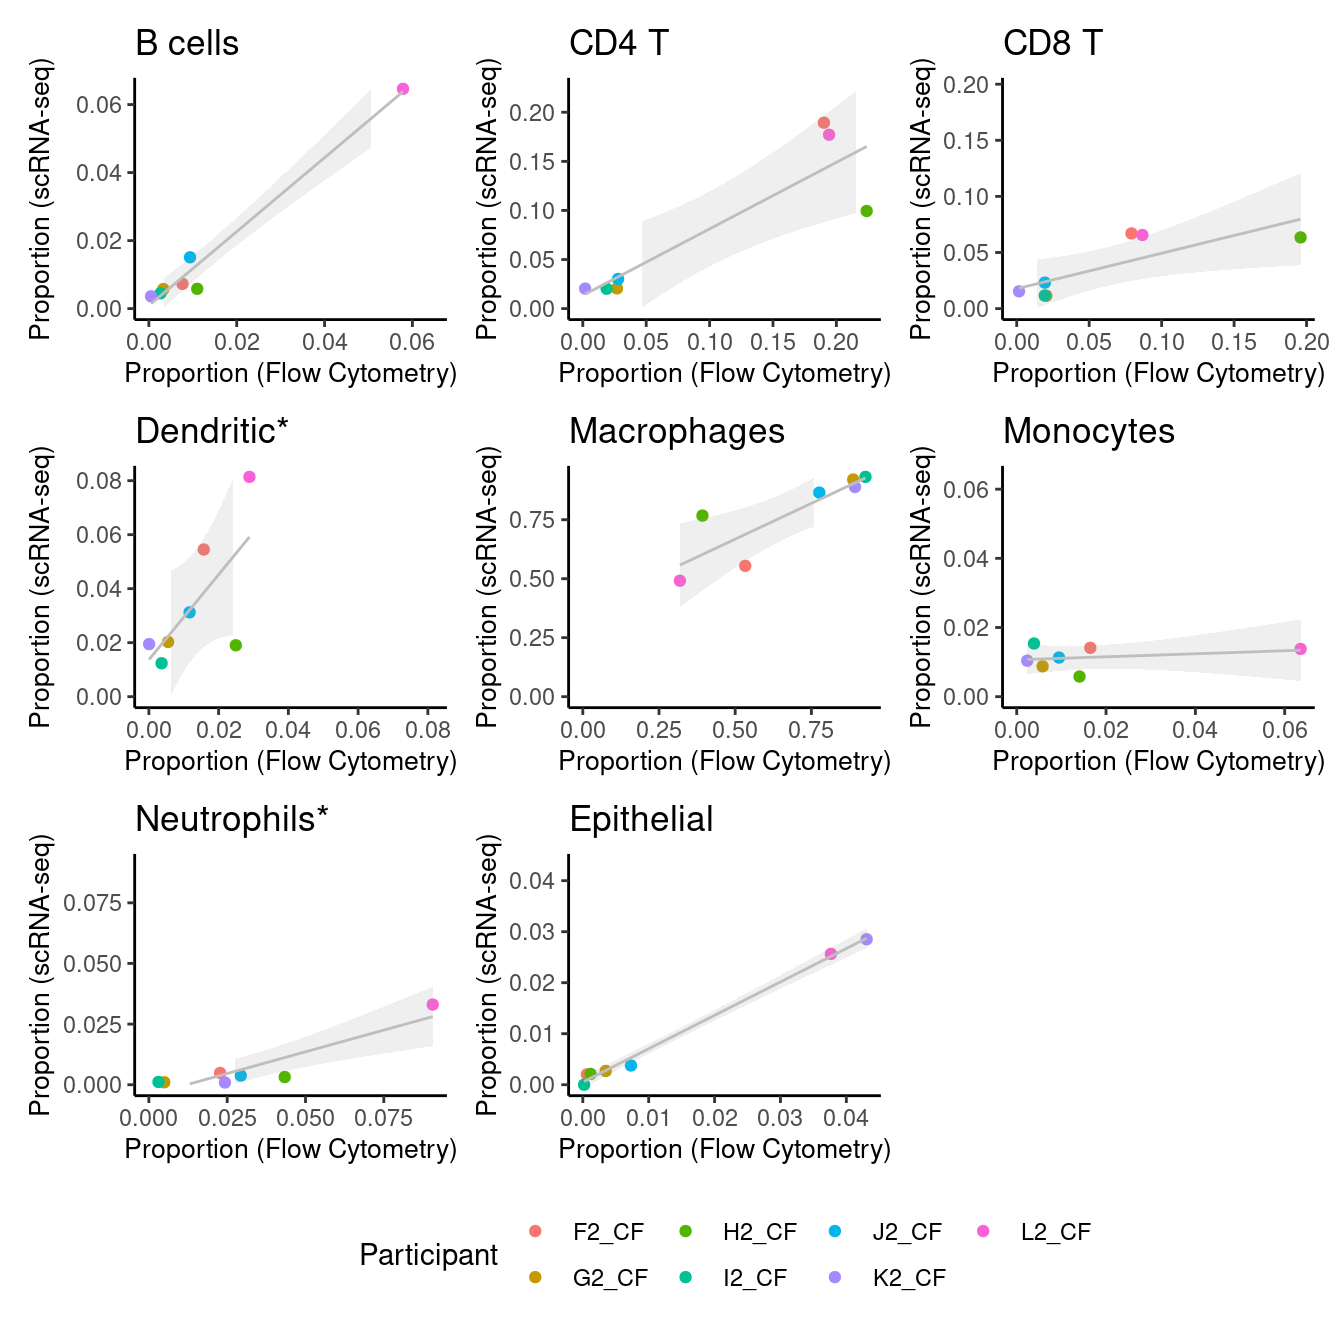
| Version | Author | Date |
|---|---|---|
| 2983a22 | Jovana Maksimovic | 2022-12-19 |
p <- vector("list", length(unique(dat$cell)))

for(i in 1:length(p)) {
  tmp <- dat %>%
    dplyr::filter(cell == unique(dat$cell)[i]) %>%
    rowwise() %>%
    mutate(avg = mean(c(value.x, value.y)),
           diff = value.x - value.y)

  sig <- ifelse(top[unique(dat$cell)[i], ]$adj.P.Val < 0.05, "*", "")
  lim <- max(abs(tmp$diff))
  if (lim < 0.05) lim <- 0.05

  p[[i]] <- ggplot(tmp,
                   aes(x = avg, y = diff, colour = Participant)) +
    geom_point() +
    geom_hline(yintercept = 0, linetype = "dashed", colour = "black") +
    labs(x = "Mean",
         y = "Difference (F - SC)") +
    ylim(c(-lim, lim)) +
    theme_classic() +
    ggtitle(glue("{unique(dat$cell)[i]}{sig}"))

}

wrap_plots(p, ncol = 3) +
  plot_layout(guides = "collect") &
  theme(legend.position = "bottom",
        axis.title = element_text(size = 10),
        axis.text = element_text(size = 8))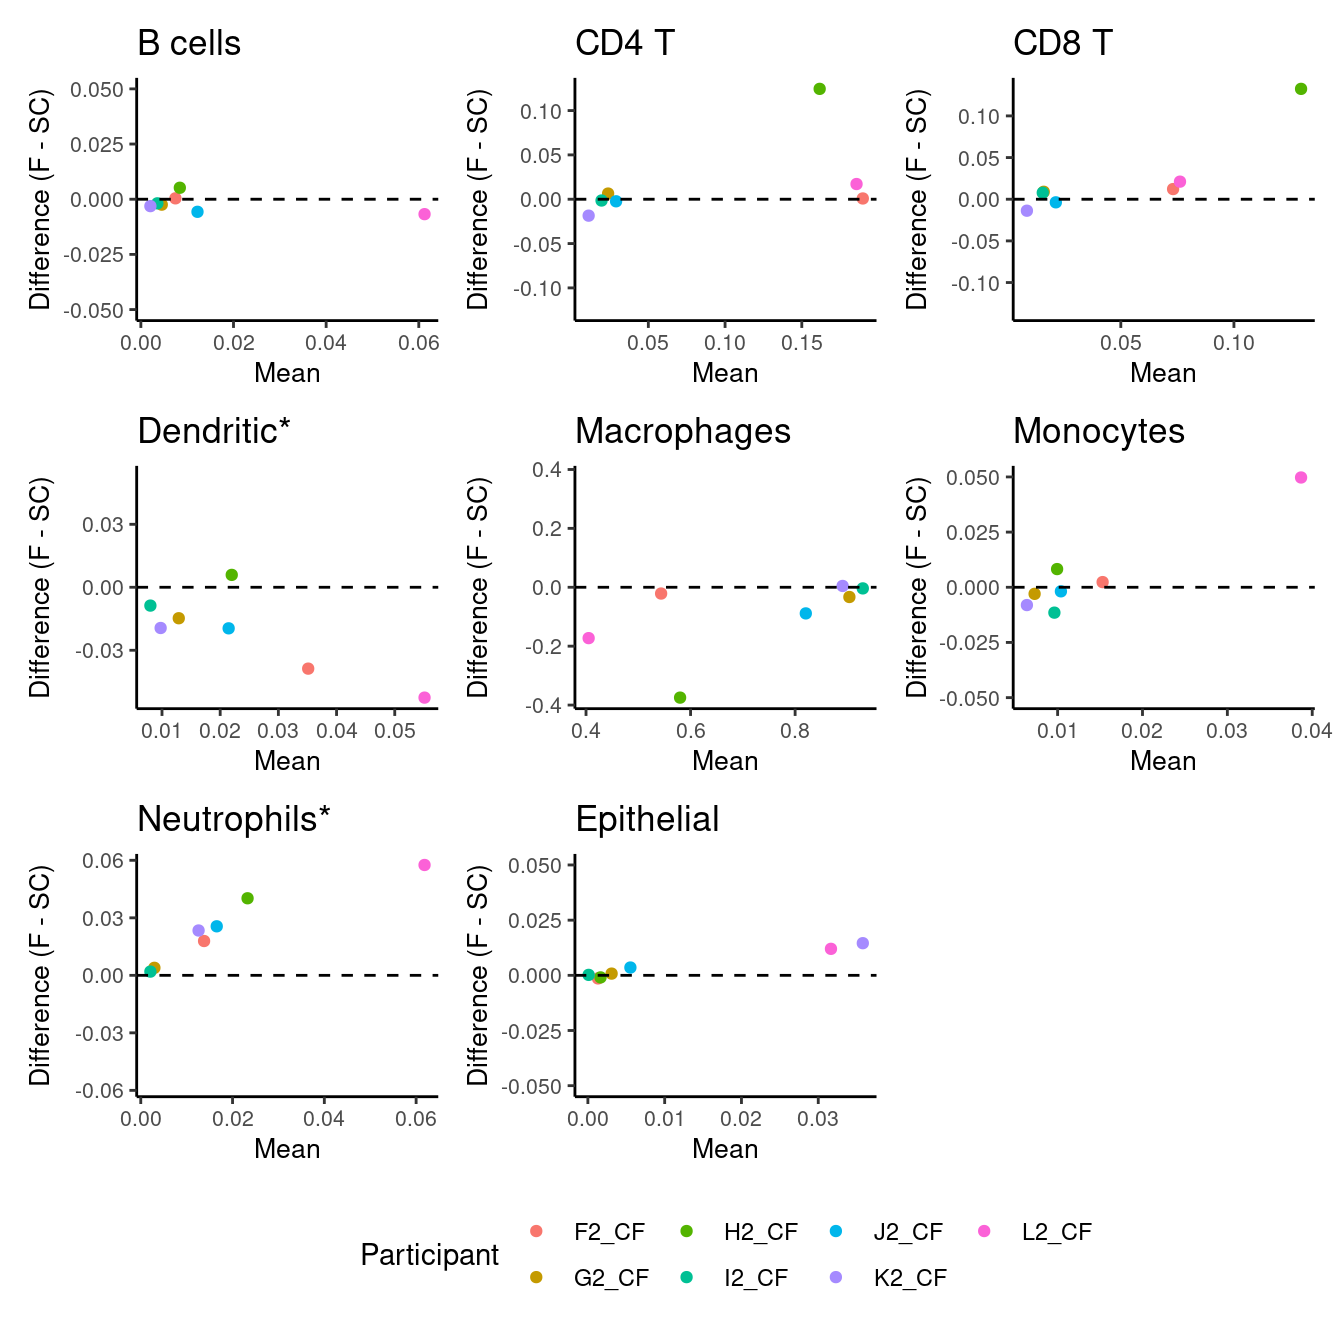
| Version | Author | Date |
|---|---|---|
| 2983a22 | Jovana Maksimovic | 2022-12-19 |
6 Load protein data
6.1 Add to Seurat object
seuAdt <- readRDS(here("data",
                       "SCEs",
                       "05_COMBO.clustered_annotated_adt_diet.SEU.rds"))
seuAdt <- subset(seuAdt, cells = colnames(seuInt))
all(colnames(seuAdt) == colnames(seuInt))
[1] TRUEseuInt[["ADT.dsb"]] <- seuAdt[["ADT.dsb"]]
seuInt[["ADT.raw"]] <- seuAdt[["ADT.raw"]]
seuIntAn object of class Seurat
35263 features across 42658 samples within 5 assays
Active assay: RNA (16001 features, 0 variable features)
4 other assays present: ADT.dsb, ADT.raw, SCT, integrated
2 dimensional reductions calculated: pca, umaprm(seuAdt)
gc() used (Mb) gc trigger (Mb) max used (Mb)
Ncells 9985089 533.3 14700345 785.1 14700345 785.1
Vcells 1385115786 10567.6 3242561506 24738.8 3240825692 24725.66.2 Load protein annotations
prots <- read_csv(file = here("data",
                              "sample_sheets",
                              "TotalSeq-A_Universal_Cocktail_v1.0.csv")) %>%
  dplyr::filter(grepl("^A0", id)) %>%
  dplyr::filter(!grepl("[Ii]sotype", name))
6.2.1 Visualise ADTs of interest
adt <- read_csv(file = here("data/Proteins_broad_22.04.22.csv"))
adt <- adt[!duplicated(adt$DNA_ID),]

cbind(seuInt@meta.data,
      as.data.frame(t(seuInt@assays$ADT.dsb@data))) %>%
  dplyr::group_by(Broad, experiment) %>%
  dplyr::summarize_at(.vars = adt$DNA_ID, .funs = median) %>%
  pivot_longer(c(-Broad, -experiment), names_to = "ADT",
               values_to = "ADT Exp.") %>%
  left_join(adt, by = c("ADT" = "DNA_ID")) %>%
  dplyr::rename(`Cell Label` = Broad,
                Protein = `Name for heatmap`) |>
  dplyr::filter(experiment == 2) |>
  ungroup() %>%
    heatmap(
        .column = Protein,
        .row = `Cell Label`,
        .value = `ADT Exp.`,
        scale = "none",
        rect_gp = grid::gpar(col = "white", lwd = 1),
        show_row_names = TRUE,
        column_names_gp = grid::gpar(fontsize = 10),
        row_names_gp = grid::gpar(fontsize = 10),
        palette_value = circlize::colorRamp2(seq(-1, 8, length.out = 256),
                                         viridis::magma(256)),
        column_title_side = "bottom") |>
  add_tile(`Cell Label`, show_annotation_name = FALSE, show_legend = FALSE,
           palette = paletteer_d("miscpalettes::pastel", ncol(dat)))-> f1e

wrap_heatmap(f1e)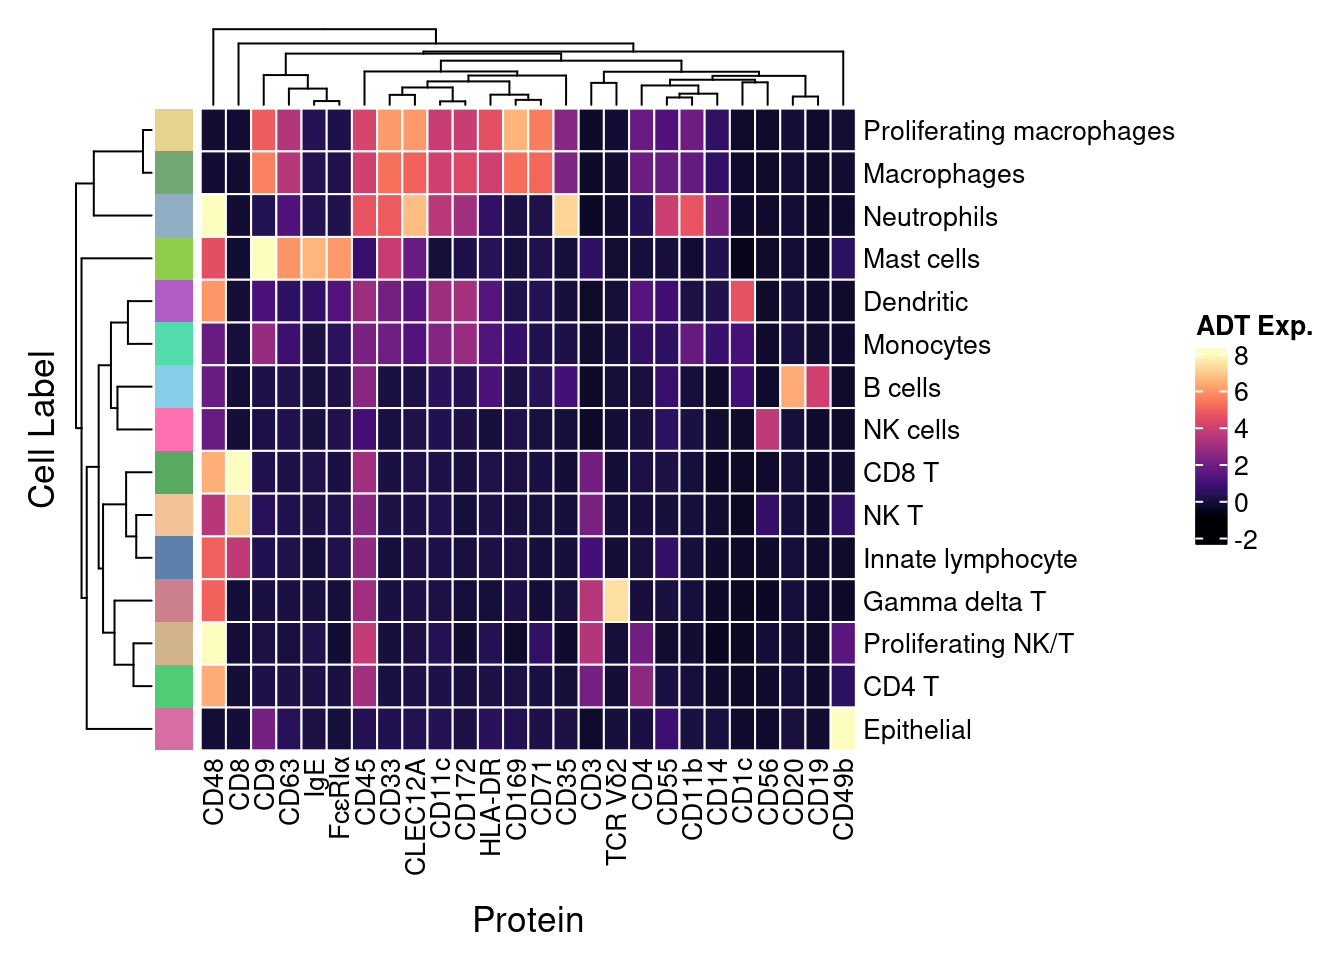
7 Panel figures
layout = "AAAA
          AAAA
          BBBC
          BBBC
          DDDD
          DDDD
          EEEE
          EEEE
          EEEE"
((ggplot(data.frame(x = 1, y = 1), aes(x, y)) +
    geom_point(colour = "white") +
    theme_void()) +
 (f1b + ggtitle("")) +
   f1c +
   f1d +
   wrap_heatmap(f1e)) +
  plot_layout(design = layout) +
  plot_annotation(tag_levels = "A") &
  theme(plot.tag = element_text(size = 14, face = "bold"))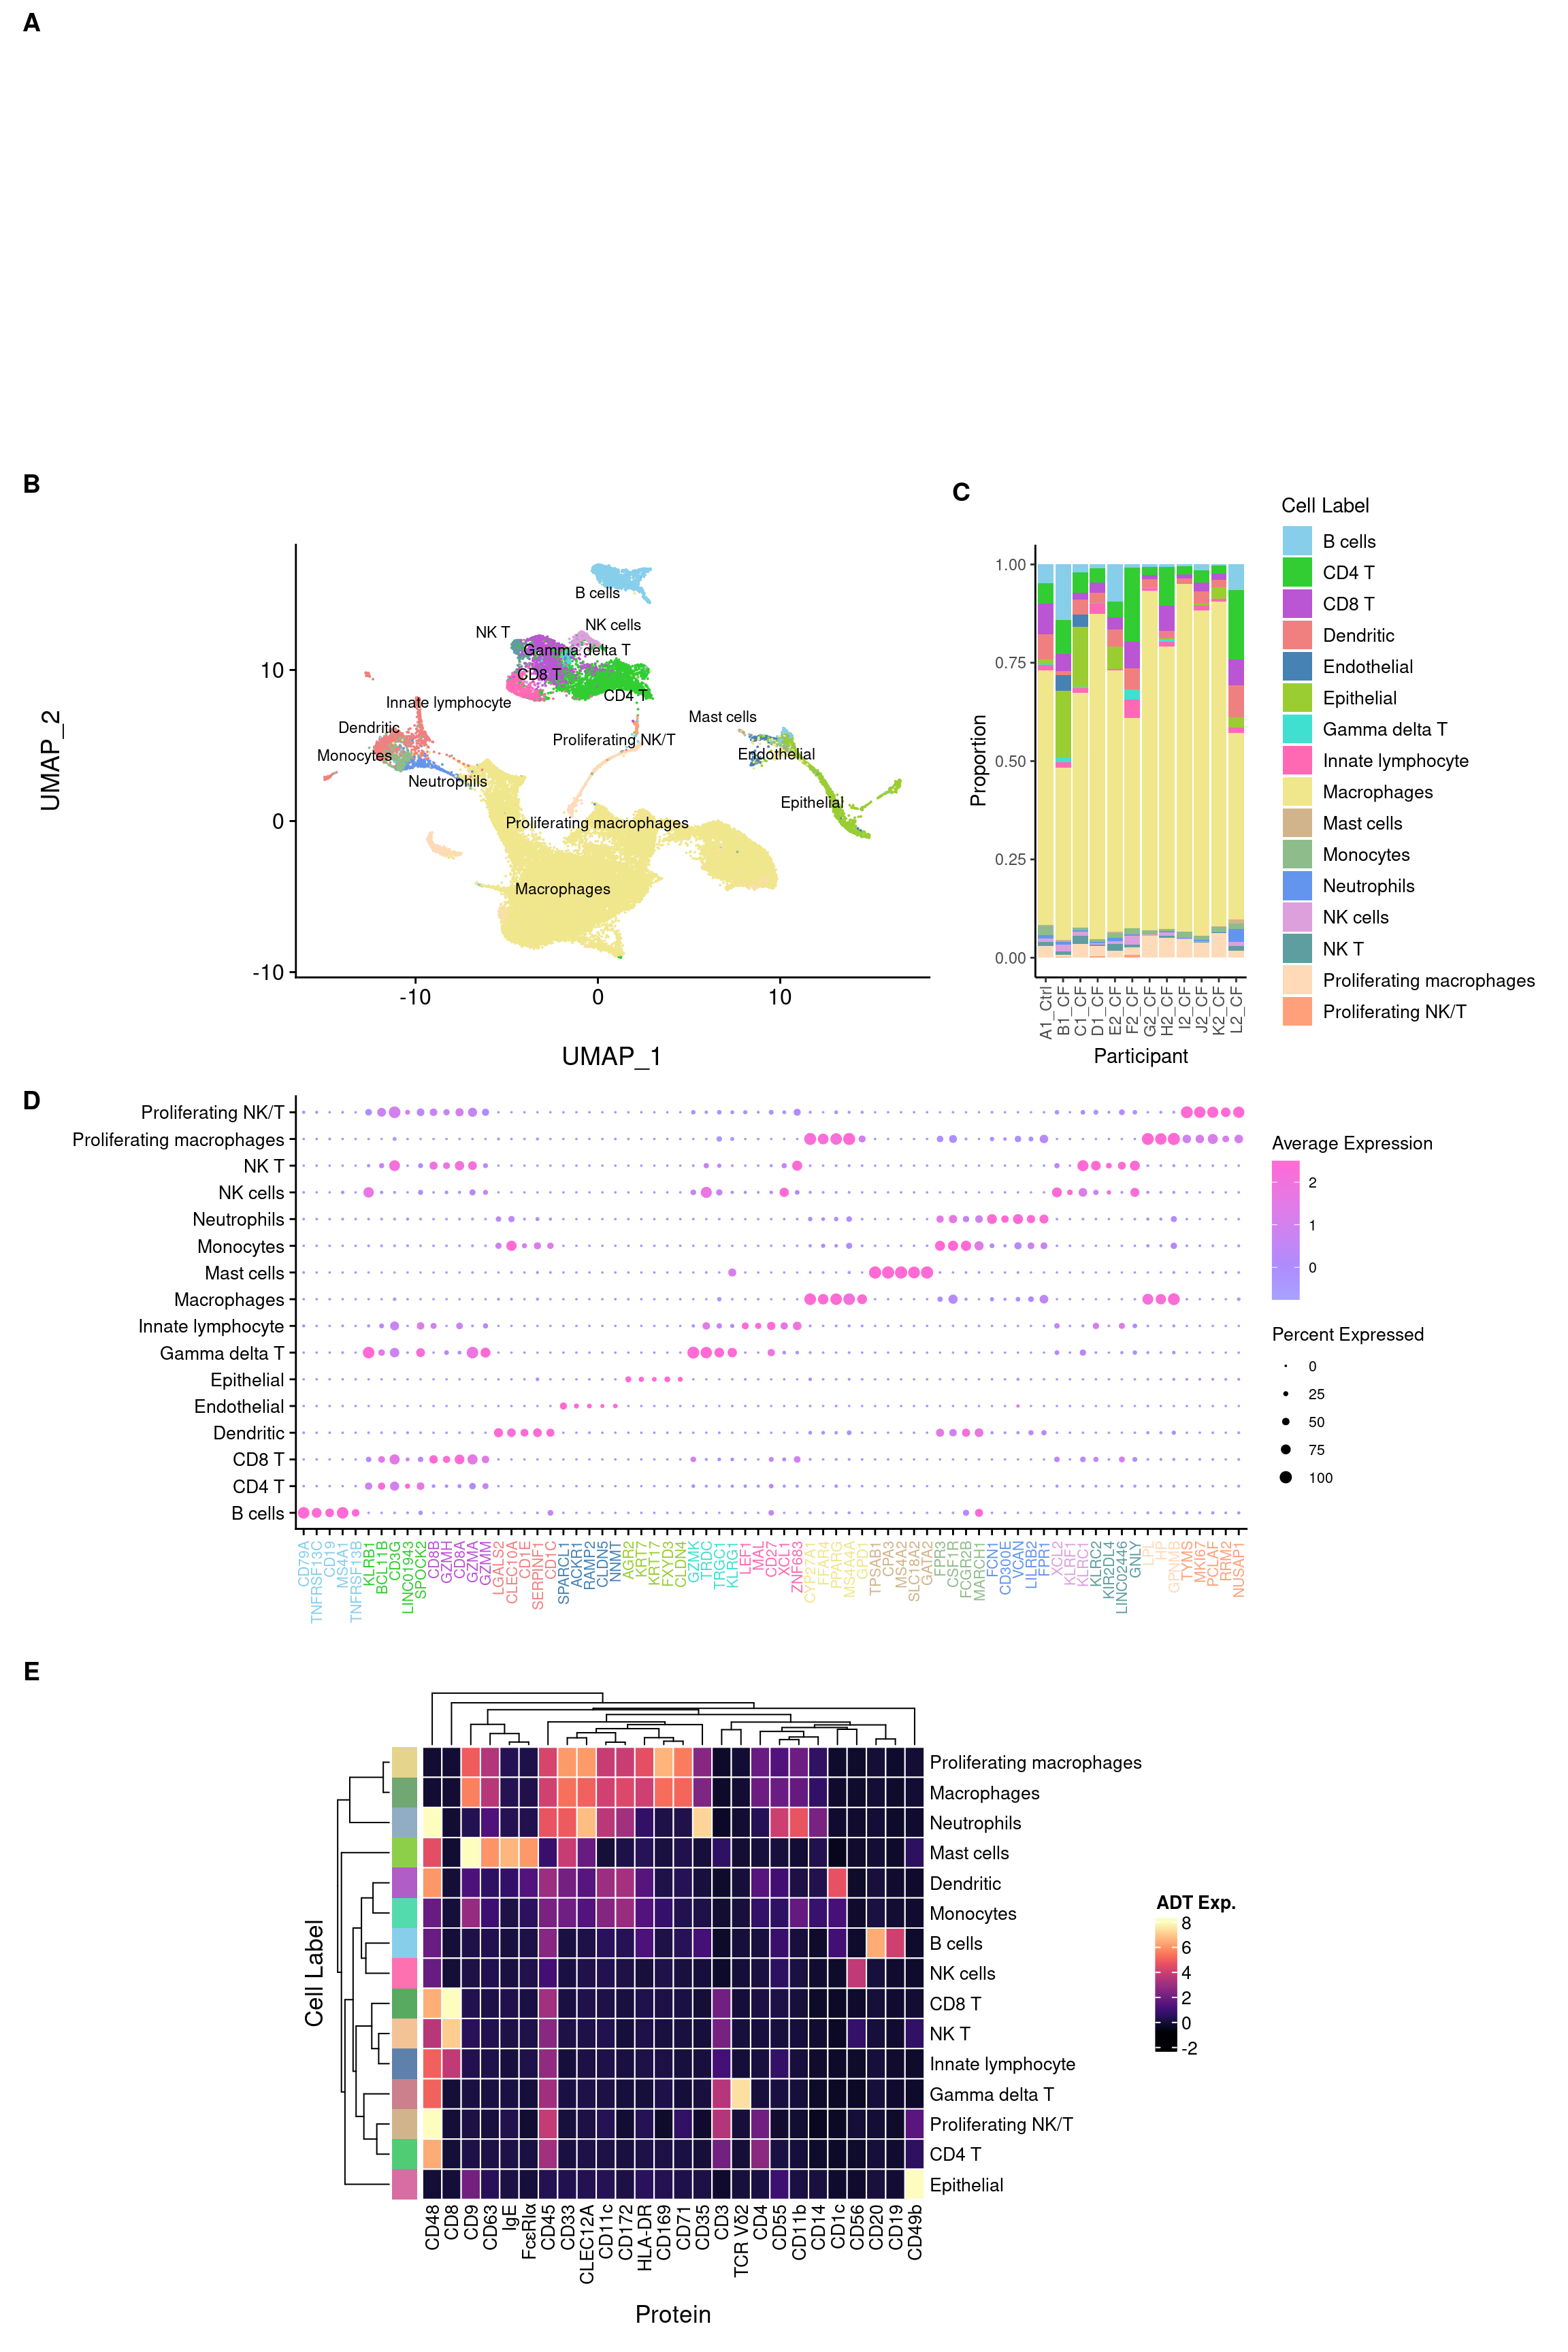
| Version | Author | Date |
|---|---|---|
| 2983a22 | Jovana Maksimovic | 2022-12-19 |
8 Session info
sessioninfo::session_info()─ Session info ───────────────────────────────────────────────────────────────
setting value
version R version 4.1.0 (2021-05-18)
os CentOS Linux 7 (Core)
system x86_64, linux-gnu
ui X11
language (EN)
collate en_AU.UTF-8
ctype en_AU.UTF-8
tz Australia/Melbourne
date 2022-12-20
pandoc 2.17.1.1 @ /usr/lib/rstudio-server/bin/quarto/bin/ (via rmarkdown)
─ Packages ───────────────────────────────────────────────────────────────────
! package * version date (UTC) lib source
P abind 1.4-5 2016-07-21 [?] CRAN (R 4.1.0)
P annotate * 1.72.0 2021-10-26 [?] Bioconductor
P AnnotationDbi * 1.56.2 2021-11-09 [?] Bioconductor
P assertthat 0.2.1 2019-03-21 [?] CRAN (R 4.1.0)
P backports 1.4.1 2021-12-13 [?] CRAN (R 4.1.0)
P beachmat 2.10.0 2021-10-26 [?] Bioconductor
P Biobase * 2.54.0 2021-10-26 [?] Bioconductor
P BiocGenerics * 0.40.0 2021-10-26 [?] Bioconductor
P BiocManager 1.30.16 2021-06-15 [?] CRAN (R 4.1.0)
P BiocParallel * 1.28.3 2021-12-09 [?] Bioconductor
P BiocStyle * 2.22.0 2021-10-26 [?] Bioconductor
P Biostrings 2.62.0 2021-10-26 [?] Bioconductor
P bit 4.0.4 2020-08-04 [?] CRAN (R 4.1.0)
P bit64 4.0.5 2020-08-30 [?] CRAN (R 4.0.2)
P bitops 1.0-7 2021-04-24 [?] CRAN (R 4.0.2)
P blob 1.2.2 2021-07-23 [?] CRAN (R 4.1.0)
P bookdown 0.24 2021-09-02 [?] CRAN (R 4.1.0)
P broom 0.7.11 2022-01-03 [?] CRAN (R 4.1.0)
P bslib 0.3.1 2021-10-06 [?] CRAN (R 4.1.0)
P cachem 1.0.6 2021-08-19 [?] CRAN (R 4.1.0)
P callr 3.7.0 2021-04-20 [?] CRAN (R 4.1.0)
P cellranger 1.1.0 2016-07-27 [?] CRAN (R 4.1.0)
P Cepo * 1.0.0 2021-10-26 [?] Bioconductor
P circlize 0.4.13 2021-06-09 [?] CRAN (R 4.1.0)
P cli 3.1.0 2021-10-27 [?] CRAN (R 4.1.0)
P clue 0.3-60 2021-10-11 [?] CRAN (R 4.1.0)
P cluster 2.1.2 2021-04-17 [?] CRAN (R 4.1.0)
P codetools 0.2-18 2020-11-04 [?] CRAN (R 4.1.0)
P colorspace 2.0-2 2021-06-24 [?] CRAN (R 4.0.2)
P ComplexHeatmap 2.10.0 2021-10-26 [?] Bioconductor
P cowplot 1.1.1 2020-12-30 [?] CRAN (R 4.0.2)
P crayon 1.4.2 2021-10-29 [?] CRAN (R 4.1.0)
P data.table 1.14.2 2021-09-27 [?] CRAN (R 4.1.0)
P DBI 1.1.2 2021-12-20 [?] CRAN (R 4.1.0)
P dbplyr 2.1.1 2021-04-06 [?] CRAN (R 4.1.0)
P DelayedArray 0.20.0 2021-10-26 [?] Bioconductor
P DelayedMatrixStats 1.16.0 2021-10-26 [?] Bioconductor
P deldir 1.0-6 2021-10-23 [?] CRAN (R 4.1.0)
P dendextend 1.15.2 2021-10-28 [?] CRAN (R 4.1.0)
P digest 0.6.29 2021-12-01 [?] CRAN (R 4.1.0)
P doParallel 1.0.16 2020-10-16 [?] CRAN (R 4.0.2)
P dplyr * 1.0.7 2021-06-18 [?] CRAN (R 4.1.0)
P edgeR 3.36.0 2021-10-26 [?] Bioconductor
P ellipsis 0.3.2 2021-04-29 [?] CRAN (R 4.0.2)
P evaluate 0.14 2019-05-28 [?] CRAN (R 4.0.2)
P fansi 1.0.0 2022-01-10 [?] CRAN (R 4.1.0)
P farver 2.1.0 2021-02-28 [?] CRAN (R 4.0.2)
P fastmap 1.1.0 2021-01-25 [?] CRAN (R 4.1.0)
P fitdistrplus 1.1-6 2021-09-28 [?] CRAN (R 4.1.0)
P forcats * 0.5.1 2021-01-27 [?] CRAN (R 4.1.0)
P foreach 1.5.1 2020-10-15 [?] CRAN (R 4.0.2)
P fs 1.5.2 2021-12-08 [?] CRAN (R 4.1.0)
P future 1.23.0 2021-10-31 [?] CRAN (R 4.1.0)
P future.apply 1.8.1 2021-08-10 [?] CRAN (R 4.1.0)
P generics 0.1.1 2021-10-25 [?] CRAN (R 4.1.0)
GenomeInfoDb 1.30.1 2022-01-30 [1] Bioconductor
P GenomeInfoDbData 1.2.7 2021-12-21 [?] Bioconductor
P GenomicRanges 1.46.1 2021-11-18 [?] Bioconductor
P GetoptLong 1.0.5 2020-12-15 [?] CRAN (R 4.0.2)
P getPass 0.2-2 2017-07-21 [?] CRAN (R 4.0.2)
P ggplot2 * 3.3.5 2021-06-25 [?] CRAN (R 4.0.2)
P ggrepel 0.9.1 2021-01-15 [?] CRAN (R 4.1.0)
P ggridges 0.5.3 2021-01-08 [?] CRAN (R 4.1.0)
P git2r 0.29.0 2021-11-22 [?] CRAN (R 4.1.0)
P glmGamPoi * 1.6.0 2021-10-26 [?] Bioconductor
P GlobalOptions 0.1.2 2020-06-10 [?] CRAN (R 4.1.0)
P globals 0.14.0 2020-11-22 [?] CRAN (R 4.0.2)
P glue * 1.6.0 2021-12-17 [?] CRAN (R 4.1.0)
P goftest 1.2-3 2021-10-07 [?] CRAN (R 4.1.0)
P graph * 1.72.0 2021-10-26 [?] Bioconductor
P gridExtra 2.3 2017-09-09 [?] CRAN (R 4.1.0)
P GSEABase * 1.56.0 2021-10-26 [?] Bioconductor
P gtable 0.3.0 2019-03-25 [?] CRAN (R 4.1.0)
P haven 2.4.3 2021-08-04 [?] CRAN (R 4.1.0)
P HDF5Array 1.22.1 2021-11-14 [?] Bioconductor
P here * 1.0.1 2020-12-13 [?] CRAN (R 4.0.2)
P highr 0.9 2021-04-16 [?] CRAN (R 4.1.0)
P hms 1.1.1 2021-09-26 [?] CRAN (R 4.1.0)
P htmltools 0.5.2 2021-08-25 [?] CRAN (R 4.1.0)
P htmlwidgets 1.5.4 2021-09-08 [?] CRAN (R 4.1.0)
P httpuv 1.6.5 2022-01-05 [?] CRAN (R 4.1.0)
P httr 1.4.2 2020-07-20 [?] CRAN (R 4.1.0)
P ica 1.0-2 2018-05-24 [?] CRAN (R 4.1.0)
P igraph 1.2.11 2022-01-04 [?] CRAN (R 4.1.0)
P IRanges * 2.28.0 2021-10-26 [?] Bioconductor
P irlba 2.3.5 2021-12-06 [?] CRAN (R 4.1.0)
P iterators 1.0.13 2020-10-15 [?] CRAN (R 4.0.2)
P jquerylib 0.1.4 2021-04-26 [?] CRAN (R 4.1.0)
P jsonlite 1.7.2 2020-12-09 [?] CRAN (R 4.0.2)
P KEGGREST 1.34.0 2021-10-26 [?] Bioconductor
P KernSmooth 2.23-20 2021-05-03 [?] CRAN (R 4.1.0)
P knitr 1.37 2021-12-16 [?] CRAN (R 4.1.0)
P labeling 0.4.2 2020-10-20 [?] CRAN (R 4.0.2)
P later 1.3.0 2021-08-18 [?] CRAN (R 4.1.0)
P lattice 0.20-45 2021-09-22 [?] CRAN (R 4.1.0)
P lazyeval 0.2.2 2019-03-15 [?] CRAN (R 4.1.0)
P leiden 0.3.9 2021-07-27 [?] CRAN (R 4.1.0)
P lifecycle 1.0.1 2021-09-24 [?] CRAN (R 4.1.0)
P limma * 3.50.0 2021-10-26 [?] Bioconductor
P listenv 0.8.0 2019-12-05 [?] CRAN (R 4.1.0)
P lmtest 0.9-39 2021-11-07 [?] CRAN (R 4.1.0)
P locfit 1.5-9.4 2020-03-25 [?] CRAN (R 4.1.0)
P lubridate 1.8.0 2021-10-07 [?] CRAN (R 4.1.0)
P magrittr 2.0.1 2020-11-17 [?] CRAN (R 4.0.2)
P MASS 7.3-53.1 2021-02-12 [?] CRAN (R 4.0.2)
P Matrix 1.4-0 2021-12-08 [?] CRAN (R 4.1.0)
P MatrixGenerics 1.6.0 2021-10-26 [?] Bioconductor
P matrixStats 0.61.0 2021-09-17 [?] CRAN (R 4.1.0)
P memoise 2.0.1 2021-11-26 [?] CRAN (R 4.1.0)
P mgcv 1.8-38 2021-10-06 [?] CRAN (R 4.1.0)
P mime 0.12 2021-09-28 [?] CRAN (R 4.1.0)
P miniUI 0.1.1.1 2018-05-18 [?] CRAN (R 4.1.0)
P modelr 0.1.8 2020-05-19 [?] CRAN (R 4.0.2)
P munsell 0.5.0 2018-06-12 [?] CRAN (R 4.1.0)
P nlme 3.1-153 2021-09-07 [?] CRAN (R 4.1.0)
P org.Hs.eg.db 3.14.0 2021-12-21 [?] Bioconductor
P org.Mm.eg.db 3.14.0 2022-01-24 [?] Bioconductor
P paletteer * 1.4.0 2021-07-20 [?] CRAN (R 4.1.0)
P parallelly 1.30.0 2021-12-17 [?] CRAN (R 4.1.0)
P patchwork * 1.1.1 2020-12-17 [?] CRAN (R 4.0.2)
P pbapply 1.5-0 2021-09-16 [?] CRAN (R 4.1.0)
P pillar 1.6.4 2021-10-18 [?] CRAN (R 4.1.0)
P pkgconfig 2.0.3 2019-09-22 [?] CRAN (R 4.1.0)
P plotly 4.10.0 2021-10-09 [?] CRAN (R 4.1.0)
P plyr 1.8.6 2020-03-03 [?] CRAN (R 4.0.2)
P png 0.1-7 2013-12-03 [?] CRAN (R 4.1.0)
P polyclip 1.10-0 2019-03-14 [?] CRAN (R 4.1.0)
P prismatic 1.1.0 2021-10-17 [?] CRAN (R 4.1.0)
P processx 3.5.2 2021-04-30 [?] CRAN (R 4.1.0)
P promises 1.2.0.1 2021-02-11 [?] CRAN (R 4.0.2)
P ps 1.6.0 2021-02-28 [?] CRAN (R 4.1.0)
P purrr * 0.3.4 2020-04-17 [?] CRAN (R 4.0.2)
P R6 2.5.1 2021-08-19 [?] CRAN (R 4.1.0)
P RANN 2.6.1 2019-01-08 [?] CRAN (R 4.1.0)
P RColorBrewer 1.1-2 2014-12-07 [?] CRAN (R 4.0.2)
P Rcpp 1.0.7 2021-07-07 [?] CRAN (R 4.1.0)
P RcppAnnoy 0.0.19 2021-07-30 [?] CRAN (R 4.1.0)
RCurl 1.98-1.6 2022-02-08 [1] CRAN (R 4.1.0)
P readr * 2.1.1 2021-11-30 [?] CRAN (R 4.1.0)
P readxl 1.3.1 2019-03-13 [?] CRAN (R 4.1.0)
P rematch2 2.1.2 2020-05-01 [?] CRAN (R 4.1.0)
P renv 0.15.0-14 2022-01-10 [?] Github (rstudio/renv@a3b90eb)
P reprex 2.0.1 2021-08-05 [?] CRAN (R 4.1.0)
P reshape2 1.4.4 2020-04-09 [?] CRAN (R 4.1.0)
P reticulate 1.22 2021-09-17 [?] CRAN (R 4.1.0)
P rhdf5 2.38.0 2021-10-26 [?] Bioconductor
P rhdf5filters 1.6.0 2021-10-26 [?] Bioconductor
P Rhdf5lib 1.16.0 2021-10-26 [?] Bioconductor
P rjson 0.2.21 2022-01-09 [?] CRAN (R 4.1.0)
P rlang 0.4.12 2021-10-18 [?] CRAN (R 4.1.0)
P rmarkdown 2.11 2021-09-14 [?] CRAN (R 4.1.0)
P ROCR 1.0-11 2020-05-02 [?] CRAN (R 4.1.0)
P rpart 4.1-15 2019-04-12 [?] CRAN (R 4.1.0)
P rprojroot 2.0.2 2020-11-15 [?] CRAN (R 4.0.2)
P RSpectra 0.16-0 2019-12-01 [?] CRAN (R 4.1.0)
P RSQLite 2.2.9 2021-12-06 [?] CRAN (R 4.1.0)
P rstudioapi 0.13 2020-11-12 [?] CRAN (R 4.0.2)
P Rtsne 0.15 2018-11-10 [?] CRAN (R 4.1.0)
P rvest 1.0.2 2021-10-16 [?] CRAN (R 4.1.0)
P S4Vectors * 0.32.3 2021-11-21 [?] Bioconductor
P sass 0.4.0 2021-05-12 [?] CRAN (R 4.1.0)
P scales 1.1.1 2020-05-11 [?] CRAN (R 4.0.2)
P scattermore 0.7 2020-11-24 [?] CRAN (R 4.1.0)
P sctransform 0.3.3 2022-01-13 [?] CRAN (R 4.1.0)
P scuttle 1.4.0 2021-10-26 [?] Bioconductor
P sessioninfo 1.2.2 2021-12-06 [?] CRAN (R 4.1.0)
P Seurat * 4.0.6 2021-12-16 [?] CRAN (R 4.1.0)
P SeuratObject * 4.0.4 2021-11-23 [?] CRAN (R 4.1.0)
P shape 1.4.6 2021-05-19 [?] CRAN (R 4.1.0)
P shiny 1.7.1 2021-10-02 [?] CRAN (R 4.1.0)
P SingleCellExperiment 1.16.0 2021-10-26 [?] Bioconductor
P sparseMatrixStats 1.6.0 2021-10-26 [?] Bioconductor
P spatstat.core 2.3-2 2021-11-26 [?] CRAN (R 4.1.0)
P spatstat.data 2.1-2 2021-12-17 [?] CRAN (R 4.1.0)
P spatstat.geom 2.3-1 2021-12-10 [?] CRAN (R 4.1.0)
P spatstat.sparse 2.1-0 2021-12-17 [?] CRAN (R 4.1.0)
P spatstat.utils 2.3-0 2021-12-12 [?] CRAN (R 4.1.0)
P speckle * 0.0.3 2022-03-09 [?] Github (Oshlack/speckle@fc07773)
P stringi 1.7.6 2021-11-29 [?] CRAN (R 4.1.0)
P stringr * 1.4.0 2019-02-10 [?] CRAN (R 4.0.2)
P SummarizedExperiment 1.24.0 2021-10-26 [?] Bioconductor
P survival 3.2-13 2021-08-24 [?] CRAN (R 4.1.0)
P tensor 1.5 2012-05-05 [?] CRAN (R 4.1.0)
P tibble * 3.1.6 2021-11-07 [?] CRAN (R 4.1.0)
P tidyHeatmap * 1.7.0 2022-05-13 [?] Github (stemangiola/tidyHeatmap@241aec2)
P tidyr * 1.1.4 2021-09-27 [?] CRAN (R 4.1.0)
P tidyselect 1.1.1 2021-04-30 [?] CRAN (R 4.1.0)
P tidyverse * 1.3.1 2021-04-15 [?] CRAN (R 4.1.0)
P tzdb 0.2.0 2021-10-27 [?] CRAN (R 4.1.0)
P utf8 1.2.2 2021-07-24 [?] CRAN (R 4.1.0)
P uwot 0.1.11 2021-12-02 [?] CRAN (R 4.1.0)
P vctrs 0.3.8 2021-04-29 [?] CRAN (R 4.0.2)
P viridis 0.6.2 2021-10-13 [?] CRAN (R 4.1.0)
P viridisLite 0.4.0 2021-04-13 [?] CRAN (R 4.0.2)
P vroom 1.5.7 2021-11-30 [?] CRAN (R 4.1.0)
P whisker 0.4 2019-08-28 [?] CRAN (R 4.0.2)
P withr 2.4.3 2021-11-30 [?] CRAN (R 4.1.0)
P workflowr * 1.7.0 2021-12-21 [?] CRAN (R 4.1.0)
P xfun 0.29 2021-12-14 [?] CRAN (R 4.1.0)
P XML * 3.99-0.8 2021-09-17 [?] CRAN (R 4.1.0)
P xml2 1.3.3 2021-11-30 [?] CRAN (R 4.1.0)
P xtable 1.8-4 2019-04-21 [?] CRAN (R 4.1.0)
P XVector 0.34.0 2021-10-26 [?] Bioconductor
P yaml 2.2.1 2020-02-01 [?] CRAN (R 4.0.2)
P zlibbioc 1.40.0 2021-10-26 [?] Bioconductor
P zoo 1.8-9 2021-03-09 [?] CRAN (R 4.1.0)
[1] /oshlack_lab/jovana.maksimovic/projects/MCRI/melanie.neeland/paed-cf-cite-seq/renv/library/R-4.1/x86_64-pc-linux-gnu
[2] /config/binaries/R/4.1.0/lib64/R/library
P ── Loaded and on-disk path mismatch.
──────────────────────────────────────────────────────────────────────────────
sessionInfo()R version 4.1.0 (2021-05-18)
Platform: x86_64-pc-linux-gnu (64-bit)
Running under: CentOS Linux 7 (Core)
Matrix products: default
BLAS: /config/binaries/R/4.1.0/lib64/R/lib/libRblas.so
LAPACK: /config/binaries/R/4.1.0/lib64/R/lib/libRlapack.so
locale:
[1] LC_CTYPE=en_AU.UTF-8 LC_NUMERIC=C
[3] LC_TIME=en_AU.UTF-8 LC_COLLATE=en_AU.UTF-8
[5] LC_MONETARY=en_AU.UTF-8 LC_MESSAGES=en_AU.UTF-8
[7] LC_PAPER=en_AU.UTF-8 LC_NAME=C
[9] LC_ADDRESS=C LC_TELEPHONE=C
[11] LC_MEASUREMENT=en_AU.UTF-8 LC_IDENTIFICATION=C
attached base packages:
[1] stats4 stats graphics grDevices datasets utils methods
[8] base
other attached packages:
[1] limma_3.50.0 BiocParallel_1.28.3 glmGamPoi_1.6.0
[4] Cepo_1.0.0 GSEABase_1.56.0 graph_1.72.0
[7] annotate_1.72.0 XML_3.99-0.8 AnnotationDbi_1.56.2
[10] IRanges_2.28.0 S4Vectors_0.32.3 Biobase_2.54.0
[13] BiocGenerics_0.40.0 speckle_0.0.3 tidyHeatmap_1.7.0
[16] paletteer_1.4.0 patchwork_1.1.1 SeuratObject_4.0.4
[19] Seurat_4.0.6 glue_1.6.0 here_1.0.1
[22] forcats_0.5.1 stringr_1.4.0 dplyr_1.0.7
[25] purrr_0.3.4 readr_2.1.1 tidyr_1.1.4
[28] tibble_3.1.6 ggplot2_3.3.5 tidyverse_1.3.1
[31] BiocStyle_2.22.0 workflowr_1.7.0
loaded via a namespace (and not attached):
[1] scattermore_0.7 bit64_4.0.5
[3] knitr_1.37 irlba_2.3.5
[5] DelayedArray_0.20.0 data.table_1.14.2
[7] rpart_4.1-15 KEGGREST_1.34.0
[9] RCurl_1.98-1.6 doParallel_1.0.16
[11] generics_0.1.1 org.Mm.eg.db_3.14.0
[13] callr_3.7.0 cowplot_1.1.1
[15] RSQLite_2.2.9 RANN_2.6.1
[17] future_1.23.0 bit_4.0.4
[19] tzdb_0.2.0 spatstat.data_2.1-2
[21] xml2_1.3.3 lubridate_1.8.0
[23] httpuv_1.6.5 SummarizedExperiment_1.24.0
[25] assertthat_0.2.1 viridis_0.6.2
[27] xfun_0.29 hms_1.1.1
[29] jquerylib_0.1.4 evaluate_0.14
[31] promises_1.2.0.1 fansi_1.0.0
[33] dendextend_1.15.2 dbplyr_2.1.1
[35] readxl_1.3.1 igraph_1.2.11
[37] DBI_1.1.2 htmlwidgets_1.5.4
[39] spatstat.geom_2.3-1 ellipsis_0.3.2
[41] RSpectra_0.16-0 backports_1.4.1
[43] bookdown_0.24 prismatic_1.1.0
[45] deldir_1.0-6 sparseMatrixStats_1.6.0
[47] MatrixGenerics_1.6.0 vctrs_0.3.8
[49] SingleCellExperiment_1.16.0 ROCR_1.0-11
[51] abind_1.4-5 cachem_1.0.6
[53] withr_2.4.3 vroom_1.5.7
[55] sctransform_0.3.3 goftest_1.2-3
[57] cluster_2.1.2 lazyeval_0.2.2
[59] crayon_1.4.2 labeling_0.4.2
[61] edgeR_3.36.0 pkgconfig_2.0.3
[63] GenomeInfoDb_1.30.1 nlme_3.1-153
[65] rlang_0.4.12 globals_0.14.0
[67] lifecycle_1.0.1 miniUI_0.1.1.1
[69] modelr_0.1.8 cellranger_1.1.0
[71] rprojroot_2.0.2 polyclip_1.10-0
[73] matrixStats_0.61.0 lmtest_0.9-39
[75] Matrix_1.4-0 Rhdf5lib_1.16.0
[77] zoo_1.8-9 reprex_2.0.1
[79] whisker_0.4 ggridges_0.5.3
[81] GlobalOptions_0.1.2 processx_3.5.2
[83] png_0.1-7 viridisLite_0.4.0
[85] rjson_0.2.21 bitops_1.0-7
[87] getPass_0.2-2 KernSmooth_2.23-20
[89] rhdf5filters_1.6.0 Biostrings_2.62.0
[91] blob_1.2.2 DelayedMatrixStats_1.16.0
[93] shape_1.4.6 parallelly_1.30.0
[95] beachmat_2.10.0 scales_1.1.1
[97] memoise_2.0.1 magrittr_2.0.1
[99] plyr_1.8.6 ica_1.0-2
[101] zlibbioc_1.40.0 compiler_4.1.0
[103] RColorBrewer_1.1-2 clue_0.3-60
[105] fitdistrplus_1.1-6 cli_3.1.0
[107] XVector_0.34.0 listenv_0.8.0
[109] pbapply_1.5-0 ps_1.6.0
[111] MASS_7.3-53.1 mgcv_1.8-38
[113] tidyselect_1.1.1 stringi_1.7.6
[115] highr_0.9 yaml_2.2.1
[117] locfit_1.5-9.4 ggrepel_0.9.1
[119] grid_4.1.0 sass_0.4.0
[121] tools_4.1.0 future.apply_1.8.1
[123] parallel_4.1.0 circlize_0.4.13
[125] rstudioapi_0.13 foreach_1.5.1
[127] git2r_0.29.0 gridExtra_2.3
[129] farver_2.1.0 Rtsne_0.15
[131] digest_0.6.29 BiocManager_1.30.16
[133] shiny_1.7.1 Rcpp_1.0.7
[135] GenomicRanges_1.46.1 broom_0.7.11
[137] scuttle_1.4.0 later_1.3.0
[139] RcppAnnoy_0.0.19 org.Hs.eg.db_3.14.0
[141] httr_1.4.2 ComplexHeatmap_2.10.0
[143] colorspace_2.0-2 rvest_1.0.2
[145] fs_1.5.2 tensor_1.5
[147] reticulate_1.22 splines_4.1.0
[149] uwot_0.1.11 rematch2_2.1.2
[151] spatstat.utils_2.3-0 renv_0.15.0-14
[153] sessioninfo_1.2.2 plotly_4.10.0
[155] xtable_1.8-4 jsonlite_1.7.2
[157] R6_2.5.1 pillar_1.6.4
[159] htmltools_0.5.2 mime_0.12
[161] fastmap_1.1.0 codetools_0.2-18
[163] utf8_1.2.2 lattice_0.20-45
[165] bslib_0.3.1 spatstat.sparse_2.1-0
[167] leiden_0.3.9 survival_3.2-13
[169] rmarkdown_2.11 munsell_0.5.0
[171] GetoptLong_1.0.5 rhdf5_2.38.0
[173] GenomeInfoDbData_1.2.7 iterators_1.0.13
[175] HDF5Array_1.22.1 haven_2.4.3
[177] reshape2_1.4.4 gtable_0.3.0
[179] spatstat.core_2.3-2