Annotate Other Cells clusters
Jovana Maksimovic
September 10, 2024
Last updated: 2024-09-10
Checks: 7 0
Knit directory: paed-inflammation-CITEseq/
This reproducible R Markdown analysis was created with workflowr (version 1.7.1). The Checks tab describes the reproducibility checks that were applied when the results were created. The Past versions tab lists the development history.
Great! Since the R Markdown file has been committed to the Git repository, you know the exact version of the code that produced these results.
Great job! The global environment was empty. Objects defined in the global environment can affect the analysis in your R Markdown file in unknown ways. For reproduciblity it’s best to always run the code in an empty environment.
The command set.seed(20240216) was run prior to running
the code in the R Markdown file. Setting a seed ensures that any results
that rely on randomness, e.g. subsampling or permutations, are
reproducible.
Great job! Recording the operating system, R version, and package versions is critical for reproducibility.
Nice! There were no cached chunks for this analysis, so you can be confident that you successfully produced the results during this run.
Great job! Using relative paths to the files within your workflowr project makes it easier to run your code on other machines.
Great! You are using Git for version control. Tracking code development and connecting the code version to the results is critical for reproducibility.
The results in this page were generated with repository version 22d1806. See the Past versions tab to see a history of the changes made to the R Markdown and HTML files.
Note that you need to be careful to ensure that all relevant files for
the analysis have been committed to Git prior to generating the results
(you can use wflow_publish or
wflow_git_commit). workflowr only checks the R Markdown
file, but you know if there are other scripts or data files that it
depends on. Below is the status of the Git repository when the results
were generated:
Ignored files:
    Ignored:    .Rhistory
    Ignored:    .Rproj.user/
    Ignored:    data/C133_Neeland_batch1/
    Ignored:    data/C133_Neeland_merged/
    Ignored:    renv/library/
    Ignored:    renv/staging/

Untracked files:
    Untracked:  analysis/13.0_DGE_analysis_macro-alveolar_cells_CF-only-samples_OLD.Rmd
    Untracked:  analysis/13.1_DGE_analysis_macro-alveolar_cells_CF-vs-control-samples_OLD.Rmd
    Untracked:  analysis/13.3_DGE_analysis_macro-monocyte-derived_CF-only-samples_OLD.Rmd
    Untracked:  analysis/13.4_DGE_analysis_macro-monocyte-derived_CF-vs-control-samples_OLD.Rmd
    Untracked:  analysis/15.0_integrate_all_cells.Rmd

Unstaged changes:
    Modified:   analysis/09.0_integrate_cluster_macro_cells.Rmd
    Deleted:    analysis/14.0_proportions_analysis_broad.Rmd
    Deleted:    analysis/14.1_proportions_analysis_fine.Rmd
    Deleted:    analysis/14.2_proportions_analysis_macrophages.Rmd
    Modified:   analysis/index.Rmd
    Modified:   data/cluster_annotations/T-NK_ambientRNAremoval_21.03.24.xlsx
    Modified:   data/cluster_annotations/others_ambientRNAremoval_21.03.24.xlsx
    Modified:   data/cluster_annotations/seurat_markers_TNK_cells.rds
    Modified:   data/cluster_annotations/seurat_markers_other_cells.rds
Note that any generated files, e.g. HTML, png, CSS, etc., are not included in this status report because it is ok for generated content to have uncommitted changes.
These are the previous versions of the repository in which changes were
made to the R Markdown
(analysis/12.0_manual_annotations_other_cells.Rmd) and HTML
(docs/12.0_manual_annotations_other_cells.html) files. If
you’ve configured a remote Git repository (see
?wflow_git_remote), click on the hyperlinks in the table
below to view the files as they were in that past version.
| File | Version | Author | Date | Message |
|---|---|---|---|---|
| Rmd | 22d1806 | Jovana Maksimovic | 2024-09-10 | wflow_publish("analysis/12.0_manual_annotations_other_cells.Rmd") |
| html | 0b24220 | Jovana Maksimovic | 2024-07-05 | Build site. |
| Rmd | 256e8cf | Jovana Maksimovic | 2024-07-05 | wflow_publish(c("analysis/index.Rmd", "analysis/12.0_manual_annotations_other_cells.Rmd")) |
Load libraries
Load Data
ambient <- "_decontx"
out <- here("data",
            "C133_Neeland_merged",
            glue("C133_Neeland_full_clean{ambient}_integrated_clustered_mapped_other_cells.ADT.SEU.rds"))
seuInt <- readRDS(file = out)

seuInt
An object of class Seurat
41729 features across 13687 samples within 4 assays
Active assay: integrated (3000 features, 0 variable features)
3 other assays present: RNA, ADT, SCT
2 dimensional reductions calculated: pca, umapUpdate group labels
seuInt@meta.data %>%
  data.frame %>%
  mutate(Group = ifelse(str_detect(Treatment, "ivacaftor"),
                        "CF.IVA",
                        ifelse(str_detect(Treatment, "orkambi"),
                               "CF.LUMA_IVA",
                               ifelse(Treatment == "untreated",
                                      "CF.NO_MOD",
                                      "NON_CF.CTRL"))),
         Group_severity = ifelse(!Group %in% "NON_CF.CTRL",
                                 paste(Group,
                                       toupper(substr(Severity, 1, 1)),
                                       sep = "."),
                                 Group),
         Severity = tolower(Severity),
         Participant = strsplit2(sample.id, ".", fixed = TRUE)[,1]) -> seuInt@meta.data
Sub-cluster labelling
Load manual annotations
labels <- read_excel(here("data",
                          "cluster_annotations",
                          "others_ambientRNAremoval_21.03.24.xlsx"),
                     skip = 1)


# set selected cluster resolution
grp <- "wsnn_res.0.6"
seuInt@meta.data %>%
  rownames_to_column(var = "cell") %>%
  left_join(labels %>%
              mutate(Cluster = as.factor(Cluster),
                     ann_level_3 = as.factor(ann_level_3),
                     ann_level_2 = as.factor(ann_level_2),
                     ann_level_1 = as.factor(ann_level_1)),
            by = c("wsnn_res.0.6" = "Cluster")) %>%
  column_to_rownames(var = "cell") -> seuInt@meta.data

seuInt <- subset(seuInt, cells = which(seuInt$ann_level_3 != "unknown"))
seuInt$ann_level_3 <- fct_drop(seuInt$ann_level_3)
seuInt$ann_level_2 <- fct_drop(seuInt$ann_level_2)
seuInt$ann_level_1 <- fct_drop(seuInt$ann_level_1)
seuInt
An object of class Seurat
41729 features across 13687 samples within 4 assays
Active assay: integrated (3000 features, 0 variable features)
3 other assays present: RNA, ADT, SCT
2 dimensional reductions calculated: pca, umapVisualise annotations
options(ggrepel.max.overlaps = Inf)
DimPlot(seuInt, reduction = 'umap', label = TRUE, repel = TRUE,
        label.size = 3, group.by = grp) +
  NoLegend() -> p1

cluster_pal <- "ggsci::category20_d3"
DimPlot(seuInt, reduction = 'umap', label = FALSE, group.by = "ann_level_1") +
  scale_color_paletteer_d(cluster_pal) +
  theme(text = element_text(size = 9),
        axis.text = element_blank(),
        axis.ticks = element_blank()) +
  NoLegend() -> p2

DimPlot(seuInt, reduction = 'umap', label = FALSE, group.by = "ann_level_3") +
  scale_color_paletteer_d(cluster_pal) +
  theme(text = element_text(size = 9),
        axis.text = element_blank(),
        axis.ticks = element_blank()) +
  NoLegend() -> p3

p1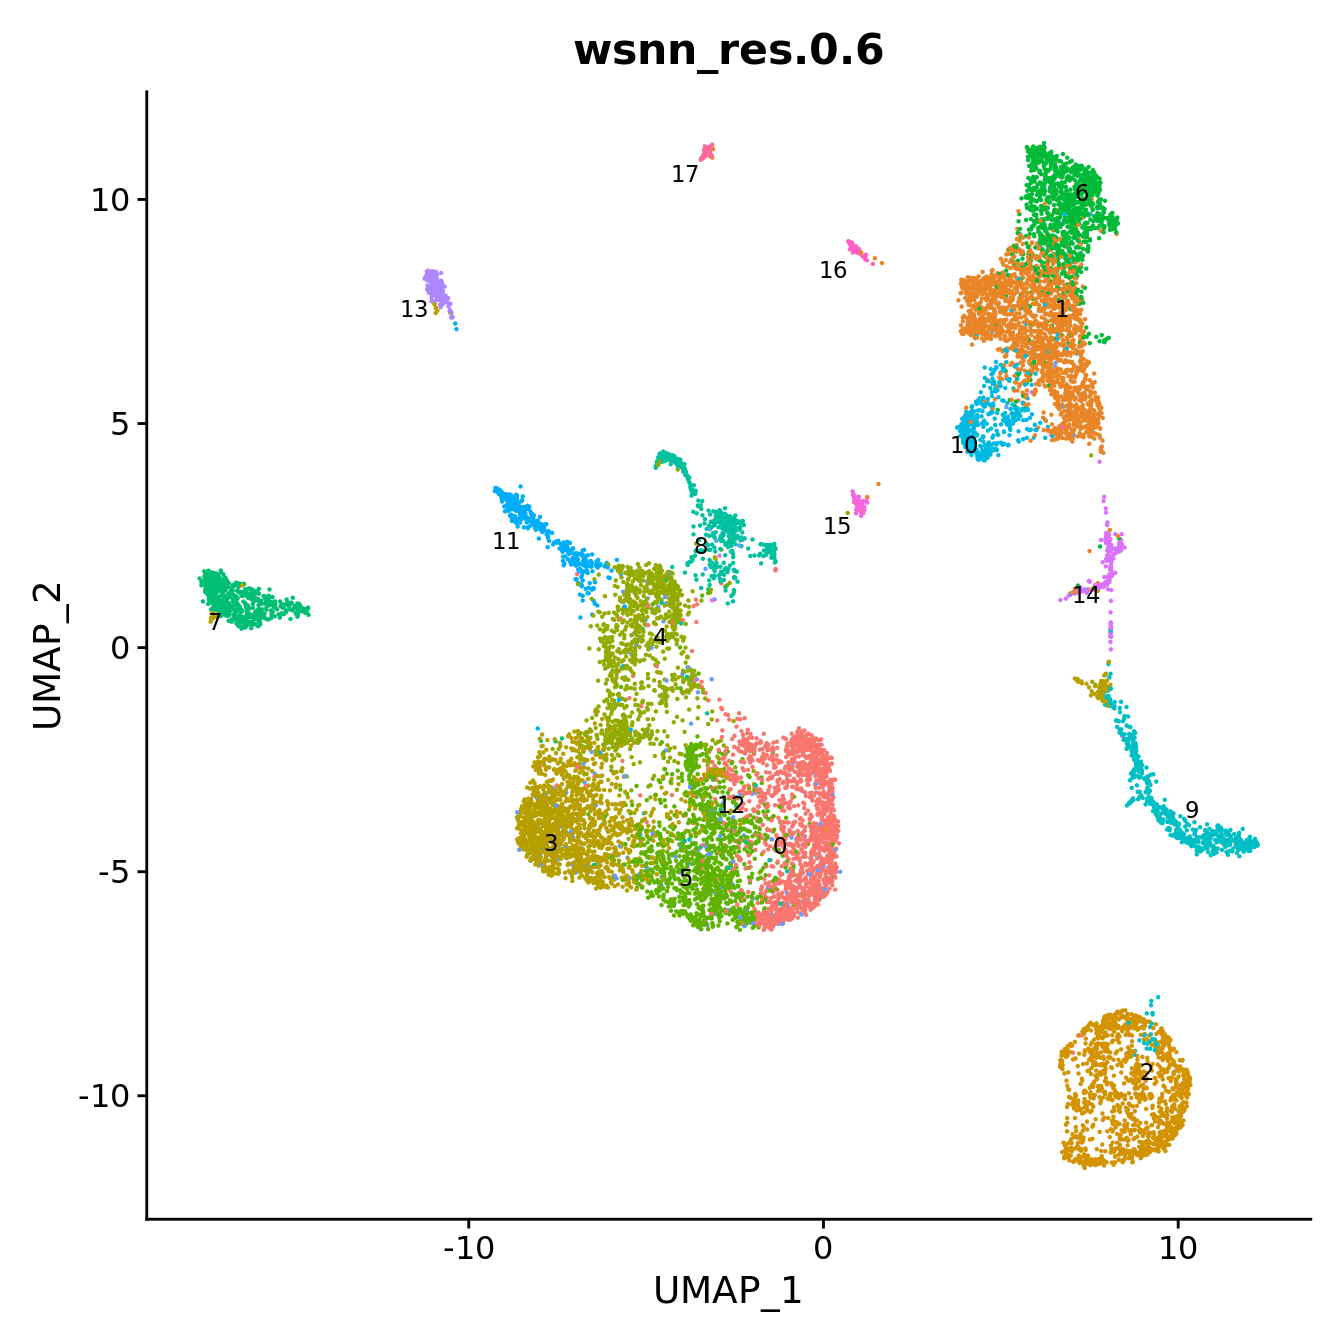
LabelClusters(p2, id = "ann_level_1", repel = TRUE,
              size = 2.5, box = TRUE, fontfamily = "arial")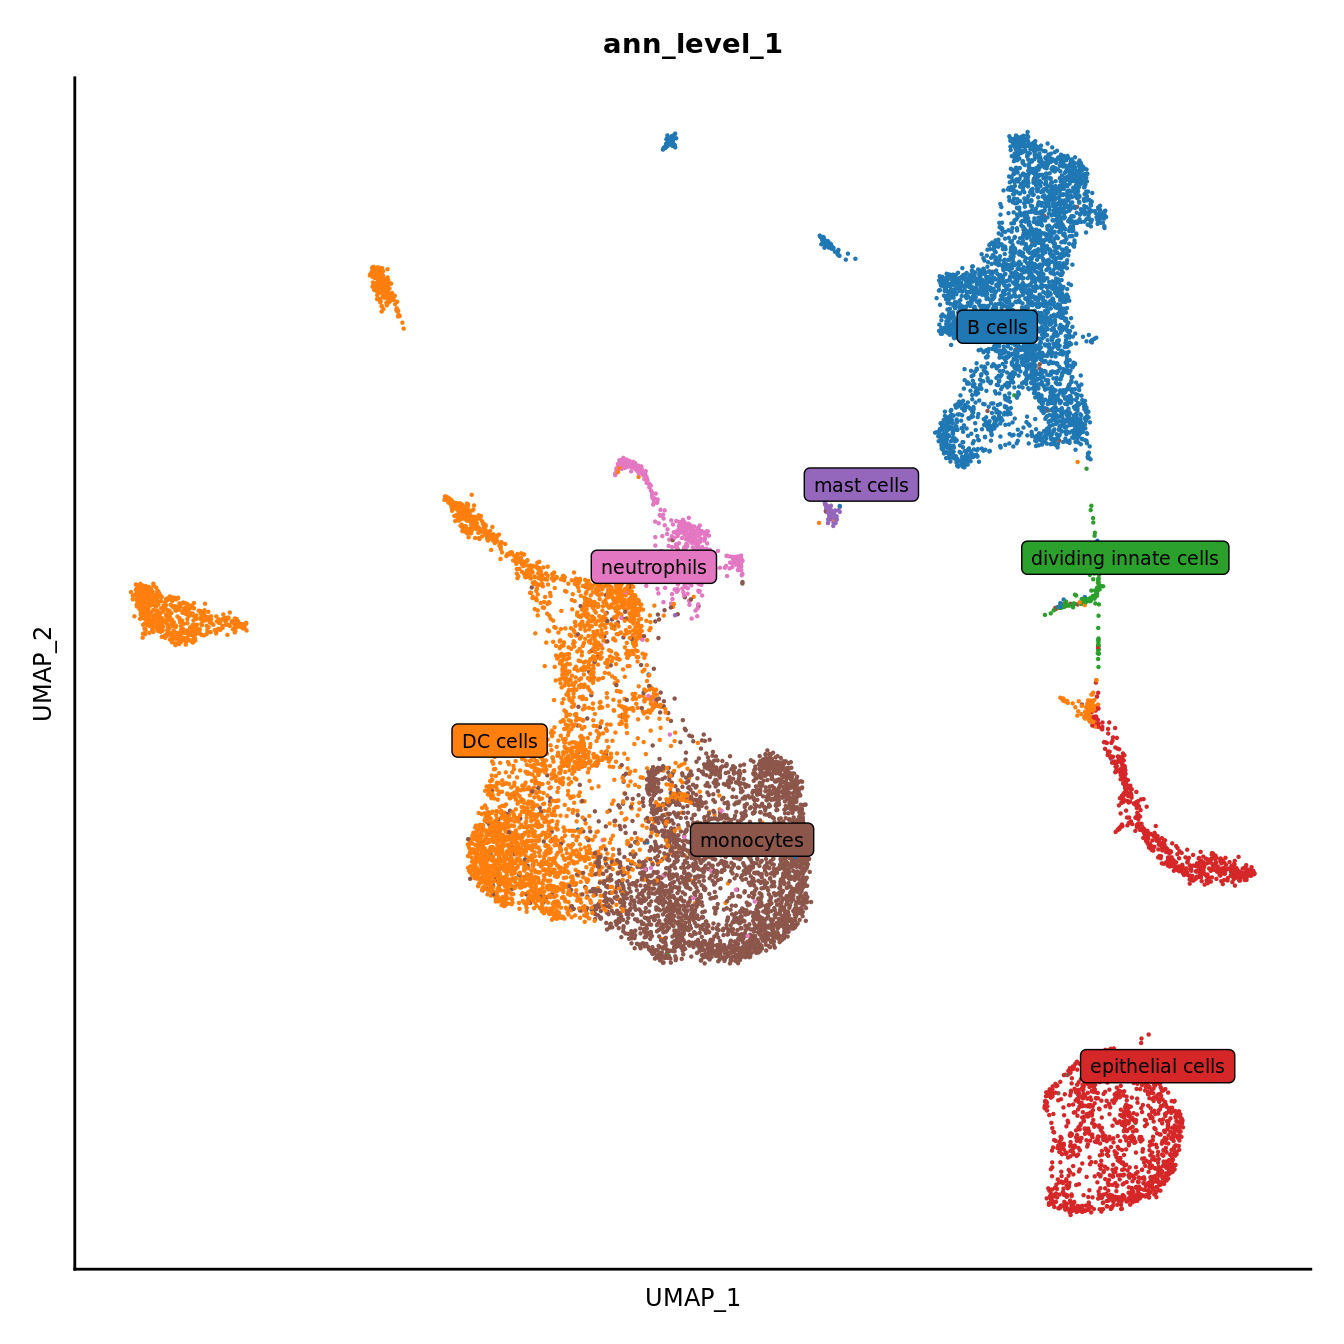
LabelClusters(p3, id = "ann_level_3", repel = TRUE,
              size = 2.5, box = TRUE, fontfamily = "arial")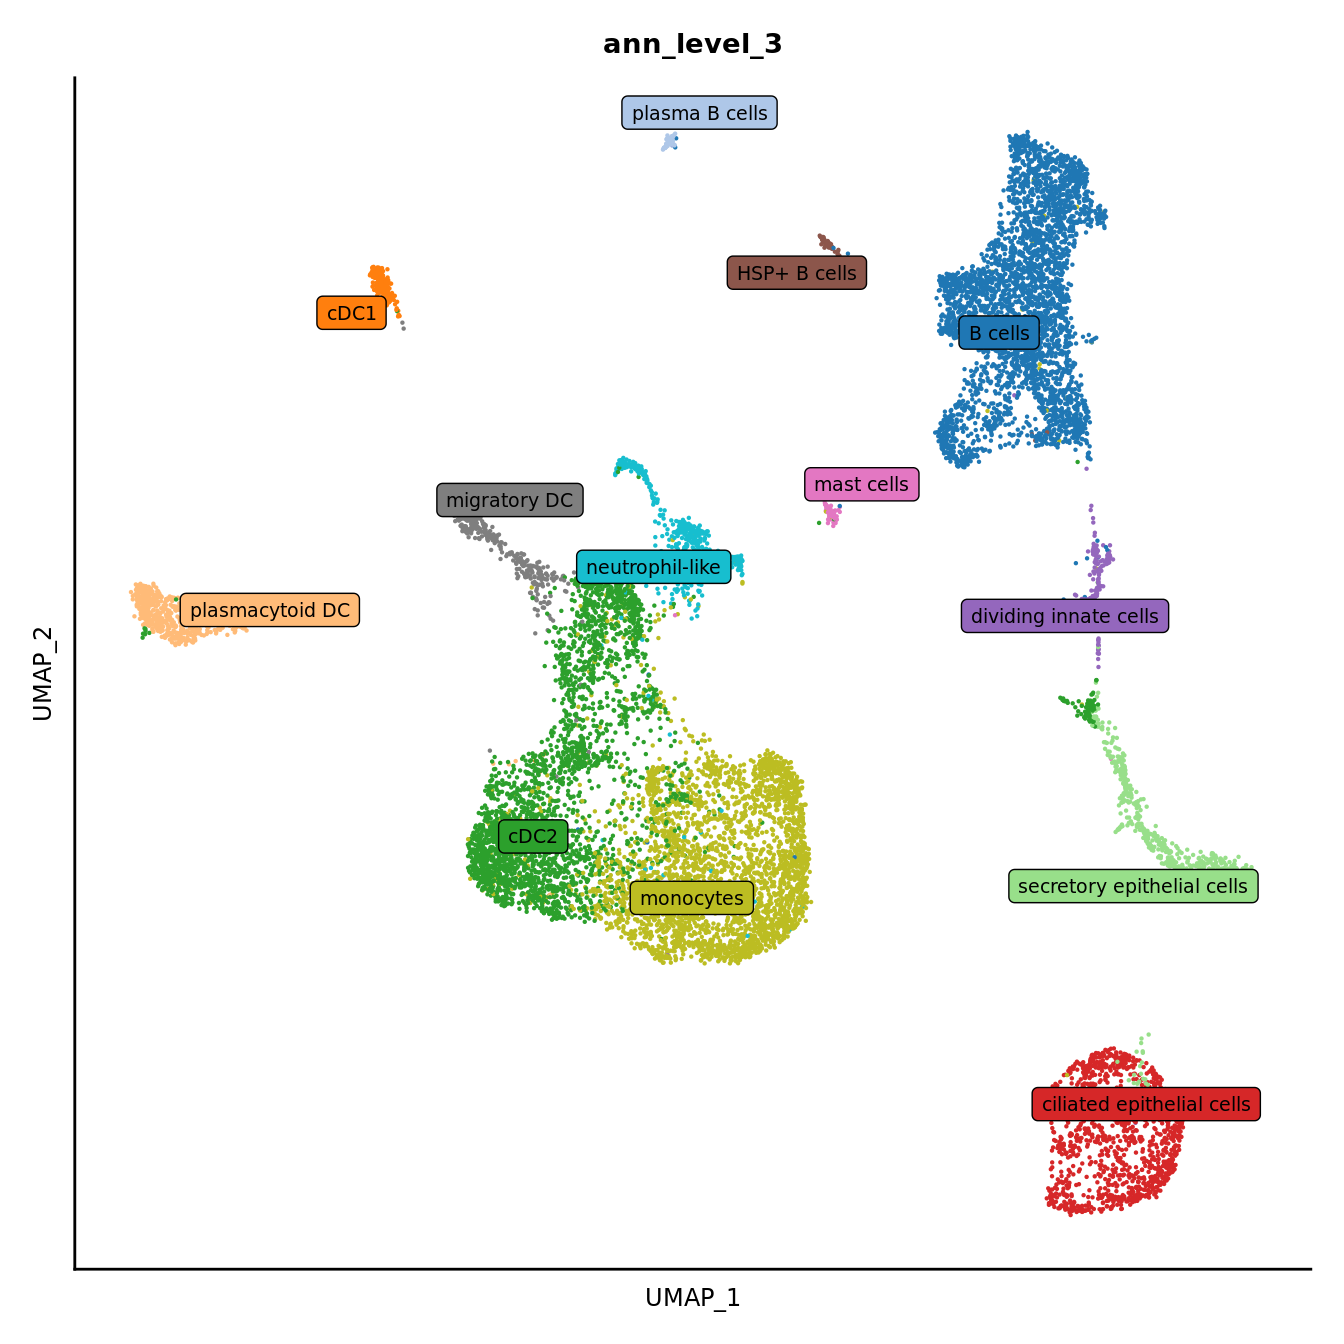
No. cells per cluster
seuInt@meta.data %>%
  ggplot(aes(x = ann_level_1, fill = ann_level_1)) +
  geom_bar() +
  geom_text(aes(label = after_stat(count)), stat = "count",
            vjust = -0.5, colour = "black", size = 2) +
  theme_classic() +
  theme(axis.text.x = element_text(angle = 90, vjust = 0.5, hjust = 1)) +
  NoLegend() +
  scale_fill_paletteer_d(cluster_pal)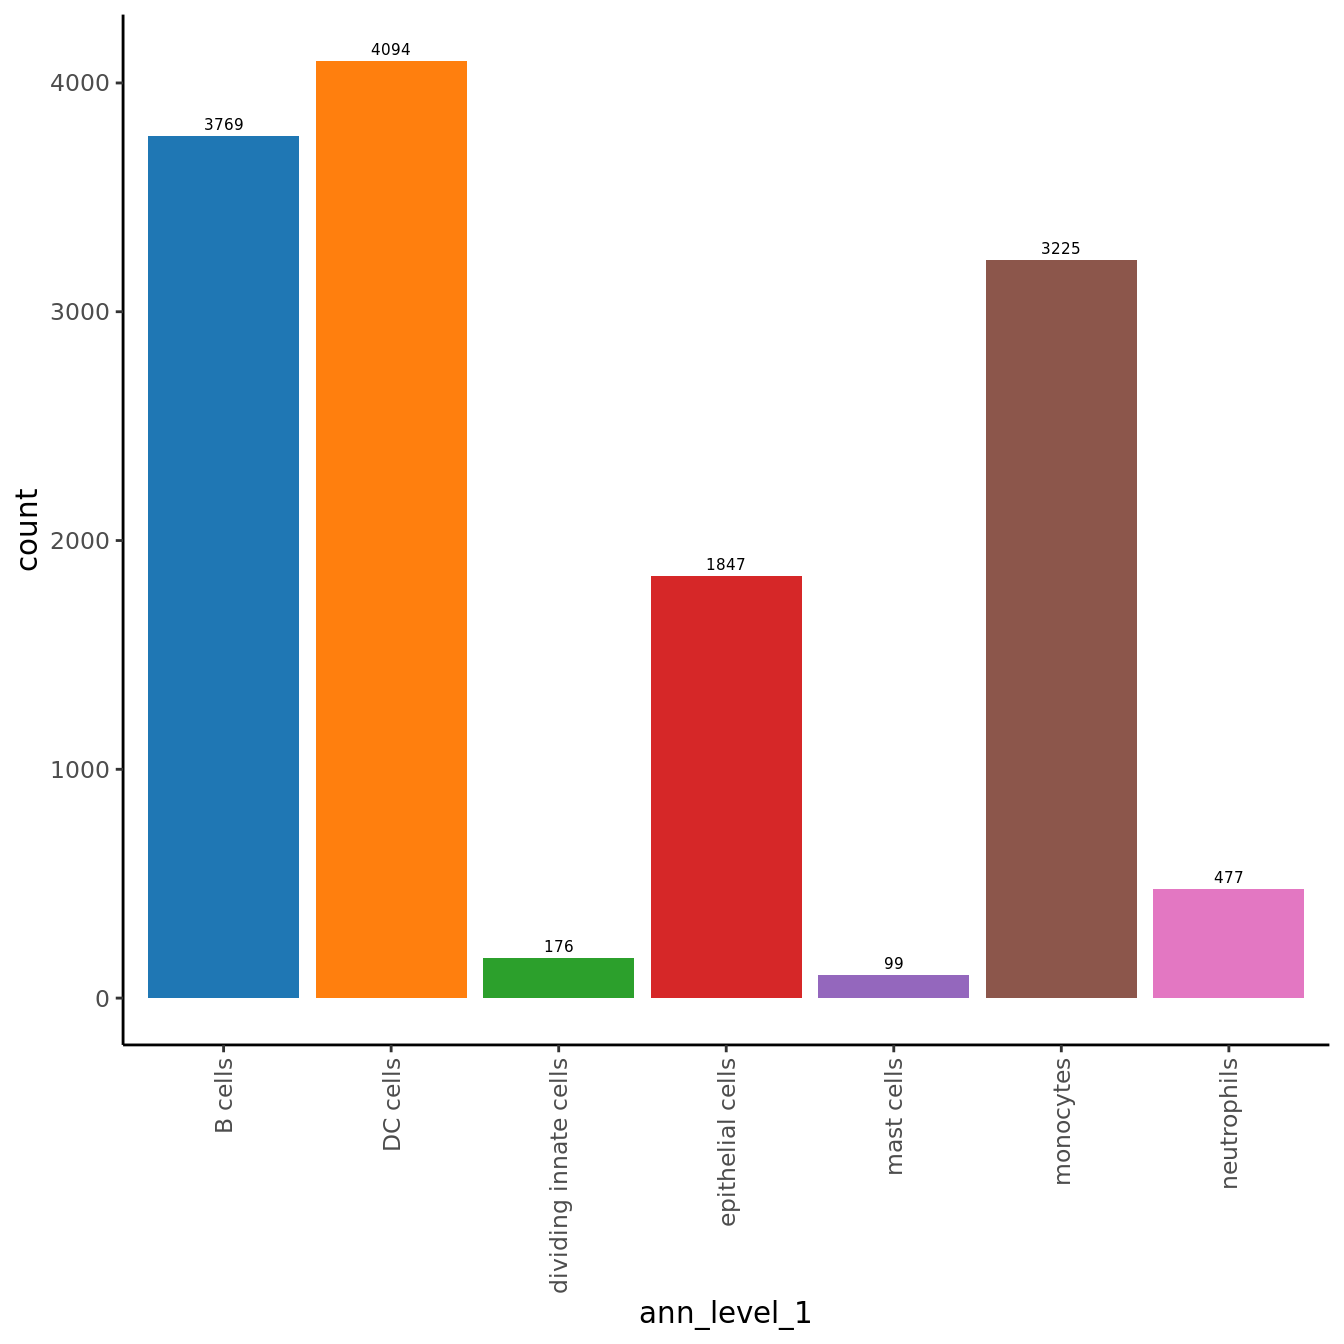
| Version | Author | Date |
|---|---|---|
| 0b24220 | Jovana Maksimovic | 2024-07-05 |
seuInt@meta.data %>%
  ggplot(aes(x = ann_level_3, fill = ann_level_3)) +
  geom_bar() +
  geom_text(aes(label = after_stat(count)), stat = "count",
            vjust = -0.5, colour = "black", size = 2) +
  theme_classic() +
  theme(axis.text.x = element_text(angle = 90, vjust = 0.5, hjust = 1)) +
  NoLegend() +
  scale_fill_paletteer_d(cluster_pal)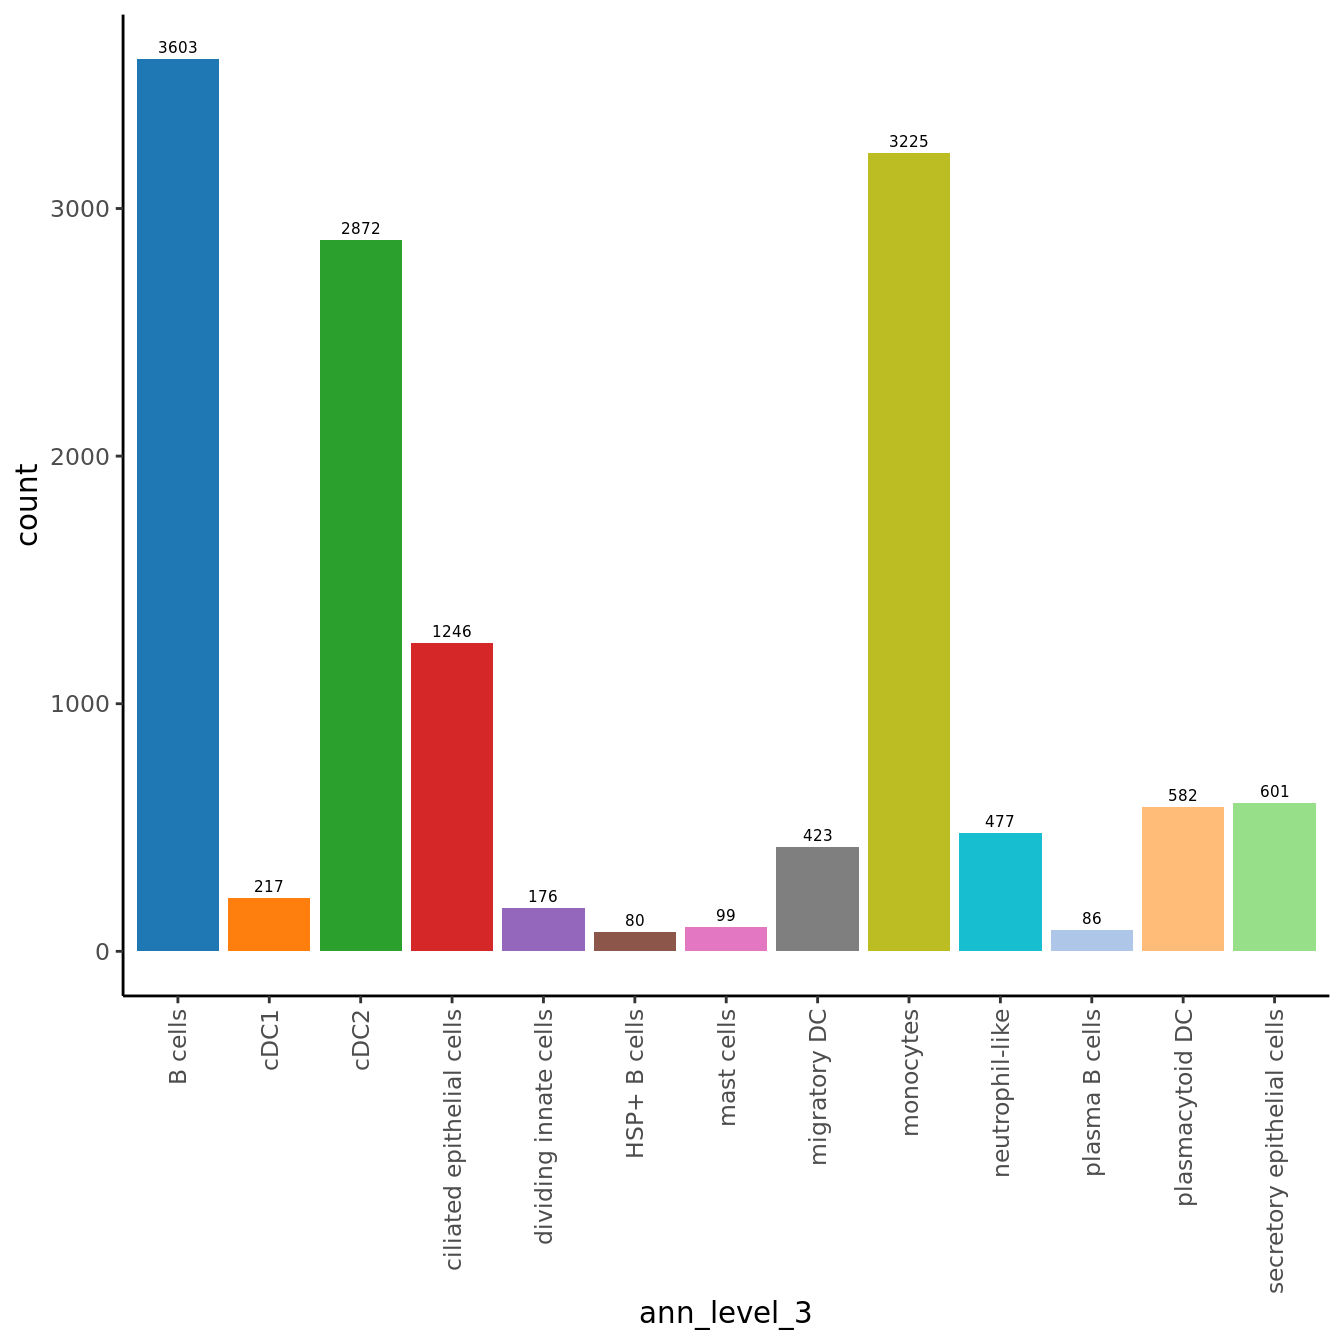
| Version | Author | Date |
|---|---|---|
| 0b24220 | Jovana Maksimovic | 2024-07-05 |
RNA marker gene analysis
Adapted from Dr. Belinda Phipson’s work for [@Sim2021-cg].
Test for marker genes using limma
# limma-trend for DE
Idents(seuInt) <- "ann_level_3"

out <- here("data",
            "C133_Neeland_merged",
            glue("C133_Neeland_full_clean{ambient}_other_cells_logcounts.SEU.rds"))

if(!file.exists(out)){
  logcounts <- normCounts(DGEList(as.matrix(seuInt[["RNA"]]@counts)),
                          log = TRUE, prior.count = 0.5)
  entrez <- AnnotationDbi::mapIds(org.Hs.eg.db,
                                  keys = rownames(logcounts),
                                  column = c("ENTREZID"),
                                  keytype = "SYMBOL",
                                  multiVals = "first")
  # remove genes without entrez IDs as these are difficult to interpret biologically
  logcounts <- logcounts[!is.na(entrez),]
  saveRDS(logcounts, file = out)

} else {
  logcounts <- readRDS(out)
}

maxclust <- length(levels(Idents(seuInt))) - 1

clustgrp <- seuInt$ann_level_3
clustgrp <- factor(clustgrp)
donor <- factor(seuInt$sample.id)
batch <- factor(seuInt$Batch)

design <- model.matrix(~ 0 + clustgrp + donor)
colnames(design)[1:(length(levels(clustgrp)))] <- levels(clustgrp)

# Create contrast matrix
mycont <- matrix(NA, ncol = length(levels(clustgrp)),
                 nrow = length(levels(clustgrp)))
rownames(mycont) <- colnames(mycont) <- levels(clustgrp)
diag(mycont) <- 1
mycont[upper.tri(mycont)] <- -1/(length(levels(factor(clustgrp))) - 1)
mycont[lower.tri(mycont)] <- -1/(length(levels(factor(clustgrp))) - 1)

# Fill out remaining rows with 0s
zero.rows <- matrix(0, ncol = length(levels(clustgrp)),
                    nrow = (ncol(design) - length(levels(clustgrp))))
fullcont <- rbind(mycont, zero.rows)
rownames(fullcont) <- colnames(design)

fit <- lmFit(logcounts, design)

fit.cont <- contrasts.fit(fit, contrasts = fullcont)
fit.cont <- eBayes(fit.cont, trend = TRUE, robust = TRUE)

summary(decideTests(fit.cont))
B cells cDC1 cDC2 ciliated epithelial cells dividing innate cells
Down 6533 2976 6055 2723 835
NotSig 6761 11885 7404 4657 12155
Up 2516 949 2351 8430 2820
HSP+ B cells mast cells migratory DC monocytes neutrophil-like
Down 837 1928 6138 6409 6299
NotSig 14271 12253 8254 6988 8170
Up 702 1629 1418 2413 1341
plasma B cells plasmacytoid DC secretory epithelial cells
Down 1295 3136 3063
NotSig 13871 9003 9094
Up 644 3671 3653Test relative to a threshold (TREAT).
tr <- treat(fit.cont, lfc = 0.5)
dt <- decideTests(tr)
summary(dt)
B cells cDC1 cDC2 ciliated epithelial cells dividing innate cells
Down 81 16 10 204 8
NotSig 15602 15643 15658 14666 15657
Up 127 151 142 940 145
HSP+ B cells mast cells migratory DC monocytes neutrophil-like
Down 27 186 32 14 23
NotSig 15703 15581 15575 15595 15625
Up 80 43 203 201 162
plasma B cells plasmacytoid DC secretory epithelial cells
Down 105 51 165
NotSig 15634 15577 15494
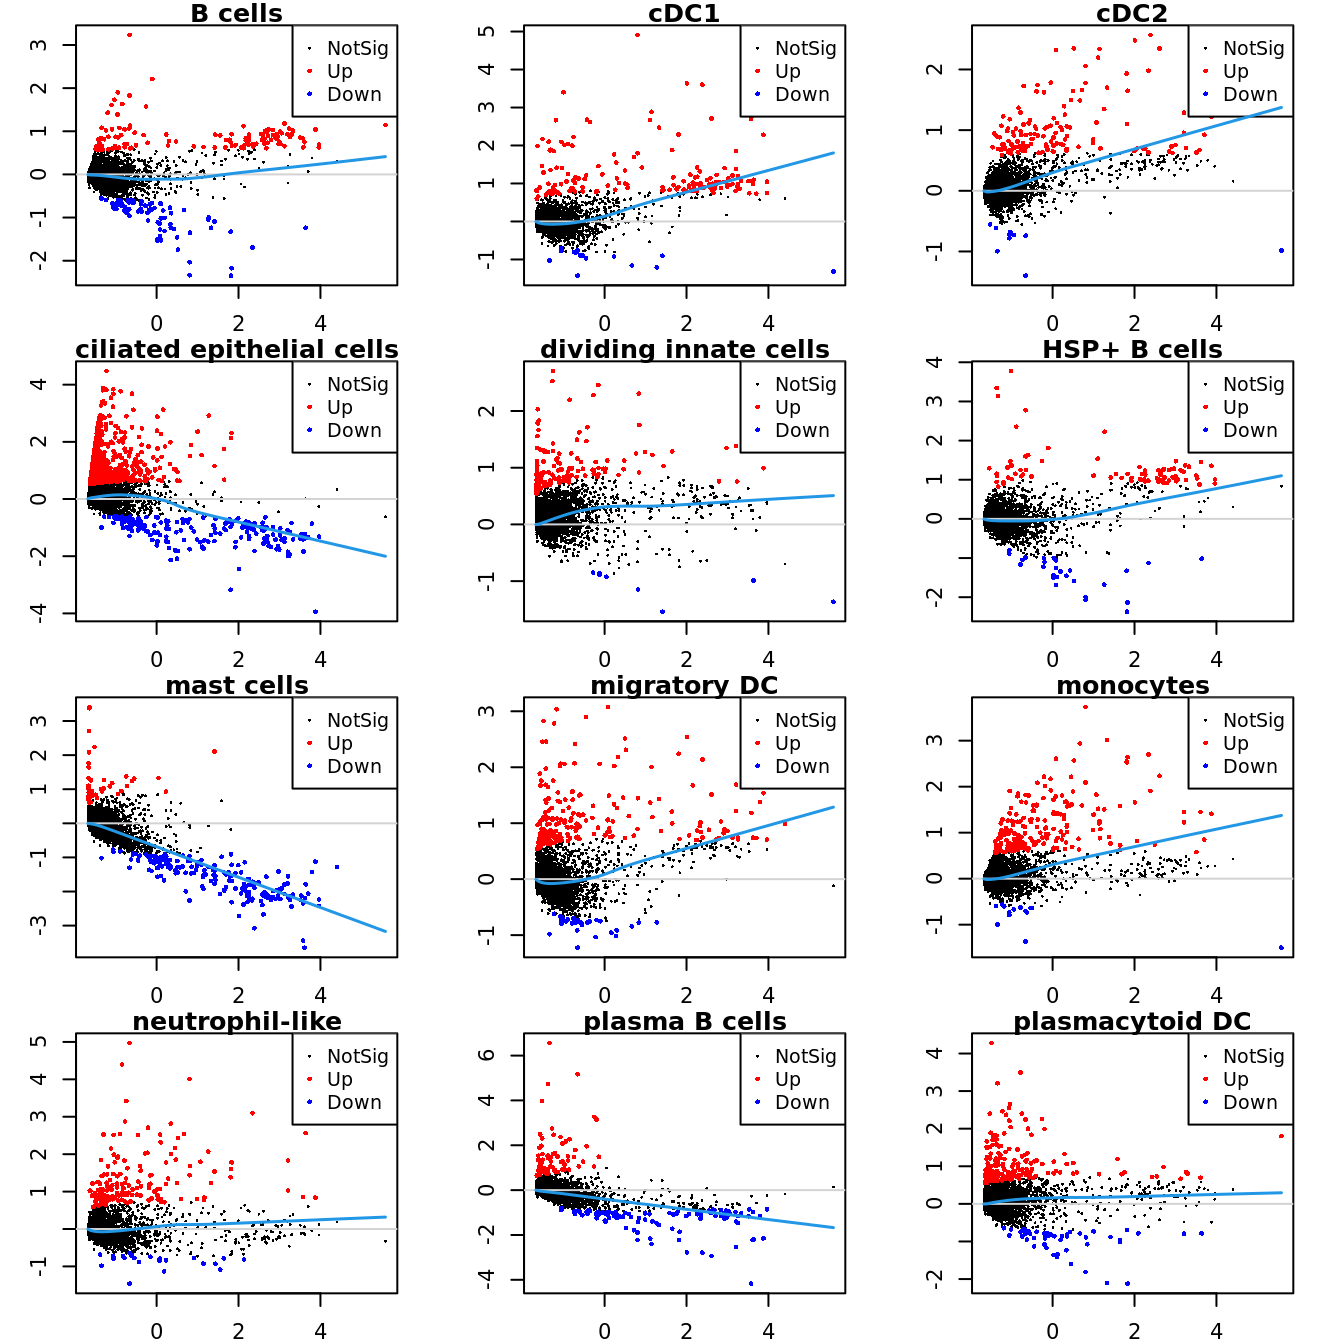
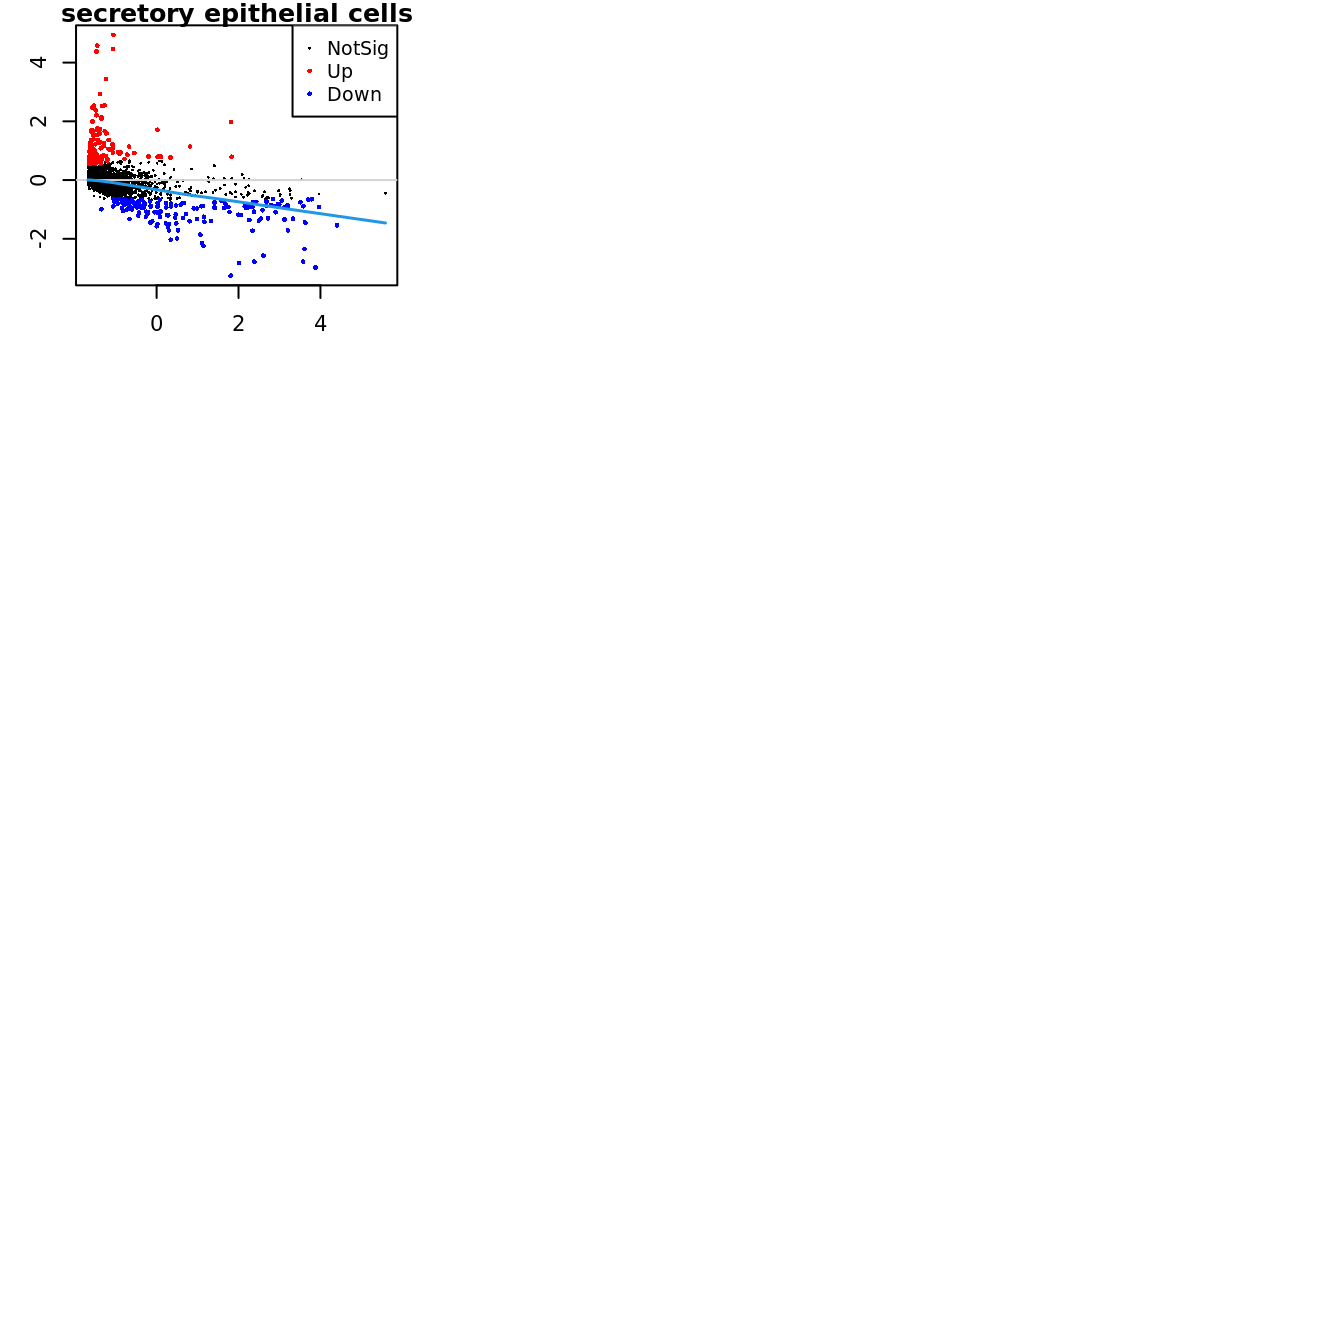
Up 71 182 151Mean-difference (MD) plots per cluster.
par(mfrow=c(4,3))
par(mar=c(2,3,1,2))

for(i in 1:ncol(mycont)){
  plotMD(tr, coef = i, status = dt[,i], hl.cex = 0.5)
  abline(h = 0, col = "lightgrey")
  lines(lowess(tr$Amean, tr$coefficients[,i]), lwd = 1.5, col = 4)
}
limma marker gene dotplot
DefaultAssay(seuInt) <- "RNA"
contnames <- colnames(mycont)
top_markers <- NULL
n_markers <- 5

for(i in 1:ncol(mycont)){
  top <- topTreat(tr, coef = i, n = Inf)
  top <- top[top$logFC > 0, ]
  top_markers <- c(top_markers,
                   setNames(rownames(top)[1:n_markers],
                            rep(contnames[i], n_markers)))
}

top_markers <- top_markers[!is.na(top_markers)]
d <- duplicated(top_markers)
top_markers <- top_markers[!d]
geneCols <- paletteer_d(cluster_pal)[factor(names(top_markers))]

strip <- strip_themed(background_x = elem_list_rect(fill = unique(geneCols)))
DotPlot(seuInt,
        features = unname(top_markers),
        group.by = "ann_level_3",
        cols = c("azure1", "blueviolet"),
        dot.scale = 2.5,
        assay = "SCT") +
  FontSize(x.text = 9, y.text = 9) +
  labs(y = element_blank(), x = element_blank()) +
  facet_grid2(~names(top_markers),
              scales = "free_x",
              space = "free_x",
              strip = strip) +
  theme(axis.text.x = element_text(angle = 90,
                                   hjust = 1,
                                   vjust = 0.5),
        legend.text = element_text(size = 8),
        legend.title = element_text(size = 9),
        strip.text = element_text(size = 0),
        text = element_text(family = "arial"),
        axis.ticks = element_blank(),
        axis.line = element_blank(),
panel.spacing = unit(2, "mm")) 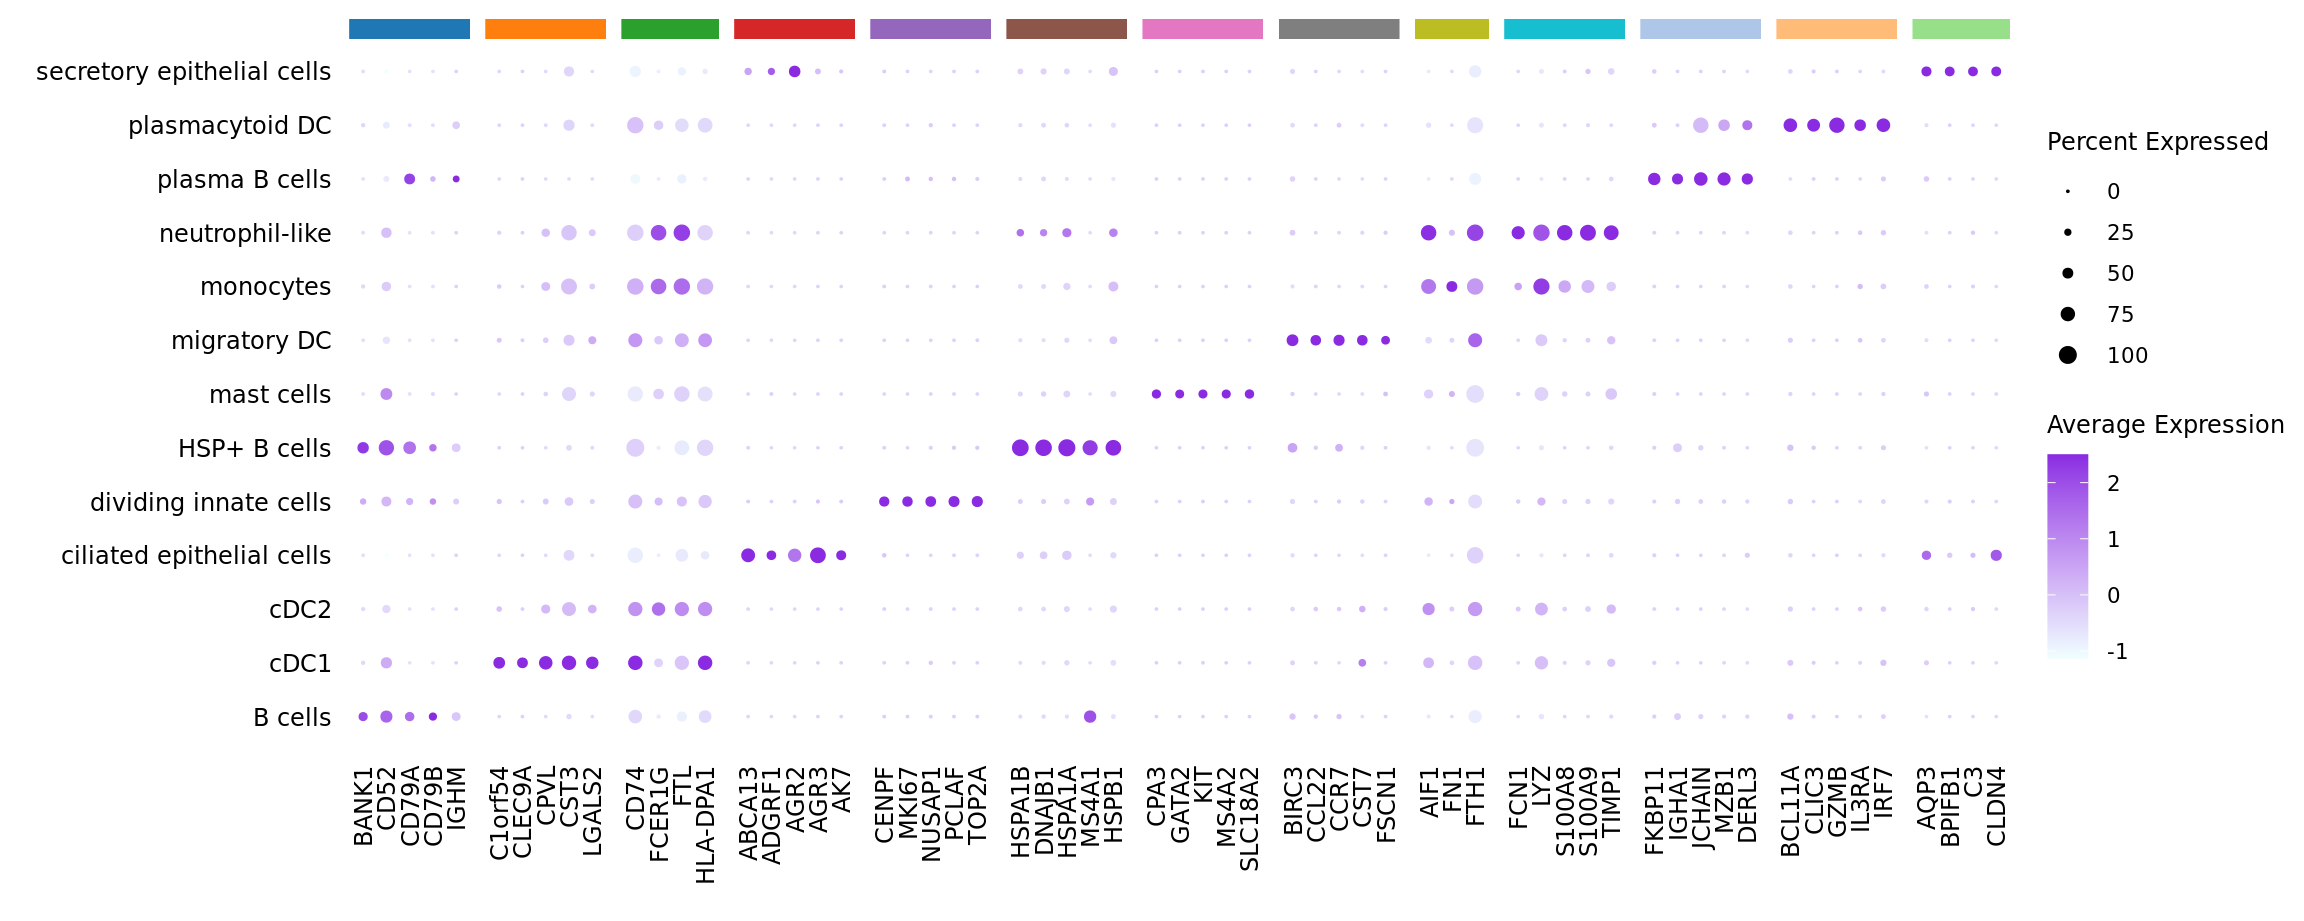
Test for marker genes using Seurat
DefaultAssay(seuInt) <- "RNA"
Idents(seuInt) <- "ann_level_3"

out <- here("data/cluster_annotations/seurat_markers_other_cells.rds")

if(!file.exists(out)){
  # restrict genes to same set as for limma analysis
  markers <- FindAllMarkers(seuInt, only.pos = TRUE,
                            features = rownames(logcounts))
  saveRDS(markers, file = out)

} else {
  markers <- readRDS(out)

}

head(markers) %>% knitr::kable()| p_val | avg_log2FC | pct.1 | pct.2 | p_val_adj | cluster | gene | |
|---|---|---|---|---|---|---|---|
| FCRL5 | 0 | 54.84147 | 0.409 | 0.016 | 0 | B cells | FCRL5 |
| CD48 | 0 | 41.57641 | 0.632 | 0.276 | 0 | B cells | CD48 |
| TTN | 0 | 16.80242 | 0.214 | 0.013 | 0 | B cells | TTN |
| FCRL2 | 0 | 14.15510 | 0.254 | 0.008 | 0 | B cells | FCRL2 |
| RALGPS2 | 0 | 11.58341 | 0.506 | 0.085 | 0 | B cells | RALGPS2 |
| FCRL3 | 0 | 11.14185 | 0.211 | 0.003 | 0 | B cells | FCRL3 |
Seurat marker gene dotplot
DefaultAssay(seuInt) <- "RNA"

maxGenes <- 5
markers %>%
  group_by(cluster) %>%
  top_n(n = maxGenes, wt = avg_log2FC) -> top5

sig <- top5$gene
d <- duplicated(sig)
geneCols <- paletteer_d(cluster_pal)[top5$cluster][!d]

strip <- strip_themed(background_x = elem_list_rect(fill = unique(geneCols)))
DotPlot(seuInt,
        features = sig[!d],
        group.by = "ann_level_3",
        cols = c("azure1", "blueviolet"),
        dot.scale = 2.5,
        assay = "SCT") +
  FontSize(x.text = 9, y.text = 9) +
  labs(y = element_blank(), x = element_blank()) +
  facet_grid2(~top5$cluster[!d],
              scales = "free_x",
              space = "free_x",
              strip = strip) +
  theme(axis.text.x = element_text(angle = 90,
                                   hjust = 1,
                                   vjust = 0.5),
        legend.text = element_text(size = 8),
        legend.title = element_text(size = 9),
        strip.text = element_text(size = 0),
        text = element_text(family = "arial"),
        axis.ticks = element_blank(),
        axis.line = element_blank(),
panel.spacing = unit(2, "mm")) 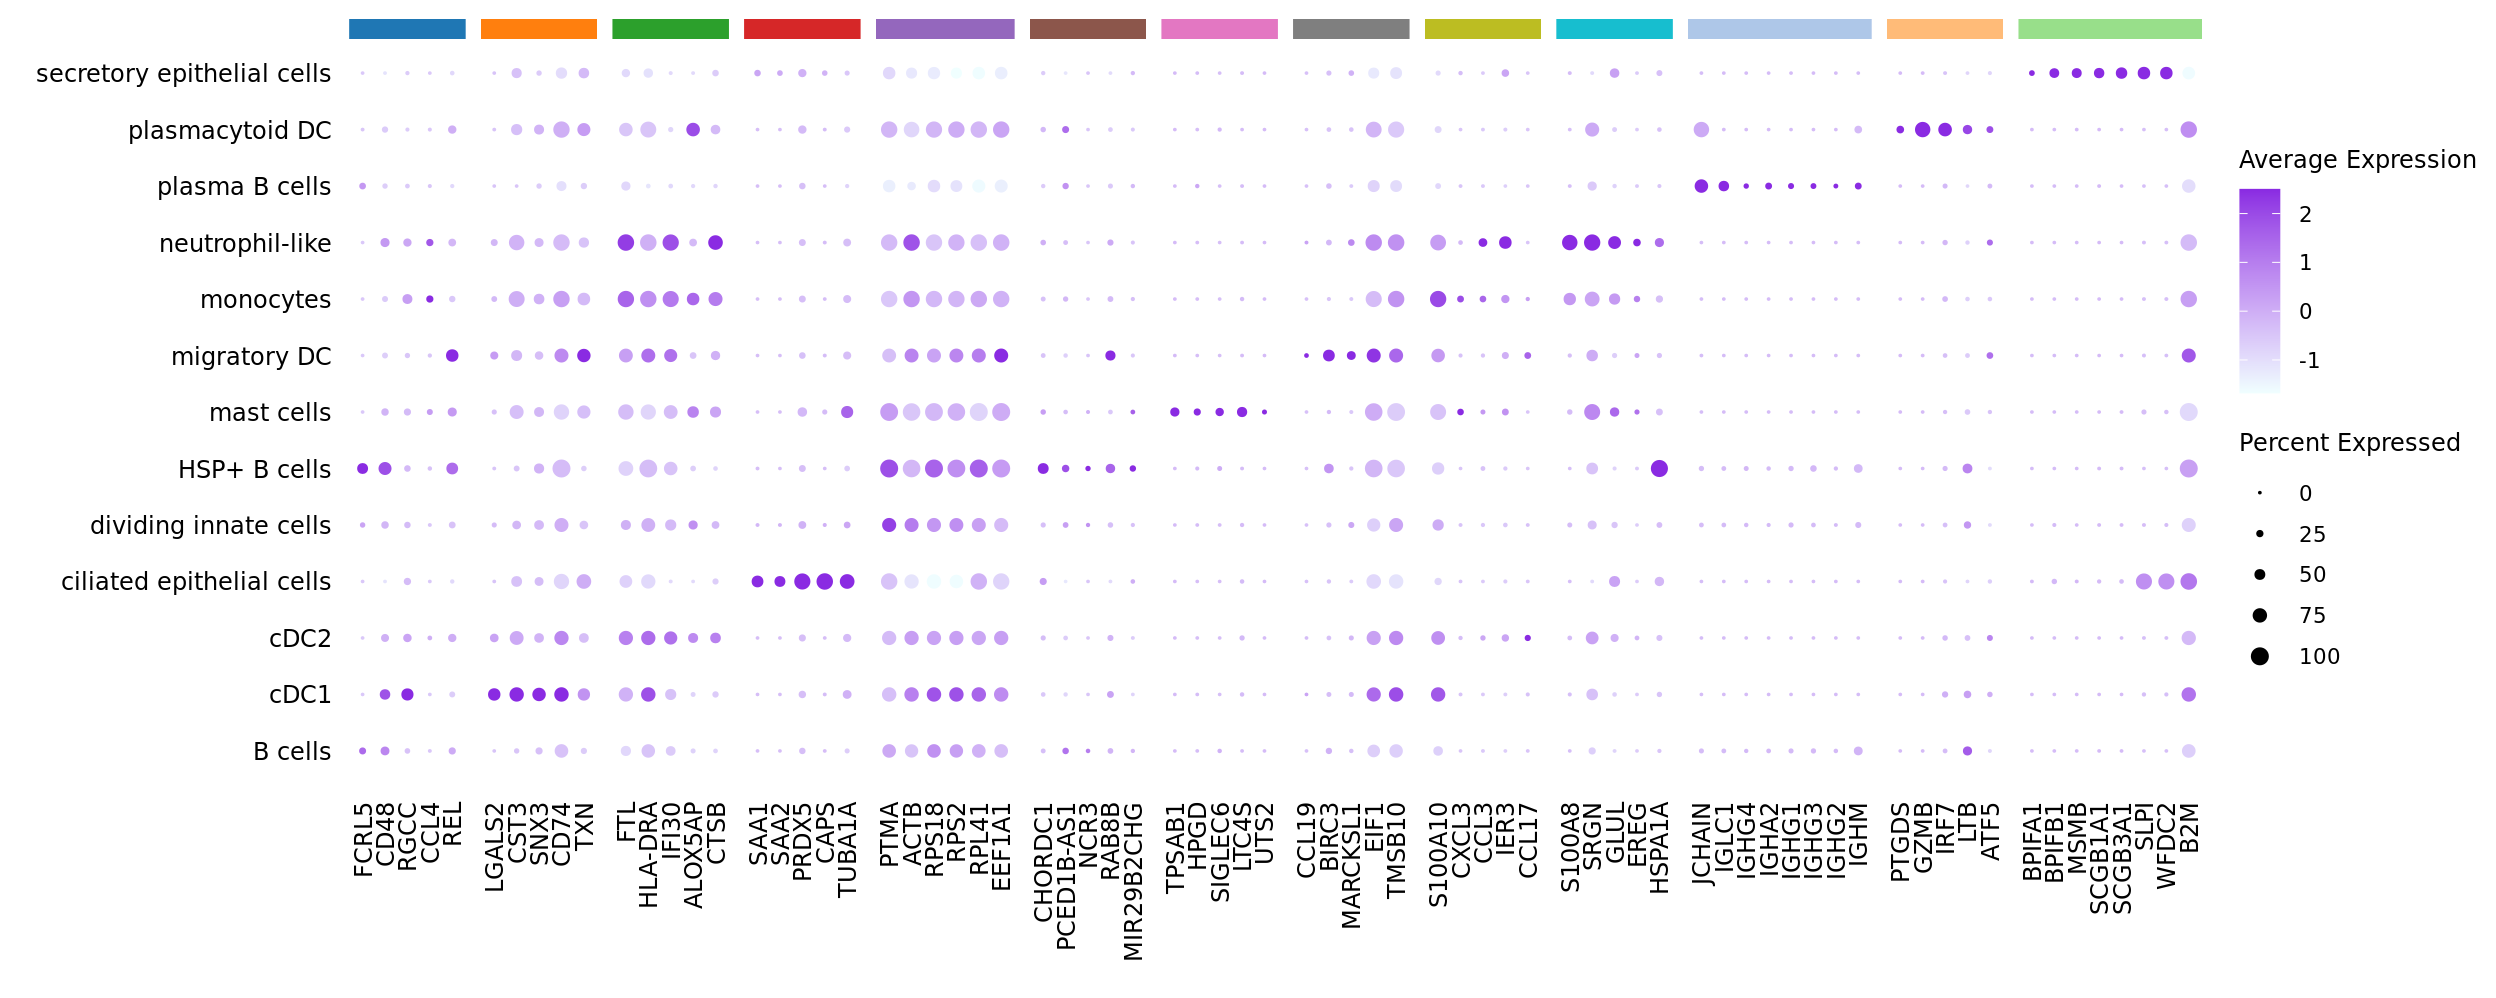
| Version | Author | Date |
|---|---|---|
| 0b24220 | Jovana Maksimovic | 2024-07-05 |
Visualise ADTs
Make data frame of proteins, clusters, expression levels.
out <- here("data",
            "C133_Neeland_merged",
            glue("C133_Neeland_full_clean{ambient}_other_cells_adt_dsb.SEU.rds"))

if(!file.exists(out)){
  read_csv(file = here("data",
                       "C133_Neeland_batch1",
                       "data",
                       "sample_sheets",
                       "ADT_features.csv")) -> adt_data

  pattern <- "anti-human/mouse |anti-human/mouse/rat |anti-mouse/human |anti-human "
  adt_data$name <- gsub(pattern, "", adt_data$name)
  adt <- seuInt[["ADT"]]@counts
  if(all(rownames(seuInt[["ADT"]]@counts) == adt_data$id)) rownames(adt) <- adt_data$name
  adt_data %>%
  dplyr::filter(grepl("[Ii]sotype", name)) %>%
  pull(name) -> isotype_controls

  # normalise ADT using DSB normalisation
  adt_dsb <- ModelNegativeADTnorm(cell_protein_matrix = adt,
                                  denoise.counts = TRUE,
                                  use.isotype.control = TRUE,
                                  isotype.control.name.vec = isotype_controls)
  saveRDS(adt_dsb, file = out)

} else {
  adt_dsb <- readRDS(out)

}

#seuInt[["ADT.dsb"]] <- NULL
m <- match(colnames(seuInt), colnames(adt_dsb)) # remove cells not present in Seurat obj
seuInt[["ADT.dsb"]] <- CreateAssayObject(data = adt_dsb[,m])
ADTs <- read_csv(file = here("data",
"Proteins_other_22.04.22.csv"))
pattern <- "anti-human/mouse |anti-human/mouse/rat |anti-mouse/human |anti-human "
ADTs$Description <- gsub(pattern, "", ADTs$Description)
DotPlot(seuInt,
features = ADTs$Description,
group.by = "ann_level_3",
cols = c("azure1", "blueviolet"),
dot.scale = 2.5,
assay = "ADT.dsb") +
FontSize(x.text = 9, y.text = 9) +
labs(y = element_blank(), x = element_blank()) +
theme(axis.text.x = element_text(angle = 90,
hjust = 1,
vjust = 0.5),
legend.text = element_text(size = 8),
legend.title = element_text(size = 9),
strip.text = element_text(size = 0),
text = element_text(family = "arial"),
axis.ticks = element_blank(),
axis.line = element_blank(),
panel.spacing = unit(2, "mm")) 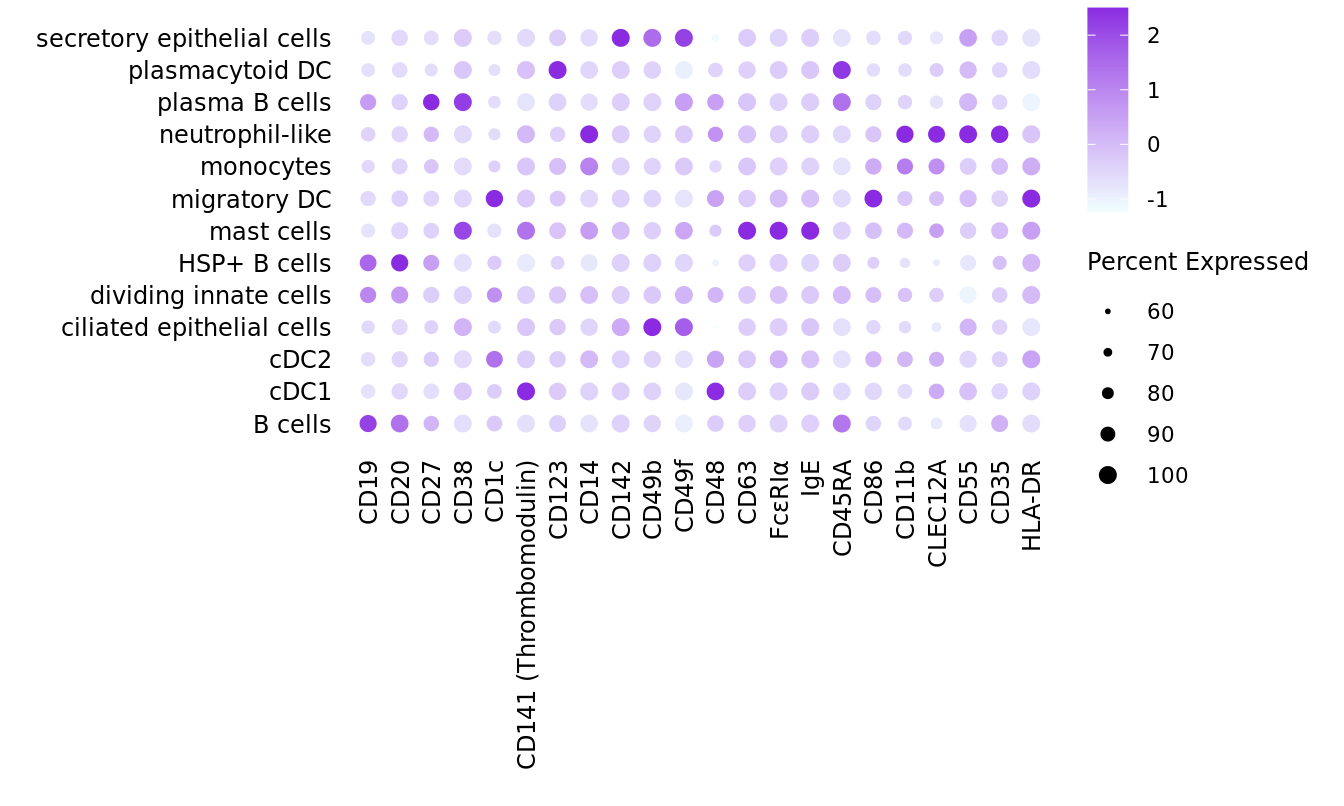
| Version | Author | Date |
|---|---|---|
| 0b24220 | Jovana Maksimovic | 2024-07-05 |
Save data
out <- here("data",
            "C133_Neeland_merged",
            glue("C133_Neeland_full_clean{ambient}_other_cells_annotated_diet.SEU.rds"))
if(!file.exists(out)){
  DefaultAssay(seuInt) <- "RNA"
  saveRDS(DietSeurat(seuInt, assays = "RNA"), out)
}

out <- here("data",
            "C133_Neeland_merged",
            glue("C133_Neeland_full_clean{ambient}_other_cells_annotated_full.SEU.rds"))
if(!file.exists(out)){
  DefaultAssay(seuInt) <- "RNA"
  saveRDS(seuInt, out)
}
Session info
sessionInfo()R version 4.3.3 (2024-02-29)
Platform: x86_64-pc-linux-gnu (64-bit)
Running under: Ubuntu 22.04.4 LTS
Matrix products: default
BLAS: /usr/lib/x86_64-linux-gnu/openblas-pthread/libblas.so.3
LAPACK: /usr/lib/x86_64-linux-gnu/openblas-pthread/libopenblasp-r0.3.20.so; LAPACK version 3.10.0
locale:
[1] LC_CTYPE=en_AU.UTF-8 LC_NUMERIC=C
[3] LC_TIME=en_AU.UTF-8 LC_COLLATE=en_AU.UTF-8
[5] LC_MONETARY=en_AU.UTF-8 LC_MESSAGES=en_AU.UTF-8
[7] LC_PAPER=en_AU.UTF-8 LC_NAME=C
[9] LC_ADDRESS=C LC_TELEPHONE=C
[11] LC_MEASUREMENT=en_AU.UTF-8 LC_IDENTIFICATION=C
time zone: Etc/UTC
tzcode source: system (glibc)
attached base packages:
[1] stats4 stats graphics grDevices datasets utils methods
[8] base
other attached packages:
[1] dsb_1.0.3 ggh4x_0.2.8
[3] speckle_1.2.0 org.Hs.eg.db_3.18.0
[5] AnnotationDbi_1.64.1 readxl_1.4.3
[7] tidyHeatmap_1.8.1 paletteer_1.6.0
[9] patchwork_1.2.0 glue_1.7.0
[11] here_1.0.1 dittoSeq_1.14.2
[13] SeuratObject_4.1.4 Seurat_4.4.0
[15] lubridate_1.9.3 forcats_1.0.0
[17] stringr_1.5.1 dplyr_1.1.4
[19] purrr_1.0.2 readr_2.1.5
[21] tidyr_1.3.1 tibble_3.2.1
[23] ggplot2_3.5.0 tidyverse_2.0.0
[25] edgeR_4.0.15 limma_3.58.1
[27] SingleCellExperiment_1.24.0 SummarizedExperiment_1.32.0
[29] Biobase_2.62.0 GenomicRanges_1.54.1
[31] GenomeInfoDb_1.38.6 IRanges_2.36.0
[33] S4Vectors_0.40.2 BiocGenerics_0.48.1
[35] MatrixGenerics_1.14.0 matrixStats_1.2.0
[37] workflowr_1.7.1
loaded via a namespace (and not attached):
[1] RcppAnnoy_0.0.22 splines_4.3.3 later_1.3.2
[4] prismatic_1.1.1 bitops_1.0-7 cellranger_1.1.0
[7] polyclip_1.10-6 lifecycle_1.0.4 doParallel_1.0.17
[10] rprojroot_2.0.4 vroom_1.6.5 globals_0.16.2
[13] processx_3.8.3 lattice_0.22-5 MASS_7.3-60.0.1
[16] dendextend_1.17.1 magrittr_2.0.3 plotly_4.10.4
[19] sass_0.4.8 rmarkdown_2.25 jquerylib_0.1.4
[22] yaml_2.3.8 httpuv_1.6.14 sctransform_0.4.1
[25] sp_2.1-3 spatstat.sparse_3.0-3 reticulate_1.35.0
[28] DBI_1.2.1 cowplot_1.1.3 pbapply_1.7-2
[31] RColorBrewer_1.1-3 abind_1.4-5 zlibbioc_1.48.0
[34] Rtsne_0.17 RCurl_1.98-1.14 git2r_0.33.0
[37] circlize_0.4.15 GenomeInfoDbData_1.2.11 ggrepel_0.9.5
[40] irlba_2.3.5.1 listenv_0.9.1 spatstat.utils_3.0-4
[43] pheatmap_1.0.12 goftest_1.2-3 spatstat.random_3.2-2
[46] fitdistrplus_1.1-11 parallelly_1.37.0 leiden_0.4.3.1
[49] codetools_0.2-19 DelayedArray_0.28.0 shape_1.4.6
[52] tidyselect_1.2.0 farver_2.1.1 viridis_0.6.5
[55] spatstat.explore_3.2-6 jsonlite_1.8.8 GetoptLong_1.0.5
[58] ellipsis_0.3.2 progressr_0.14.0 iterators_1.0.14
[61] ggridges_0.5.6 survival_3.7-0 foreach_1.5.2
[64] tools_4.3.3 ica_1.0-3 Rcpp_1.0.12
[67] gridExtra_2.3 SparseArray_1.2.4 xfun_0.42
[70] withr_3.0.0 BiocManager_1.30.22 fastmap_1.1.1
[73] fansi_1.0.6 callr_3.7.3 digest_0.6.34
[76] timechange_0.3.0 R6_2.5.1 mime_0.12
[79] colorspace_2.1-0 scattermore_1.2 tensor_1.5
[82] RSQLite_2.3.5 spatstat.data_3.0-4 utf8_1.2.4
[85] generics_0.1.3 renv_1.0.3 data.table_1.15.0
[88] httr_1.4.7 htmlwidgets_1.6.4 S4Arrays_1.2.0
[91] whisker_0.4.1 uwot_0.1.16 pkgconfig_2.0.3
[94] gtable_0.3.4 blob_1.2.4 ComplexHeatmap_2.18.0
[97] lmtest_0.9-40 XVector_0.42.0 htmltools_0.5.7
[100] clue_0.3-65 scales_1.3.0 png_0.1-8
[103] knitr_1.45 rstudioapi_0.15.0 rjson_0.2.21
[106] tzdb_0.4.0 reshape2_1.4.4 nlme_3.1-164
[109] GlobalOptions_0.1.2 cachem_1.0.8 zoo_1.8-12
[112] KernSmooth_2.23-24 parallel_4.3.3 miniUI_0.1.1.1
[115] pillar_1.9.0 grid_4.3.3 vctrs_0.6.5
[118] RANN_2.6.1 promises_1.2.1 xtable_1.8-4
[121] cluster_2.1.6 evaluate_0.23 cli_3.6.2
[124] locfit_1.5-9.8 compiler_4.3.3 rlang_1.1.3
[127] crayon_1.5.2 future.apply_1.11.1 labeling_0.4.3
[130] mclust_6.1 rematch2_2.1.2 ps_1.7.6
[133] getPass_0.2-4 plyr_1.8.9 fs_1.6.3
[136] stringi_1.8.3 viridisLite_0.4.2 deldir_2.0-2
[139] Biostrings_2.70.2 munsell_0.5.0 lazyeval_0.2.2
[142] spatstat.geom_3.2-8 Matrix_1.6-5 hms_1.1.3
[145] bit64_4.0.5 future_1.33.1 KEGGREST_1.42.0
[148] statmod_1.5.0 shiny_1.8.0 highr_0.10
[151] ROCR_1.0-11 memoise_2.0.1 igraph_2.0.1.1
[154] bslib_0.6.1 bit_4.0.5