Inflammation of Paediatric Pulmonary Diseases
Cell type proportions analysis: annotation level 1
Jovana Maksimovic
April 02, 2026
Last updated: 2026-04-02
Checks: 7 0
Knit directory:
paediatric-cf-inflammation-citeseq/
This reproducible R Markdown analysis was created with workflowr (version 1.7.1). The Checks tab describes the reproducibility checks that were applied when the results were created. The Past versions tab lists the development history.
Great! Since the R Markdown file has been committed to the Git repository, you know the exact version of the code that produced these results.
Great job! The global environment was empty. Objects defined in the global environment can affect the analysis in your R Markdown file in unknown ways. For reproduciblity it’s best to always run the code in an empty environment.
The command set.seed(20240216) was run prior to running
the code in the R Markdown file. Setting a seed ensures that any results
that rely on randomness, e.g. subsampling or permutations, are
reproducible.
Great job! Recording the operating system, R version, and package versions is critical for reproducibility.
Nice! There were no cached chunks for this analysis, so you can be confident that you successfully produced the results during this run.
Great job! Using relative paths to the files within your workflowr project makes it easier to run your code on other machines.
Great! You are using Git for version control. Tracking code development and connecting the code version to the results is critical for reproducibility.
The results in this page were generated with repository version d9dfda4. See the Past versions tab to see a history of the changes made to the R Markdown and HTML files.
Note that you need to be careful to ensure that all relevant files for
the analysis have been committed to Git prior to generating the results
(you can use wflow_publish or
wflow_git_commit). workflowr only checks the R Markdown
file, but you know if there are other scripts or data files that it
depends on. Below is the status of the Git repository when the results
were generated:
Ignored files:
    Ignored:    .Rhistory
    Ignored:    .Rproj.user/
    Ignored:    analysis/.DS_Store
    Ignored:    analysis/obsolete/
    Ignored:    code/obsolete/
    Ignored:    data/.DS_Store
    Ignored:    data/C133_Neeland_batch0/
    Ignored:    data/C133_Neeland_batch1/
    Ignored:    data/C133_Neeland_batch2/
    Ignored:    data/C133_Neeland_batch3/
    Ignored:    data/C133_Neeland_batch4/
    Ignored:    data/C133_Neeland_batch5/
    Ignored:    data/C133_Neeland_batch6/
    Ignored:    data/C133_Neeland_merged/
    Ignored:    data/Neeland_processed_data_1.h5ad
    Ignored:    data/Neeland_processed_data_2.h5ad
    Ignored:    data/Neeland_processed_data_3.h5ad
    Ignored:    data/intermediate_objects/.DS_Store
    Ignored:    data/updated_h5ad_files/
    Ignored:    output/.DS_Store
    Ignored:    renv/library/
    Ignored:    renv/staging/

Untracked files:
    Untracked:  C133_Neeland_preprocessed_SCEs.tar.gz
    Untracked:  analysis/cellxgene_submission.Rmd
    Untracked:  data/GOBP_CYTOKINE_MEDIATED_SIGNALING_PATHWAY.v2025.1.Hs.tsv
    Untracked:  data/cellxgene_cell_ontologies_ann_level_3.xlsx
    Untracked:  data/gencode.v44.primary_assembly.annotation.gtf

Unstaged changes:
    Modified:   .DS_Store
    Modified:   analysis/15.1_proportions_analysis_ann_level_3_non-macrophages.Rmd
    Modified:   analysis/15.2_proportions_analysis_ann_level_3_macrophages.Rmd
    Modified:   data/intermediate_objects/CD4 T cells.CF_samples.fit.rds
    Modified:   data/intermediate_objects/CD4 T cells.all_samples.fit.rds
    Modified:   data/intermediate_objects/CD8 T cells.CF_samples.fit.rds
    Modified:   data/intermediate_objects/CD8 T cells.all_samples.fit.rds
    Modified:   data/intermediate_objects/DC cells.CF_samples.fit.rds
    Modified:   data/intermediate_objects/DC cells.all_samples.fit.rds
    Modified:   data/intermediate_objects/macro-APOC2+.CF_samples.fit.rds
    Modified:   data/intermediate_objects/macro-APOC2+.all_samples.fit.rds
    Modified:   data/intermediate_objects/macro-CCL.CF_samples.fit.rds
    Modified:   data/intermediate_objects/macro-CCL.all_samples.fit.rds
    Modified:   data/intermediate_objects/macro-IFI27.CF_samples.fit.rds
    Modified:   data/intermediate_objects/macro-IFI27.all_samples.fit.rds
    Modified:   data/intermediate_objects/macro-alveolar.CF_samples.fit.rds
    Modified:   data/intermediate_objects/macro-alveolar.all_samples.fit.rds
    Modified:   data/intermediate_objects/macro-lipid.CF_samples.fit.rds
    Modified:   data/intermediate_objects/macro-lipid.all_samples.fit.rds
    Modified:   data/intermediate_objects/macro-monocyte-derived.CF_samples.fit.rds
    Modified:   data/intermediate_objects/macro-monocyte-derived.all_samples.fit.rds
    Modified:   data/intermediate_objects/macro-proliferating.CF_samples.fit.rds
    Modified:   data/intermediate_objects/macro-proliferating.all_samples.fit.rds
    Modified:   output/dge_analysis/CD4 T cells/CAM.FIBROSIS.CF.IVAvCF.NO_MOD.csv
    Modified:   output/dge_analysis/CD4 T cells/CAM.FIBROSIS.CF.IVAvNON_CF.CTRL.csv
    Modified:   output/dge_analysis/CD4 T cells/CAM.FIBROSIS.CF.NO_MOD.SvCF.NO_MOD.M.csv
    Modified:   output/dge_analysis/CD4 T cells/CAM.GO.CF.IVAvCF.NO_MOD.csv
    Modified:   output/dge_analysis/CD4 T cells/CAM.GO.CF.IVAvNON_CF.CTRL.csv
    Modified:   output/dge_analysis/CD4 T cells/CAM.GO.CF.NO_MOD.SvCF.NO_MOD.M.csv
    Modified:   output/dge_analysis/CD4 T cells/CAM.HALLMARK.CF.IVAvCF.NO_MOD.csv
    Modified:   output/dge_analysis/CD4 T cells/CAM.HALLMARK.CF.IVAvNON_CF.CTRL.csv
    Modified:   output/dge_analysis/CD4 T cells/CAM.HALLMARK.CF.NO_MOD.SvCF.NO_MOD.M.csv
    Modified:   output/dge_analysis/CD4 T cells/CAM.REACTOME.CF.IVAvCF.NO_MOD.csv
    Modified:   output/dge_analysis/CD4 T cells/CAM.REACTOME.CF.IVAvNON_CF.CTRL.csv
    Modified:   output/dge_analysis/CD4 T cells/CAM.REACTOME.CF.NO_MOD.SvCF.NO_MOD.M.csv
    Modified:   output/dge_analysis/CD4 T cells/CAM.WP.CF.IVAvCF.NO_MOD.csv
    Modified:   output/dge_analysis/CD4 T cells/CAM.WP.CF.IVAvNON_CF.CTRL.csv
    Modified:   output/dge_analysis/CD4 T cells/CAM.WP.CF.NO_MOD.SvCF.NO_MOD.M.csv
    Modified:   output/dge_analysis/CD4 T cells/CF.IVAvCF.NO_MOD.csv
    Modified:   output/dge_analysis/CD4 T cells/CF.IVAvNON_CF.CTRL.csv
    Modified:   output/dge_analysis/CD4 T cells/CF.NO_MOD.SvCF.NO_MOD.M.csv
    Modified:   output/dge_analysis/CD4 T cells/ORA.GO.CF.IVAvNON_CF.CTRL.csv
    Modified:   output/dge_analysis/CD4 T cells/ORA.GO.CF.NO_MOD.SvCF.NO_MOD.M.csv
    Modified:   output/dge_analysis/CD8 T cells/CAM.FIBROSIS.CF.IVAvCF.NO_MOD.csv
    Modified:   output/dge_analysis/CD8 T cells/CAM.FIBROSIS.CF.NO_MOD.SvCF.NO_MOD.M.csv
    Modified:   output/dge_analysis/CD8 T cells/CAM.FIBROSIS.CF.NO_MODvNON_CF.CTRL.csv
    Modified:   output/dge_analysis/CD8 T cells/CAM.GO.CF.IVAvCF.NO_MOD.csv
    Modified:   output/dge_analysis/CD8 T cells/CAM.GO.CF.NO_MOD.SvCF.NO_MOD.M.csv
    Modified:   output/dge_analysis/CD8 T cells/CAM.GO.CF.NO_MODvNON_CF.CTRL.csv
    Modified:   output/dge_analysis/CD8 T cells/CAM.HALLMARK.CF.IVAvCF.NO_MOD.csv
    Modified:   output/dge_analysis/CD8 T cells/CAM.HALLMARK.CF.NO_MOD.SvCF.NO_MOD.M.csv
    Modified:   output/dge_analysis/CD8 T cells/CAM.HALLMARK.CF.NO_MODvNON_CF.CTRL.csv
    Modified:   output/dge_analysis/CD8 T cells/CAM.REACTOME.CF.IVAvCF.NO_MOD.csv
    Modified:   output/dge_analysis/CD8 T cells/CAM.REACTOME.CF.NO_MOD.SvCF.NO_MOD.M.csv
    Modified:   output/dge_analysis/CD8 T cells/CAM.REACTOME.CF.NO_MODvNON_CF.CTRL.csv
    Modified:   output/dge_analysis/CD8 T cells/CAM.WP.CF.IVAvCF.NO_MOD.csv
    Modified:   output/dge_analysis/CD8 T cells/CAM.WP.CF.NO_MOD.SvCF.NO_MOD.M.csv
    Modified:   output/dge_analysis/CD8 T cells/CAM.WP.CF.NO_MODvNON_CF.CTRL.csv
    Modified:   output/dge_analysis/CD8 T cells/CF.IVAvCF.NO_MOD.csv
    Modified:   output/dge_analysis/CD8 T cells/CF.NO_MOD.SvCF.NO_MOD.M.csv
    Modified:   output/dge_analysis/CD8 T cells/CF.NO_MODvNON_CF.CTRL.csv
    Modified:   output/dge_analysis/DC cells/CAM.FIBROSIS.CF.IVAvNON_CF.CTRL.csv
    Modified:   output/dge_analysis/DC cells/CAM.FIBROSIS.CF.NO_MOD.SvCF.NO_MOD.M.csv
    Modified:   output/dge_analysis/DC cells/CAM.FIBROSIS.CF.NO_MODvNON_CF.CTRL.csv
    Modified:   output/dge_analysis/DC cells/CAM.GO.CF.IVAvNON_CF.CTRL.csv
    Modified:   output/dge_analysis/DC cells/CAM.GO.CF.NO_MOD.SvCF.NO_MOD.M.csv
    Modified:   output/dge_analysis/DC cells/CAM.GO.CF.NO_MODvNON_CF.CTRL.csv
    Modified:   output/dge_analysis/DC cells/CAM.HALLMARK.CF.IVAvNON_CF.CTRL.csv
    Modified:   output/dge_analysis/DC cells/CAM.HALLMARK.CF.NO_MOD.SvCF.NO_MOD.M.csv
    Modified:   output/dge_analysis/DC cells/CAM.HALLMARK.CF.NO_MODvNON_CF.CTRL.csv
    Modified:   output/dge_analysis/DC cells/CAM.REACTOME.CF.IVAvNON_CF.CTRL.csv
    Modified:   output/dge_analysis/DC cells/CAM.REACTOME.CF.NO_MOD.SvCF.NO_MOD.M.csv
    Modified:   output/dge_analysis/DC cells/CAM.REACTOME.CF.NO_MODvNON_CF.CTRL.csv
    Modified:   output/dge_analysis/DC cells/CAM.WP.CF.IVAvNON_CF.CTRL.csv
    Modified:   output/dge_analysis/DC cells/CAM.WP.CF.NO_MOD.SvCF.NO_MOD.M.csv
    Modified:   output/dge_analysis/DC cells/CAM.WP.CF.NO_MODvNON_CF.CTRL.csv
    Modified:   output/dge_analysis/DC cells/CF.IVAvNON_CF.CTRL.csv
    Modified:   output/dge_analysis/DC cells/CF.NO_MOD.SvCF.NO_MOD.M.csv
    Modified:   output/dge_analysis/DC cells/CF.NO_MODvNON_CF.CTRL.csv
    Modified:   output/dge_analysis/macro-APOC2+/CAM.FIBROSIS.CF.IVAvCF.NO_MOD.csv
    Modified:   output/dge_analysis/macro-APOC2+/CAM.FIBROSIS.CF.IVAvNON_CF.CTRL.csv
    Modified:   output/dge_analysis/macro-APOC2+/CAM.FIBROSIS.CF.NO_MOD.SvCF.NO_MOD.M.csv
    Modified:   output/dge_analysis/macro-APOC2+/CAM.GO.CF.IVAvCF.NO_MOD.csv
    Modified:   output/dge_analysis/macro-APOC2+/CAM.GO.CF.IVAvNON_CF.CTRL.csv
    Modified:   output/dge_analysis/macro-APOC2+/CAM.GO.CF.NO_MOD.SvCF.NO_MOD.M.csv
    Modified:   output/dge_analysis/macro-APOC2+/CAM.HALLMARK.CF.IVAvCF.NO_MOD.csv
    Modified:   output/dge_analysis/macro-APOC2+/CAM.HALLMARK.CF.IVAvNON_CF.CTRL.csv
    Modified:   output/dge_analysis/macro-APOC2+/CAM.HALLMARK.CF.NO_MOD.SvCF.NO_MOD.M.csv
    Modified:   output/dge_analysis/macro-APOC2+/CAM.REACTOME.CF.IVAvCF.NO_MOD.csv
    Modified:   output/dge_analysis/macro-APOC2+/CAM.REACTOME.CF.IVAvNON_CF.CTRL.csv
    Modified:   output/dge_analysis/macro-APOC2+/CAM.REACTOME.CF.NO_MOD.SvCF.NO_MOD.M.csv
    Modified:   output/dge_analysis/macro-APOC2+/CAM.WP.CF.IVAvCF.NO_MOD.csv
    Modified:   output/dge_analysis/macro-APOC2+/CAM.WP.CF.IVAvNON_CF.CTRL.csv
    Modified:   output/dge_analysis/macro-APOC2+/CAM.WP.CF.NO_MOD.SvCF.NO_MOD.M.csv
    Modified:   output/dge_analysis/macro-APOC2+/CF.IVAvCF.NO_MOD.csv
    Modified:   output/dge_analysis/macro-APOC2+/CF.IVAvNON_CF.CTRL.csv
    Modified:   output/dge_analysis/macro-APOC2+/CF.NO_MOD.SvCF.NO_MOD.M.csv
    Modified:   output/dge_analysis/macro-CCL/CAM.FIBROSIS.CF.IVAvCF.NO_MOD.csv
    Modified:   output/dge_analysis/macro-CCL/CAM.FIBROSIS.CF.IVAvNON_CF.CTRL.csv
    Modified:   output/dge_analysis/macro-CCL/CAM.FIBROSIS.CF.NO_MOD.SvCF.NO_MOD.M.csv
    Modified:   output/dge_analysis/macro-CCL/CAM.FIBROSIS.CF.NO_MODvNON_CF.CTRL.csv
    Modified:   output/dge_analysis/macro-CCL/CAM.GO.CF.IVAvCF.NO_MOD.csv
    Modified:   output/dge_analysis/macro-CCL/CAM.GO.CF.IVAvNON_CF.CTRL.csv
    Modified:   output/dge_analysis/macro-CCL/CAM.GO.CF.NO_MOD.SvCF.NO_MOD.M.csv
    Modified:   output/dge_analysis/macro-CCL/CAM.GO.CF.NO_MODvNON_CF.CTRL.csv
    Modified:   output/dge_analysis/macro-CCL/CAM.HALLMARK.CF.IVAvCF.NO_MOD.csv
    Modified:   output/dge_analysis/macro-CCL/CAM.HALLMARK.CF.IVAvNON_CF.CTRL.csv
    Modified:   output/dge_analysis/macro-CCL/CAM.HALLMARK.CF.NO_MOD.SvCF.NO_MOD.M.csv
    Modified:   output/dge_analysis/macro-CCL/CAM.HALLMARK.CF.NO_MODvNON_CF.CTRL.csv
    Modified:   output/dge_analysis/macro-CCL/CAM.REACTOME.CF.IVAvCF.NO_MOD.csv
    Modified:   output/dge_analysis/macro-CCL/CAM.REACTOME.CF.IVAvNON_CF.CTRL.csv
    Modified:   output/dge_analysis/macro-CCL/CAM.REACTOME.CF.NO_MOD.SvCF.NO_MOD.M.csv
    Modified:   output/dge_analysis/macro-CCL/CAM.REACTOME.CF.NO_MODvNON_CF.CTRL.csv
    Modified:   output/dge_analysis/macro-CCL/CAM.WP.CF.IVAvCF.NO_MOD.csv
    Modified:   output/dge_analysis/macro-CCL/CAM.WP.CF.IVAvNON_CF.CTRL.csv
    Modified:   output/dge_analysis/macro-CCL/CAM.WP.CF.NO_MOD.SvCF.NO_MOD.M.csv
    Modified:   output/dge_analysis/macro-CCL/CAM.WP.CF.NO_MODvNON_CF.CTRL.csv
    Modified:   output/dge_analysis/macro-CCL/CF.IVAvCF.NO_MOD.csv
    Modified:   output/dge_analysis/macro-CCL/CF.IVAvNON_CF.CTRL.csv
    Modified:   output/dge_analysis/macro-CCL/CF.NO_MOD.SvCF.NO_MOD.M.csv
    Modified:   output/dge_analysis/macro-CCL/CF.NO_MODvNON_CF.CTRL.csv
    Modified:   output/dge_analysis/macro-IFI27/CAM.FIBROSIS.CF.IVAvCF.NO_MOD.csv
    Modified:   output/dge_analysis/macro-IFI27/CAM.FIBROSIS.CF.IVAvNON_CF.CTRL.csv
    Modified:   output/dge_analysis/macro-IFI27/CAM.FIBROSIS.CF.NO_MOD.SvCF.NO_MOD.M.csv
    Modified:   output/dge_analysis/macro-IFI27/CAM.FIBROSIS.CF.NO_MODvNON_CF.CTRL.csv
    Modified:   output/dge_analysis/macro-IFI27/CAM.GO.CF.IVAvCF.NO_MOD.csv
    Modified:   output/dge_analysis/macro-IFI27/CAM.GO.CF.IVAvNON_CF.CTRL.csv
    Modified:   output/dge_analysis/macro-IFI27/CAM.GO.CF.NO_MOD.SvCF.NO_MOD.M.csv
    Modified:   output/dge_analysis/macro-IFI27/CAM.GO.CF.NO_MODvNON_CF.CTRL.csv
    Modified:   output/dge_analysis/macro-IFI27/CAM.HALLMARK.CF.IVAvCF.NO_MOD.csv
    Modified:   output/dge_analysis/macro-IFI27/CAM.HALLMARK.CF.IVAvNON_CF.CTRL.csv
    Modified:   output/dge_analysis/macro-IFI27/CAM.HALLMARK.CF.NO_MOD.SvCF.NO_MOD.M.csv
    Modified:   output/dge_analysis/macro-IFI27/CAM.HALLMARK.CF.NO_MODvNON_CF.CTRL.csv
    Modified:   output/dge_analysis/macro-IFI27/CAM.REACTOME.CF.IVAvCF.NO_MOD.csv
    Modified:   output/dge_analysis/macro-IFI27/CAM.REACTOME.CF.IVAvNON_CF.CTRL.csv
    Modified:   output/dge_analysis/macro-IFI27/CAM.REACTOME.CF.NO_MOD.SvCF.NO_MOD.M.csv
    Modified:   output/dge_analysis/macro-IFI27/CAM.REACTOME.CF.NO_MODvNON_CF.CTRL.csv
    Modified:   output/dge_analysis/macro-IFI27/CAM.WP.CF.IVAvCF.NO_MOD.csv
    Modified:   output/dge_analysis/macro-IFI27/CAM.WP.CF.IVAvNON_CF.CTRL.csv
    Modified:   output/dge_analysis/macro-IFI27/CAM.WP.CF.NO_MOD.SvCF.NO_MOD.M.csv
    Modified:   output/dge_analysis/macro-IFI27/CAM.WP.CF.NO_MODvNON_CF.CTRL.csv
    Modified:   output/dge_analysis/macro-IFI27/CF.IVAvCF.NO_MOD.csv
    Modified:   output/dge_analysis/macro-IFI27/CF.IVAvNON_CF.CTRL.csv
    Modified:   output/dge_analysis/macro-IFI27/CF.NO_MOD.SvCF.NO_MOD.M.csv
    Modified:   output/dge_analysis/macro-IFI27/CF.NO_MODvNON_CF.CTRL.csv
    Modified:   output/dge_analysis/macro-IFI27/ORA.HALLMARK.CF.IVAvNON_CF.CTRL.csv
    Modified:   output/dge_analysis/macro-alveolar/CAM.FIBROSIS.CF.IVAvCF.NO_MOD.csv
    Modified:   output/dge_analysis/macro-alveolar/CAM.FIBROSIS.CF.IVAvNON_CF.CTRL.csv
    Modified:   output/dge_analysis/macro-alveolar/CAM.FIBROSIS.CF.NO_MOD.SvCF.NO_MOD.M.csv
    Modified:   output/dge_analysis/macro-alveolar/CAM.FIBROSIS.CF.NO_MODvNON_CF.CTRL.csv
    Modified:   output/dge_analysis/macro-alveolar/CAM.GO.CF.IVAvCF.NO_MOD.csv
    Modified:   output/dge_analysis/macro-alveolar/CAM.GO.CF.IVAvNON_CF.CTRL.csv
    Modified:   output/dge_analysis/macro-alveolar/CAM.GO.CF.NO_MOD.SvCF.NO_MOD.M.csv
    Modified:   output/dge_analysis/macro-alveolar/CAM.GO.CF.NO_MODvNON_CF.CTRL.csv
    Modified:   output/dge_analysis/macro-alveolar/CAM.HALLMARK.CF.IVAvCF.NO_MOD.csv
    Modified:   output/dge_analysis/macro-alveolar/CAM.HALLMARK.CF.IVAvNON_CF.CTRL.csv
    Modified:   output/dge_analysis/macro-alveolar/CAM.HALLMARK.CF.NO_MOD.SvCF.NO_MOD.M.csv
    Modified:   output/dge_analysis/macro-alveolar/CAM.HALLMARK.CF.NO_MODvNON_CF.CTRL.csv
    Modified:   output/dge_analysis/macro-alveolar/CAM.REACTOME.CF.IVAvCF.NO_MOD.csv
    Modified:   output/dge_analysis/macro-alveolar/CAM.REACTOME.CF.IVAvNON_CF.CTRL.csv
    Modified:   output/dge_analysis/macro-alveolar/CAM.REACTOME.CF.NO_MOD.SvCF.NO_MOD.M.csv
    Modified:   output/dge_analysis/macro-alveolar/CAM.REACTOME.CF.NO_MODvNON_CF.CTRL.csv
    Modified:   output/dge_analysis/macro-alveolar/CAM.WP.CF.IVAvCF.NO_MOD.csv
    Modified:   output/dge_analysis/macro-alveolar/CAM.WP.CF.IVAvNON_CF.CTRL.csv
    Modified:   output/dge_analysis/macro-alveolar/CAM.WP.CF.NO_MOD.SvCF.NO_MOD.M.csv
    Modified:   output/dge_analysis/macro-alveolar/CAM.WP.CF.NO_MODvNON_CF.CTRL.csv
    Modified:   output/dge_analysis/macro-alveolar/CF.IVAvCF.NO_MOD.csv
    Modified:   output/dge_analysis/macro-alveolar/CF.IVAvNON_CF.CTRL.csv
    Modified:   output/dge_analysis/macro-alveolar/CF.NO_MOD.SvCF.NO_MOD.M.csv
    Modified:   output/dge_analysis/macro-alveolar/CF.NO_MODvNON_CF.CTRL.csv
    Modified:   output/dge_analysis/macro-alveolar/ORA.REACTOME.CF.NO_MODvNON_CF.CTRL.csv
    Modified:   output/dge_analysis/macro-alveolar/ORA.WP.CF.IVAvCF.NO_MOD.csv
    Modified:   output/dge_analysis/macro-lipid/CAM.FIBROSIS.CF.IVAvCF.NO_MOD.csv
    Modified:   output/dge_analysis/macro-lipid/CAM.FIBROSIS.CF.IVAvNON_CF.CTRL.csv
    Modified:   output/dge_analysis/macro-lipid/CAM.FIBROSIS.CF.NO_MOD.SvCF.NO_MOD.M.csv
    Modified:   output/dge_analysis/macro-lipid/CAM.FIBROSIS.CF.NO_MODvNON_CF.CTRL.csv
    Modified:   output/dge_analysis/macro-lipid/CAM.GO.CF.IVAvCF.NO_MOD.csv
    Modified:   output/dge_analysis/macro-lipid/CAM.GO.CF.IVAvNON_CF.CTRL.csv
    Modified:   output/dge_analysis/macro-lipid/CAM.GO.CF.NO_MOD.SvCF.NO_MOD.M.csv
    Modified:   output/dge_analysis/macro-lipid/CAM.GO.CF.NO_MODvNON_CF.CTRL.csv
    Modified:   output/dge_analysis/macro-lipid/CAM.HALLMARK.CF.IVAvCF.NO_MOD.csv
    Modified:   output/dge_analysis/macro-lipid/CAM.HALLMARK.CF.IVAvNON_CF.CTRL.csv
    Modified:   output/dge_analysis/macro-lipid/CAM.HALLMARK.CF.NO_MOD.SvCF.NO_MOD.M.csv
    Modified:   output/dge_analysis/macro-lipid/CAM.HALLMARK.CF.NO_MODvNON_CF.CTRL.csv
    Modified:   output/dge_analysis/macro-lipid/CAM.REACTOME.CF.IVAvCF.NO_MOD.csv
    Modified:   output/dge_analysis/macro-lipid/CAM.REACTOME.CF.IVAvNON_CF.CTRL.csv
    Modified:   output/dge_analysis/macro-lipid/CAM.REACTOME.CF.NO_MOD.SvCF.NO_MOD.M.csv
    Modified:   output/dge_analysis/macro-lipid/CAM.REACTOME.CF.NO_MODvNON_CF.CTRL.csv
    Modified:   output/dge_analysis/macro-lipid/CAM.WP.CF.IVAvCF.NO_MOD.csv
    Modified:   output/dge_analysis/macro-lipid/CAM.WP.CF.IVAvNON_CF.CTRL.csv
    Modified:   output/dge_analysis/macro-lipid/CAM.WP.CF.NO_MOD.SvCF.NO_MOD.M.csv
    Modified:   output/dge_analysis/macro-lipid/CAM.WP.CF.NO_MODvNON_CF.CTRL.csv
    Modified:   output/dge_analysis/macro-lipid/CF.IVAvCF.NO_MOD.csv
    Modified:   output/dge_analysis/macro-lipid/CF.IVAvNON_CF.CTRL.csv
    Modified:   output/dge_analysis/macro-lipid/CF.NO_MOD.SvCF.NO_MOD.M.csv
    Modified:   output/dge_analysis/macro-lipid/CF.NO_MODvNON_CF.CTRL.csv
    Modified:   output/dge_analysis/macro-lipid/ORA.GO.CF.IVAvCF.NO_MOD.csv
    Modified:   output/dge_analysis/macro-lipid/ORA.REACTOME.CF.IVAvCF.NO_MOD.csv
    Modified:   output/dge_analysis/macro-lipid/ORA.WP.CF.IVAvCF.NO_MOD.csv
    Modified:   output/dge_analysis/macro-monocyte-derived/CAM.FIBROSIS.CF.IVAvCF.NO_MOD.csv
    Modified:   output/dge_analysis/macro-monocyte-derived/CAM.FIBROSIS.CF.IVAvNON_CF.CTRL.csv
    Modified:   output/dge_analysis/macro-monocyte-derived/CAM.FIBROSIS.CF.NO_MOD.SvCF.NO_MOD.M.csv
    Modified:   output/dge_analysis/macro-monocyte-derived/CAM.FIBROSIS.CF.NO_MODvNON_CF.CTRL.csv
    Modified:   output/dge_analysis/macro-monocyte-derived/CAM.GO.CF.IVAvCF.NO_MOD.csv
    Modified:   output/dge_analysis/macro-monocyte-derived/CAM.GO.CF.IVAvNON_CF.CTRL.csv
    Modified:   output/dge_analysis/macro-monocyte-derived/CAM.GO.CF.NO_MOD.SvCF.NO_MOD.M.csv
    Modified:   output/dge_analysis/macro-monocyte-derived/CAM.GO.CF.NO_MODvNON_CF.CTRL.csv
    Modified:   output/dge_analysis/macro-monocyte-derived/CAM.HALLMARK.CF.IVAvCF.NO_MOD.csv
    Modified:   output/dge_analysis/macro-monocyte-derived/CAM.HALLMARK.CF.IVAvNON_CF.CTRL.csv
    Modified:   output/dge_analysis/macro-monocyte-derived/CAM.HALLMARK.CF.NO_MOD.SvCF.NO_MOD.M.csv
    Modified:   output/dge_analysis/macro-monocyte-derived/CAM.HALLMARK.CF.NO_MODvNON_CF.CTRL.csv
    Modified:   output/dge_analysis/macro-monocyte-derived/CAM.REACTOME.CF.IVAvCF.NO_MOD.csv
    Modified:   output/dge_analysis/macro-monocyte-derived/CAM.REACTOME.CF.IVAvNON_CF.CTRL.csv
    Modified:   output/dge_analysis/macro-monocyte-derived/CAM.REACTOME.CF.NO_MOD.SvCF.NO_MOD.M.csv
    Modified:   output/dge_analysis/macro-monocyte-derived/CAM.REACTOME.CF.NO_MODvNON_CF.CTRL.csv
    Modified:   output/dge_analysis/macro-monocyte-derived/CAM.WP.CF.IVAvCF.NO_MOD.csv
    Modified:   output/dge_analysis/macro-monocyte-derived/CAM.WP.CF.IVAvNON_CF.CTRL.csv
    Modified:   output/dge_analysis/macro-monocyte-derived/CAM.WP.CF.NO_MOD.SvCF.NO_MOD.M.csv
    Modified:   output/dge_analysis/macro-monocyte-derived/CAM.WP.CF.NO_MODvNON_CF.CTRL.csv
    Modified:   output/dge_analysis/macro-monocyte-derived/CF.IVAvCF.NO_MOD.csv
    Modified:   output/dge_analysis/macro-monocyte-derived/CF.IVAvNON_CF.CTRL.csv
    Modified:   output/dge_analysis/macro-monocyte-derived/CF.NO_MOD.SvCF.NO_MOD.M.csv
    Modified:   output/dge_analysis/macro-monocyte-derived/CF.NO_MODvNON_CF.CTRL.csv
    Modified:   output/dge_analysis/macro-monocyte-derived/ORA.GO.CF.NO_MODvNON_CF.CTRL.csv
    Modified:   output/dge_analysis/macro-monocyte-derived/ORA.REACTOME.CF.NO_MODvNON_CF.CTRL.csv
    Modified:   output/dge_analysis/macro-proliferating/CAM.FIBROSIS.CF.IVAvCF.NO_MOD.csv
    Modified:   output/dge_analysis/macro-proliferating/CAM.FIBROSIS.CF.NO_MOD.SvCF.NO_MOD.M.csv
    Modified:   output/dge_analysis/macro-proliferating/CAM.FIBROSIS.CF.NO_MODvNON_CF.CTRL.csv
    Modified:   output/dge_analysis/macro-proliferating/CAM.GO.CF.IVAvCF.NO_MOD.csv
    Modified:   output/dge_analysis/macro-proliferating/CAM.GO.CF.NO_MOD.SvCF.NO_MOD.M.csv
    Modified:   output/dge_analysis/macro-proliferating/CAM.GO.CF.NO_MODvNON_CF.CTRL.csv
    Modified:   output/dge_analysis/macro-proliferating/CAM.HALLMARK.CF.IVAvCF.NO_MOD.csv
    Modified:   output/dge_analysis/macro-proliferating/CAM.HALLMARK.CF.NO_MOD.SvCF.NO_MOD.M.csv
    Modified:   output/dge_analysis/macro-proliferating/CAM.HALLMARK.CF.NO_MODvNON_CF.CTRL.csv
    Modified:   output/dge_analysis/macro-proliferating/CAM.REACTOME.CF.IVAvCF.NO_MOD.csv
    Modified:   output/dge_analysis/macro-proliferating/CAM.REACTOME.CF.NO_MOD.SvCF.NO_MOD.M.csv
    Modified:   output/dge_analysis/macro-proliferating/CAM.REACTOME.CF.NO_MODvNON_CF.CTRL.csv
    Modified:   output/dge_analysis/macro-proliferating/CAM.WP.CF.IVAvCF.NO_MOD.csv
    Modified:   output/dge_analysis/macro-proliferating/CAM.WP.CF.NO_MOD.SvCF.NO_MOD.M.csv
    Modified:   output/dge_analysis/macro-proliferating/CAM.WP.CF.NO_MODvNON_CF.CTRL.csv
    Modified:   output/dge_analysis/macro-proliferating/CF.IVAvCF.NO_MOD.csv
    Modified:   output/dge_analysis/macro-proliferating/CF.NO_MOD.SvCF.NO_MOD.M.csv
    Modified:   output/dge_analysis/macro-proliferating/CF.NO_MODvNON_CF.CTRL.csv
    Modified:   output/dge_analysis/macro-proliferating/ORA.GO.CF.IVAvCF.NO_MOD.csv
    Modified:   output/dge_analysis/macro-proliferating/ORA.REACTOME.CF.IVAvCF.NO_MOD.csv
    Modified:   output/dge_analysis/macro-proliferating/ORA.WP.CF.NO_MOD.SvCF.NO_MOD.M.csv
    Modified:   output/dge_analysis/macrophages/CAM.FIBROSIS.CF.IVAvCF.NO_MOD.csv
    Modified:   output/dge_analysis/macrophages/CAM.FIBROSIS.CF.IVAvNON_CF.CTRL.csv
    Modified:   output/dge_analysis/macrophages/CAM.FIBROSIS.CF.LUMA_IVAvCF.NO_MOD.csv
    Modified:   output/dge_analysis/macrophages/CAM.FIBROSIS.CF.NO_MOD.SvCF.NO_MOD.M.csv
    Modified:   output/dge_analysis/macrophages/CAM.FIBROSIS.CF.NO_MODvNON_CF.CTRL.csv
    Modified:   output/dge_analysis/macrophages/CAM.GO.CF.IVAvCF.NO_MOD.csv
    Modified:   output/dge_analysis/macrophages/CAM.GO.CF.IVAvNON_CF.CTRL.csv
    Modified:   output/dge_analysis/macrophages/CAM.GO.CF.LUMA_IVAvCF.NO_MOD.csv
    Modified:   output/dge_analysis/macrophages/CAM.GO.CF.NO_MOD.SvCF.NO_MOD.M.csv
    Modified:   output/dge_analysis/macrophages/CAM.GO.CF.NO_MODvNON_CF.CTRL.csv
    Modified:   output/dge_analysis/macrophages/CAM.HALLMARK.CF.IVAvCF.NO_MOD.csv
    Modified:   output/dge_analysis/macrophages/CAM.HALLMARK.CF.IVAvNON_CF.CTRL.csv
    Modified:   output/dge_analysis/macrophages/CAM.HALLMARK.CF.LUMA_IVAvCF.NO_MOD.csv
    Modified:   output/dge_analysis/macrophages/CAM.HALLMARK.CF.NO_MOD.SvCF.NO_MOD.M.csv
    Modified:   output/dge_analysis/macrophages/CAM.HALLMARK.CF.NO_MODvNON_CF.CTRL.csv
    Modified:   output/dge_analysis/macrophages/CAM.REACTOME.CF.IVAvCF.NO_MOD.csv
    Modified:   output/dge_analysis/macrophages/CAM.REACTOME.CF.IVAvNON_CF.CTRL.csv
    Modified:   output/dge_analysis/macrophages/CAM.REACTOME.CF.LUMA_IVAvCF.NO_MOD.csv
    Modified:   output/dge_analysis/macrophages/CAM.REACTOME.CF.NO_MOD.SvCF.NO_MOD.M.csv
    Modified:   output/dge_analysis/macrophages/CAM.REACTOME.CF.NO_MODvNON_CF.CTRL.csv
    Modified:   output/dge_analysis/macrophages/CAM.WP.CF.IVAvCF.NO_MOD.csv
    Modified:   output/dge_analysis/macrophages/CAM.WP.CF.IVAvNON_CF.CTRL.csv
    Modified:   output/dge_analysis/macrophages/CAM.WP.CF.LUMA_IVAvCF.NO_MOD.csv
    Modified:   output/dge_analysis/macrophages/CAM.WP.CF.NO_MOD.SvCF.NO_MOD.M.csv
    Modified:   output/dge_analysis/macrophages/CAM.WP.CF.NO_MODvNON_CF.CTRL.csv
    Modified:   output/dge_analysis/macrophages/CF.IVAvCF.NO_MOD.csv
    Modified:   output/dge_analysis/macrophages/CF.IVAvNON_CF.CTRL.csv
    Modified:   output/dge_analysis/macrophages/CF.LUMA_IVAvCF.NO_MOD.csv
    Modified:   output/dge_analysis/macrophages/CF.NO_MOD.SvCF.NO_MOD.M.csv
    Modified:   output/dge_analysis/macrophages/CF.NO_MODvNON_CF.CTRL.csv
    Modified:   output/dge_analysis/macrophages/ORA.GO.CF.IVAvNON_CF.CTRL.csv
    Modified:   output/dge_analysis/macrophages/ORA.GO.CF.NO_MOD.SvCF.NO_MOD.M.csv
    Modified:   output/dge_analysis/macrophages/ORA.GO.CF.NO_MODvNON_CF.CTRL.csv
    Modified:   output/dge_analysis/macrophages/ORA.HALLMARK.CF.IVAvCF.NO_MOD.csv
    Modified:   output/dge_analysis/macrophages/ORA.REACTOME.CF.NO_MODvNON_CF.CTRL.csv
Note that any generated files, e.g. HTML, png, CSS, etc., are not included in this status report because it is ok for generated content to have uncommitted changes.
These are the previous versions of the repository in which changes were
made to the R Markdown
(analysis/15.0_proportions_analysis_ann_level_1.Rmd) and
HTML (docs/15.0_proportions_analysis_ann_level_1.html)
files. If you’ve configured a remote Git repository (see
?wflow_git_remote), click on the hyperlinks in the table
below to view the files as they were in that past version.
| File | Version | Author | Date | Message |
|---|---|---|---|---|
| Rmd | d9dfda4 | Jovana Maksimovic | 2026-04-02 | wflow_publish("analysis/15.0_proportions_analysis_ann_level_1.Rmd") |
| html | c0ab3ad | Jovana Maksimovic | 2024-12-31 | Build site. |
| Rmd | 72fe190 | Jovana Maksimovic | 2024-12-31 | wflow_publish("analysis/15.0_proportions_analysis_ann_level_1.Rmd") |
| html | 7ae0444 | Jovana Maksimovic | 2024-12-24 | Build site. |
| Rmd | ff4fd99 | Jovana Maksimovic | 2024-12-24 | wflow_publish("analysis/15.0_proportions_analysis_ann_level_1.Rmd") |
Load libraries
suppressPackageStartupMessages({
  library(SingleCellExperiment)
  library(edgeR)
  library(tidyverse)
  library(ggplot2)
  library(Seurat)
  library(glmGamPoi)
  library(dittoSeq)
  library(clustree)
  library(AnnotationDbi)
  library(org.Hs.eg.db)
  library(glue)
  library(speckle)
  library(patchwork)
  library(paletteer)
  library(tidyHeatmap)
  library(here)
})

set.seed(42)
options(scipen=999)
options(future.globals.maxSize = 6500 * 1024^2)
Load Data
files <- list.files(here("data/C133_Neeland_merged"),
                    pattern = "C133_Neeland_full_clean.*(macrophages|t_cells|other_cells)_annotated_diet.SEU.rds",
                    full.names = TRUE)

seuLst <- lapply(files[2:4], function(f) readRDS(f))

seu <- merge(seuLst[[1]],
             y = c(seuLst[[2]],
                   seuLst[[3]]))
seu
An object of class Seurat
21568 features across 194407 samples within 1 assay
Active assay: RNA (21568 features, 0 variable features) used (Mb) gc trigger (Mb) limit (Mb) max used (Mb)
Ncells 10365771 553.6 18172281 970.6 NA 13228927 706.6
Vcells 1351249086 10309.3 3689717625 28150.4 65536 3548586771 27073.6Analyse Cell type proportions
# Differences in cell type proportions
props <- getTransformedProps(clusters = seu$ann_level_1,
                             sample = seu$sample.id, transform="asin")
props$Proportions %>% knitr::kable()| sample_1.1 | sample_15.1 | sample_16.1 | sample_17.1 | sample_18.1 | sample_19.1 | sample_2.1 | sample_20.1 | sample_21.1 | sample_22.1 | sample_23.1 | sample_24.1 | sample_25.1 | sample_26.1 | sample_27.1 | sample_28.1 | sample_29.1 | sample_3.1 | sample_30.1 | sample_31.1 | sample_32.1 | sample_33.1 | sample_34.1 | sample_34.2 | sample_34.3 | sample_35.1 | sample_35.2 | sample_36.1 | sample_36.2 | sample_37.1 | sample_37.2 | sample_37.3 | sample_38.1 | sample_38.2 | sample_38.3 | sample_39.1 | sample_39.2 | sample_4.1 | sample_40.1 | sample_41.1 | sample_42.1 | sample_43.1 | sample_5.1 | sample_6.1 | sample_7.1 | |
|---|---|---|---|---|---|---|---|---|---|---|---|---|---|---|---|---|---|---|---|---|---|---|---|---|---|---|---|---|---|---|---|---|---|---|---|---|---|---|---|---|---|---|---|---|---|
| B cells | 0.0223723 | 0.0071704 | 0.0018883 | 0.0428725 | 0.0015235 | 0.0023866 | 0.0950689 | 0.0017933 | 0.0095134 | 0.0023447 | 0.2436149 | 0.0057254 | 0.0027506 | 0.0122549 | 0.0020268 | 0.0006984 | 0.0918367 | 0.0119505 | 0.0064935 | 0.0041667 | 0.0027000 | 0.0607761 | 0.0026738 | 0.0000000 | 0.0016584 | 0.0181452 | 0.0081239 | 0.0304653 | 0.0502624 | 0.0069589 | 0.0124824 | 0.0105605 | 0.0048374 | 0.0058787 | 0.0356175 | 0.0434431 | 0.0275087 | 0.0096690 | 0.1603532 | 0.0202830 | 0.0107823 | 0.0427193 | 0.0181922 | 0.0046205 | 0.0282528 |
| CD4 T cells | 0.0092866 | 0.0275786 | 0.0129485 | 0.0176849 | 0.0082267 | 0.0023866 | 0.0364283 | 0.0087101 | 0.0192097 | 0.0082063 | 0.1650295 | 0.0262504 | 0.0174205 | 0.0323529 | 0.0133766 | 0.0060064 | 0.0299745 | 0.0061886 | 0.1911977 | 0.0722222 | 0.0155248 | 0.1547452 | 0.0113636 | 0.0051207 | 0.0035537 | 0.0173387 | 0.0164368 | 0.0113827 | 0.0425297 | 0.0153097 | 0.0163076 | 0.0268075 | 0.0056436 | 0.0102104 | 0.0274874 | 0.0250944 | 0.0585045 | 0.0106607 | 0.1119339 | 0.0521226 | 0.0361976 | 0.0390446 | 0.0801592 | 0.0137671 | 0.0381306 |
| CD8 T cells | 0.0063318 | 0.0295091 | 0.0283248 | 0.0353698 | 0.0164534 | 0.0011933 | 0.0510884 | 0.0098629 | 0.0179290 | 0.0095252 | 0.1277014 | 0.0310036 | 0.0134474 | 0.0308824 | 0.0267531 | 0.0153653 | 0.0586735 | 0.0091763 | 0.0977633 | 0.0949074 | 0.0175498 | 0.1280972 | 0.0100267 | 0.0029261 | 0.0052120 | 0.0203629 | 0.0102022 | 0.0033478 | 0.0248550 | 0.0146138 | 0.0074492 | 0.0199025 | 0.0037624 | 0.0049505 | 0.0251645 | 0.0070157 | 0.0730337 | 0.0254122 | 0.0780404 | 0.0662736 | 0.0866982 | 0.1748966 | 0.0949403 | 0.0271570 | 0.0380244 |
| DC cells | 0.0097087 | 0.0184777 | 0.0037766 | 0.0391211 | 0.0173675 | 0.0055688 | 0.0017770 | 0.0067888 | 0.0080498 | 0.0016120 | 0.0628684 | 0.0398617 | 0.0201711 | 0.0230392 | 0.0162140 | 0.0065652 | 0.0440051 | 0.0147247 | 0.0497835 | 0.0157407 | 0.0121498 | 0.0719963 | 0.0788770 | 0.0643745 | 0.0322199 | 0.0219758 | 0.0251275 | 0.0348175 | 0.0544049 | 0.0073069 | 0.0062412 | 0.0048741 | 0.0010750 | 0.0024752 | 0.0081301 | 0.0232056 | 0.0350639 | 0.0126441 | 0.0185132 | 0.0570755 | 0.0064914 | 0.0705099 | 0.0204662 | 0.0045262 | 0.0059480 |
| dividing innate cells | 0.0000000 | 0.0002758 | 0.0002698 | 0.0024116 | 0.0006094 | 0.0003978 | 0.0093292 | 0.0002562 | 0.0000000 | 0.0000000 | 0.0108055 | 0.0012963 | 0.0006112 | 0.0000000 | 0.0000000 | 0.0001397 | 0.0031888 | 0.0006402 | 0.0003608 | 0.0000000 | 0.0003375 | 0.0032726 | 0.0013369 | 0.0000000 | 0.0002369 | 0.0002016 | 0.0001889 | 0.0016739 | 0.0008285 | 0.0000000 | 0.0000000 | 0.0004062 | 0.0000000 | 0.0003094 | 0.0011614 | 0.0035078 | 0.0017435 | 0.0006198 | 0.0034178 | 0.0023585 | 0.0003301 | 0.0026412 | 0.0000000 | 0.0000000 | 0.0001062 |
| epithelial cells | 0.0426340 | 0.0132377 | 0.0005395 | 0.0032154 | 0.0053321 | 0.0019889 | 0.1537095 | 0.0043551 | 0.0104281 | 0.0038101 | 0.2092338 | 0.0034568 | 0.0006112 | 0.0034314 | 0.0275638 | 0.0006984 | 0.0446429 | 0.0017072 | 0.0010823 | 0.0018519 | 0.0000000 | 0.0219729 | 0.0093583 | 0.0087783 | 0.0037906 | 0.0094758 | 0.0094464 | 0.0077000 | 0.0038663 | 0.0076548 | 0.0020133 | 0.0052803 | 0.0016125 | 0.0018564 | 0.0154859 | 0.0029682 | 0.0069740 | 0.0032230 | 0.0287667 | 0.0188679 | 0.0083618 | 0.0096463 | 0.0062536 | 0.0012258 | 0.0011683 |
| gamma delta T cells | 0.0000000 | 0.0005516 | 0.0008093 | 0.0008039 | 0.0003047 | 0.0000000 | 0.0000000 | 0.0003843 | 0.0007318 | 0.0000000 | 0.0000000 | 0.0003241 | 0.0006112 | 0.0004902 | 0.0012161 | 0.0001397 | 0.0000000 | 0.0000000 | 0.0223665 | 0.0064815 | 0.0003375 | 0.0014025 | 0.0000000 | 0.0000000 | 0.0000000 | 0.0002016 | 0.0000000 | 0.0003348 | 0.0000000 | 0.0010438 | 0.0000000 | 0.0000000 | 0.0000000 | 0.0003094 | 0.0038715 | 0.0002698 | 0.0027121 | 0.0000000 | 0.0133865 | 0.0025943 | 0.0027506 | 0.0014929 | 0.0005685 | 0.0000000 | 0.0009559 |
| innate lymphocyte | 0.0029548 | 0.0353006 | 0.0045859 | 0.0077706 | 0.0039610 | 0.0023866 | 0.0075522 | 0.0019214 | 0.0012806 | 0.0038101 | 0.0245580 | 0.0046451 | 0.0058068 | 0.0083333 | 0.0044589 | 0.0006984 | 0.0082908 | 0.0014938 | 0.0339105 | 0.0129630 | 0.0006750 | 0.0144928 | 0.0006684 | 0.0007315 | 0.0016584 | 0.0036290 | 0.0039675 | 0.0006696 | 0.0138083 | 0.0013918 | 0.0018120 | 0.0020309 | 0.0002687 | 0.0003094 | 0.0046458 | 0.0010793 | 0.0048431 | 0.0047105 | 0.0179436 | 0.0158019 | 0.0366377 | 0.0142398 | 0.0136441 | 0.0071664 | 0.0023367 |
| macrophages | 0.8518362 | 0.8019857 | 0.9072026 | 0.7607181 | 0.8740098 | 0.9240255 | 0.6010662 | 0.9126425 | 0.8940724 | 0.9422626 | 0.1070727 | 0.7980987 | 0.8719438 | 0.8401961 | 0.8479935 | 0.9353262 | 0.6696429 | 0.9026889 | 0.5313853 | 0.7277778 | 0.8876139 | 0.4684432 | 0.8288770 | 0.8580834 | 0.8995499 | 0.8252016 | 0.8730399 | 0.7937730 | 0.7321182 | 0.9060543 | 0.8969197 | 0.9102356 | 0.9180328 | 0.9260520 | 0.8180410 | 0.8345926 | 0.7268501 | 0.8098426 | 0.5351752 | 0.7023585 | 0.7680713 | 0.5799265 | 0.7072200 | 0.8938237 | 0.8326075 |
| mast cells | 0.0000000 | 0.0000000 | 0.0000000 | 0.0005359 | 0.0001523 | 0.0000000 | 0.0008885 | 0.0000000 | 0.0000000 | 0.0000000 | 0.0098232 | 0.0001080 | 0.0012225 | 0.0014706 | 0.0008107 | 0.0000000 | 0.0063776 | 0.0000000 | 0.0007215 | 0.0023148 | 0.0000000 | 0.0112202 | 0.0000000 | 0.0000000 | 0.0004738 | 0.0004032 | 0.0003779 | 0.0010044 | 0.0000000 | 0.0000000 | 0.0000000 | 0.0004062 | 0.0002687 | 0.0000000 | 0.0007743 | 0.0002698 | 0.0001937 | 0.0021074 | 0.0000000 | 0.0000000 | 0.0000000 | 0.0000000 | 0.0005685 | 0.0000000 | 0.0000000 |
| monocytes | 0.0113972 | 0.0013789 | 0.0013488 | 0.0200965 | 0.0195003 | 0.0023866 | 0.0035540 | 0.0044832 | 0.0012806 | 0.0013189 | 0.0098232 | 0.0468834 | 0.0097800 | 0.0127451 | 0.0097284 | 0.0108954 | 0.0114796 | 0.0134443 | 0.0119048 | 0.0087963 | 0.0155248 | 0.0107527 | 0.0106952 | 0.0065838 | 0.0073442 | 0.0217742 | 0.0171925 | 0.0133914 | 0.0265120 | 0.0059151 | 0.0094625 | 0.0064988 | 0.0037624 | 0.0046411 | 0.0061943 | 0.0218564 | 0.0240217 | 0.1063592 | 0.0005696 | 0.0073113 | 0.0061613 | 0.0297428 | 0.0187607 | 0.0086752 | 0.0065852 |
| neutrophils | 0.0000000 | 0.0000000 | 0.0000000 | 0.0056270 | 0.0012188 | 0.0000000 | 0.0000000 | 0.0001281 | 0.0000000 | 0.0000000 | 0.0108055 | 0.0006482 | 0.0003056 | 0.0014706 | 0.0000000 | 0.0004191 | 0.0063776 | 0.0004268 | 0.0010823 | 0.0013889 | 0.0006750 | 0.0229079 | 0.0033422 | 0.0051207 | 0.0021322 | 0.0022177 | 0.0005668 | 0.0549046 | 0.0035902 | 0.0003479 | 0.0004027 | 0.0012185 | 0.0000000 | 0.0003094 | 0.0000000 | 0.0089045 | 0.0092987 | 0.0004958 | 0.0079749 | 0.0025943 | 0.0004401 | 0.0008039 | 0.0000000 | 0.0000000 | 0.0000000 |
| NK cells | 0.0046433 | 0.0085494 | 0.0051254 | 0.0058950 | 0.0036563 | 0.0000000 | 0.0026655 | 0.0014090 | 0.0020124 | 0.0011723 | 0.0157171 | 0.0016204 | 0.0015281 | 0.0014706 | 0.0008107 | 0.0000000 | 0.0044643 | 0.0014938 | 0.0266955 | 0.0060185 | 0.0016875 | 0.0079476 | 0.0020053 | 0.0000000 | 0.0002369 | 0.0020161 | 0.0011336 | 0.0010044 | 0.0033140 | 0.0003479 | 0.0004027 | 0.0012185 | 0.0013437 | 0.0006188 | 0.0011614 | 0.0000000 | 0.0019372 | 0.0019834 | 0.0136713 | 0.0089623 | 0.0066014 | 0.0062012 | 0.0068221 | 0.0005658 | 0.0098779 |
| NK-T cells | 0.0000000 | 0.0041368 | 0.0002698 | 0.0005359 | 0.0001523 | 0.0000000 | 0.0013327 | 0.0002562 | 0.0005488 | 0.0001465 | 0.0019646 | 0.0000000 | 0.0003056 | 0.0014706 | 0.0000000 | 0.0001397 | 0.0012755 | 0.0002134 | 0.0014430 | 0.0000000 | 0.0000000 | 0.0014025 | 0.0000000 | 0.0000000 | 0.0000000 | 0.0004032 | 0.0011336 | 0.0000000 | 0.0005523 | 0.0003479 | 0.0000000 | 0.0000000 | 0.0000000 | 0.0000000 | 0.0000000 | 0.0000000 | 0.0007749 | 0.0000000 | 0.0019937 | 0.0002358 | 0.0004401 | 0.0009187 | 0.0005685 | 0.0000943 | 0.0009559 |
| proliferating macrophages | 0.0367244 | 0.0493657 | 0.0321014 | 0.0560021 | 0.0467703 | 0.0572792 | 0.0310973 | 0.0462406 | 0.0332967 | 0.0247655 | 0.0000000 | 0.0392136 | 0.0531785 | 0.0303922 | 0.0490474 | 0.0222098 | 0.0197704 | 0.0354247 | 0.0151515 | 0.0444444 | 0.0445494 | 0.0187003 | 0.0407754 | 0.0475494 | 0.0414594 | 0.0556452 | 0.0317400 | 0.0451958 | 0.0425297 | 0.0320111 | 0.0457016 | 0.0097482 | 0.0588551 | 0.0411510 | 0.0514905 | 0.0275229 | 0.0236343 | 0.0115284 | 0.0065508 | 0.0422170 | 0.0259655 | 0.0264125 | 0.0278567 | 0.0375295 | 0.0333510 |
| proliferating T/NK | 0.0021106 | 0.0024821 | 0.0008093 | 0.0013398 | 0.0007617 | 0.0000000 | 0.0044425 | 0.0007685 | 0.0016465 | 0.0010258 | 0.0009823 | 0.0008642 | 0.0003056 | 0.0000000 | 0.0000000 | 0.0006984 | 0.0000000 | 0.0004268 | 0.0086580 | 0.0009259 | 0.0006750 | 0.0018700 | 0.0000000 | 0.0007315 | 0.0004738 | 0.0010081 | 0.0013225 | 0.0003348 | 0.0008285 | 0.0006959 | 0.0008053 | 0.0008123 | 0.0005375 | 0.0009282 | 0.0007743 | 0.0002698 | 0.0029059 | 0.0007438 | 0.0017089 | 0.0009434 | 0.0040709 | 0.0008039 | 0.0039795 | 0.0008487 | 0.0016994 |
Cell type proportions by sample
Create sample meta data table.
seu@meta.data %>%
  dplyr::select(sample.id,
                Participant,
                Disease,
                Treatment,
                Severity,
                Group,
                Group_severity,
                Batch,
                Age,
                Sex) %>%
     left_join(props$Counts %>%
                 data.frame %>%
                 group_by(sample) %>%
                 summarise(ncells = sum(Freq)),
               by = c("sample.id" = "sample")) %>%
    distinct() -> info

head(info) %>% knitr::kable()| sample.id | Participant | Disease | Treatment | Severity | Group | Group_severity | Batch | Age | Sex | ncells |
|---|---|---|---|---|---|---|---|---|---|---|
| sample_33.1 | sample_33 | CF | treated (ivacaftor) | severe | CF.IVA | CF.IVA.S | 1 | 5.950685 | M | 2139 |
| sample_25.1 | sample_25 | CF | untreated | severe | CF.NO_MOD | CF.NO_MOD.S | 1 | 4.910000 | F | 3272 |
| sample_29.1 | sample_29 | CF | untreated | severe | CF.NO_MOD | CF.NO_MOD.S | 1 | 5.989041 | F | 1568 |
| sample_27.1 | sample_27 | CF | treated (ivacaftor) | mild | CF.IVA | CF.IVA.M | 1 | 4.917808 | M | 2467 |
| sample_32.1 | sample_32 | CF | untreated | mild | CF.NO_MOD | CF.NO_MOD.M | 1 | 5.926027 | F | 2963 |
| sample_26.1 | sample_26 | CF | untreated | mild | CF.NO_MOD | CF.NO_MOD.M | 1 | 5.049315 | M | 2040 |
props$Proportions %>%
  data.frame %>%
  left_join(info,
             by = c("sample" = "sample.id")) %>%
ggplot(aes(x = sample, y = Freq, fill = clusters)) +
  geom_bar(stat = "identity", color = "black", size = 0.1) +
  theme(axis.text.x = element_text(angle = 90,
                                   vjust = 0.5,
                                   hjust = 1),
        legend.text = element_text(size = 8),
        legend.position = "bottom") +
  labs(y = "Proportion", fill = "Cell Label") +
  scale_fill_paletteer_d("miscpalettes::pastel", direction = 1) +
  facet_grid(~Group, scales = "free_x", space = "free_x")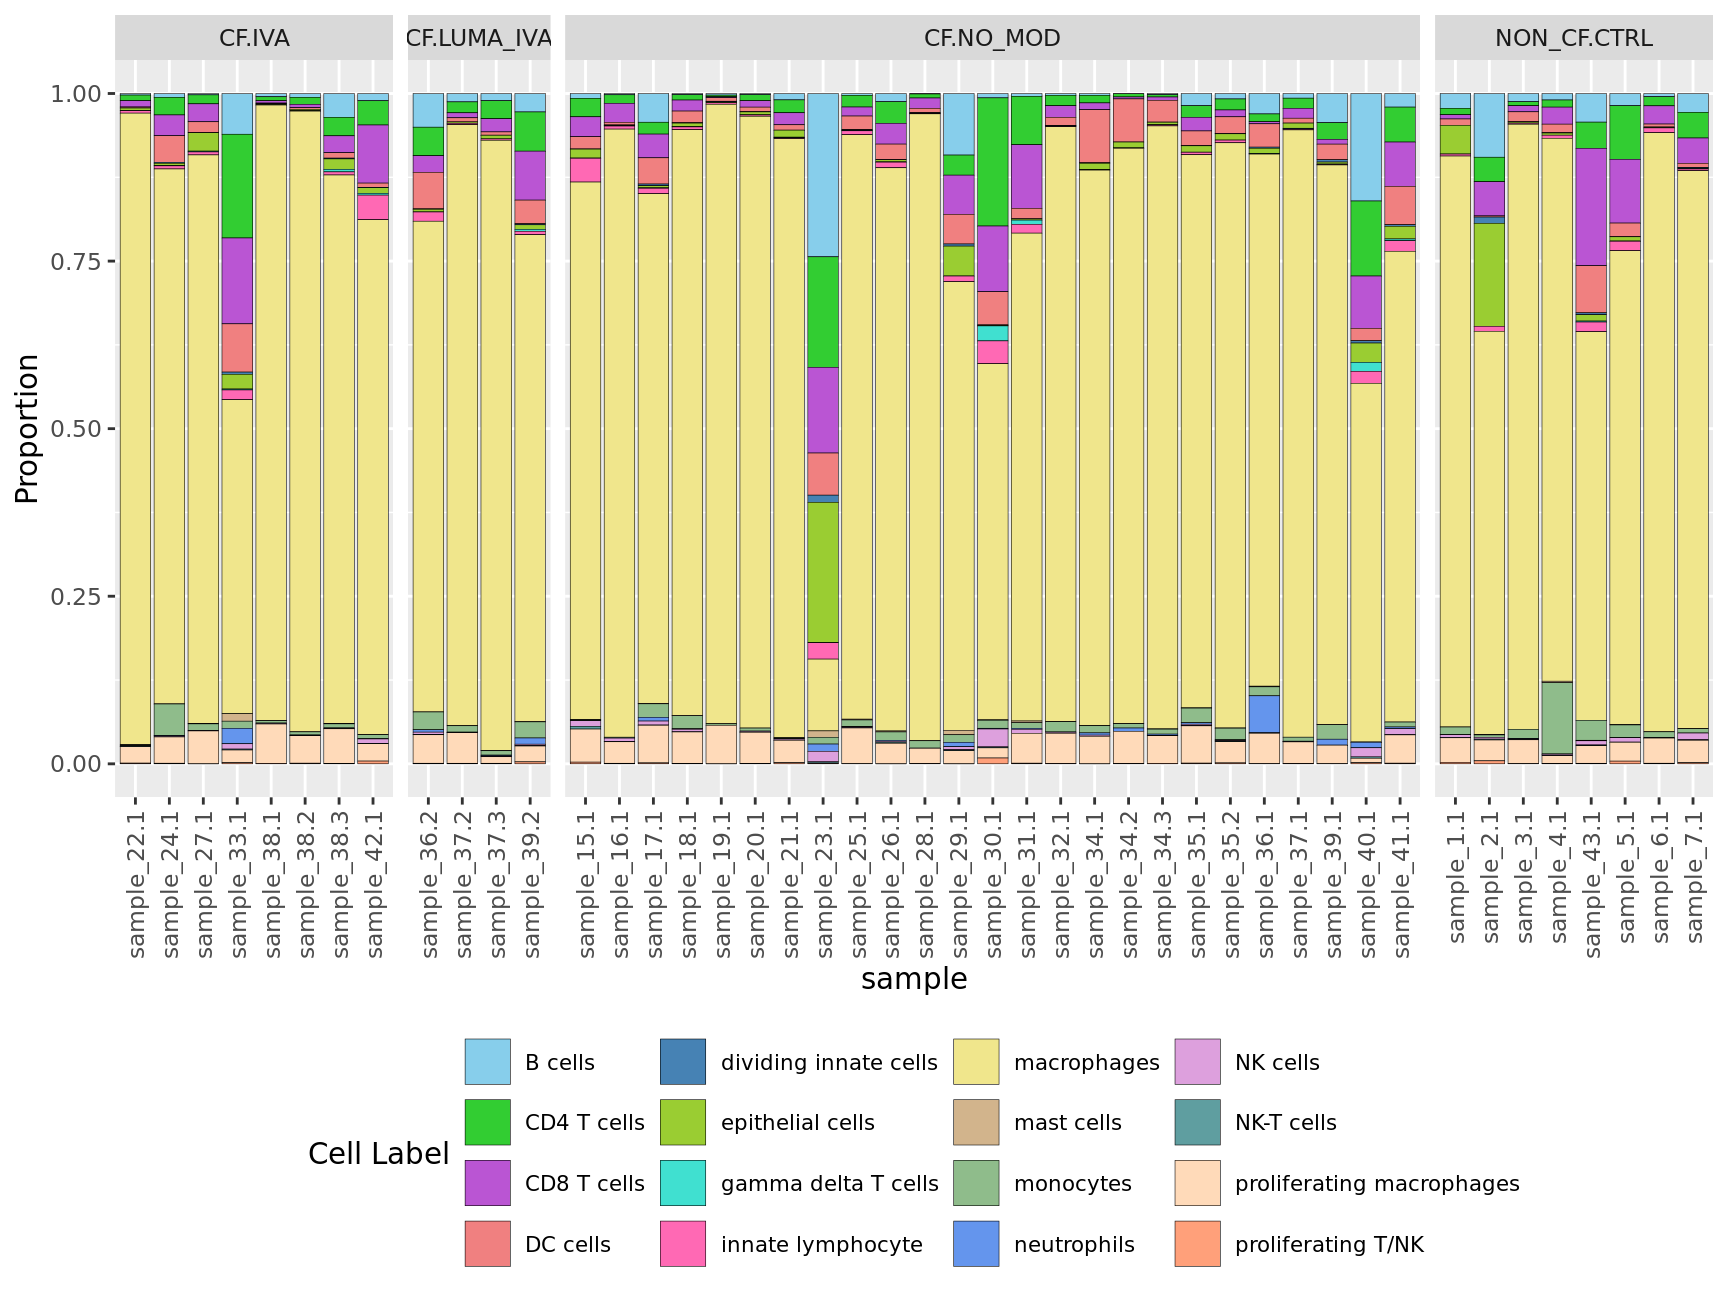
No. cells per sample
info %>%
ggplot(aes(x = sample.id, y = ncells, fill = Disease)) +
  geom_bar(stat = "identity") +
  theme(axis.text.x = element_text(angle = 90,
                                   vjust = 0.5,
                                   hjust = 1),
        legend.text = element_text(size = 8),
        legend.position = "bottom") +
  labs(y = "No. cells", fill = "Disease") +
  facet_grid(~Group, scales = "free_x", space = "free_x") +
  geom_hline(yintercept = 1000, linetype = "dashed")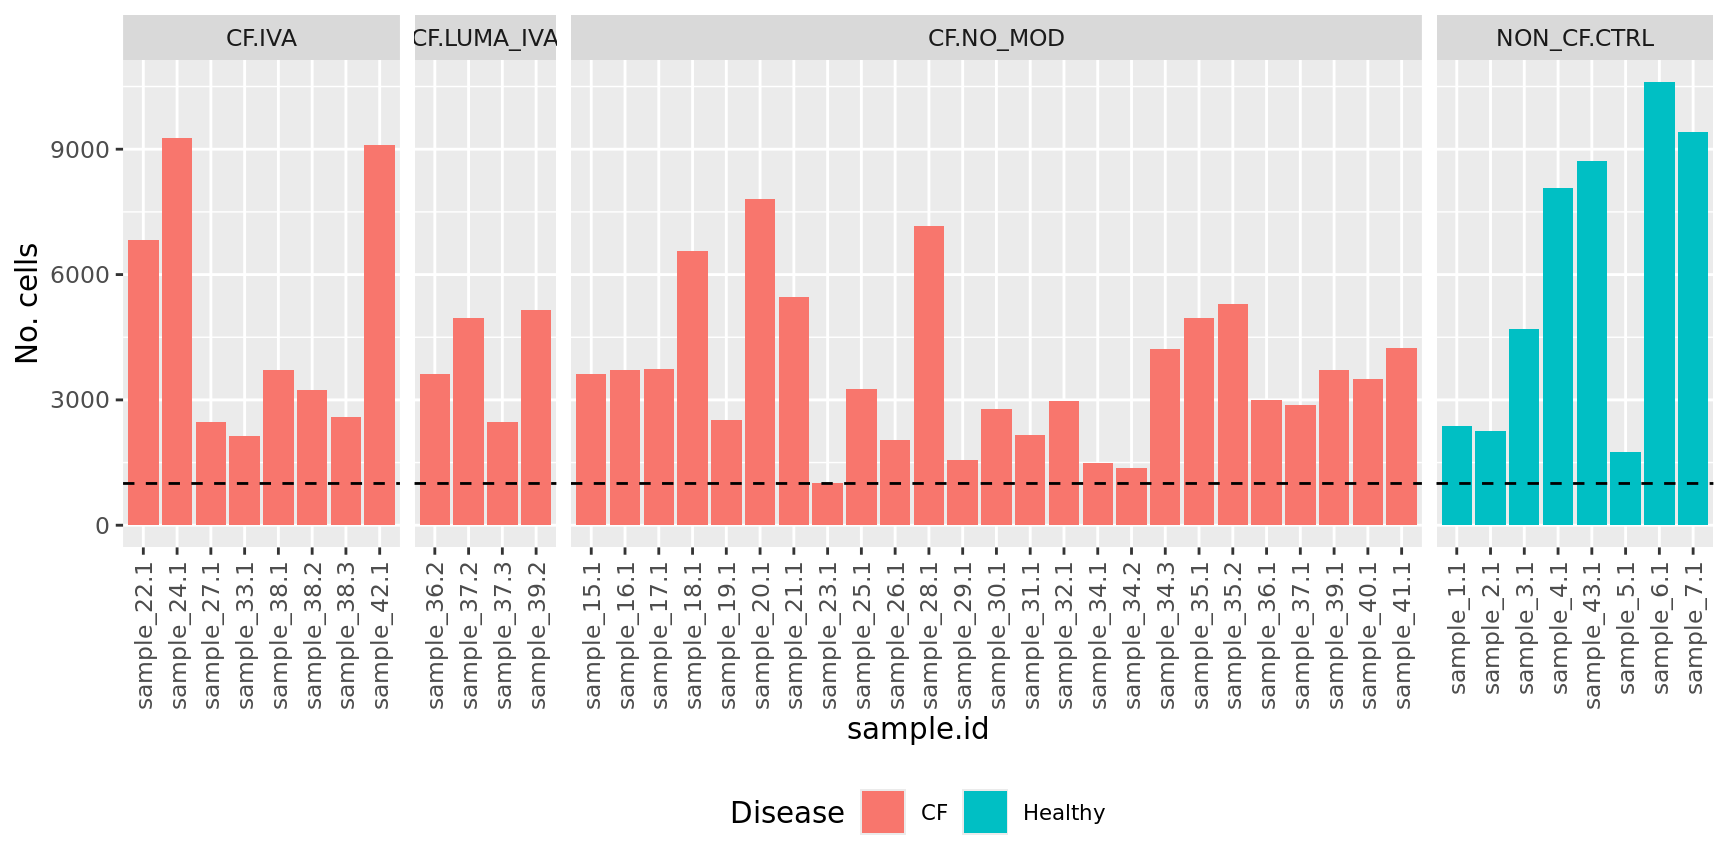
Cell proportions by cell type
props$Proportions %>%
  data.frame %>%
  left_join(info,
             by = c("sample" = "sample.id")) %>%
ggplot(aes(x = clusters, y = Freq, fill = clusters)) +
  geom_boxplot(outlier.size = 0.1, size = 0.25) +
  theme(axis.text.x = element_text(angle = 45,
                                   vjust = 1,
                                   hjust = 1),
        legend.text = element_text(size = 8)) +
  labs(y = "Proportion") +
  scale_fill_paletteer_d("miscpalettes::pastel", direction = 1) +
  NoLegend()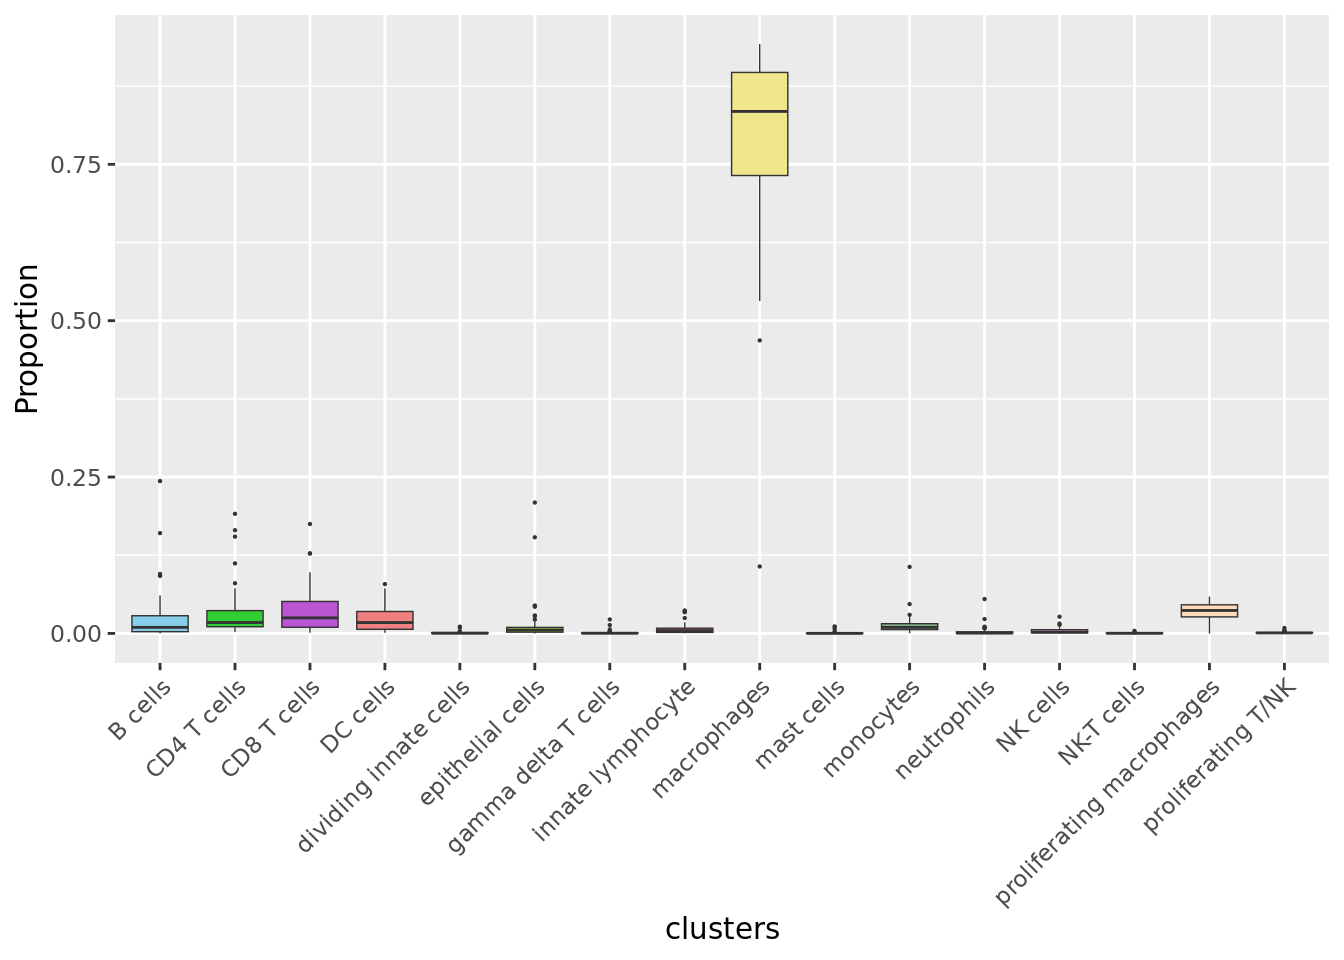
Explore sources of variation
Cell count data
Look at the sources of variation in the raw cell count level data.
dims <- list(c(1,2), c(2:3), c(3,4), c(4,5))
p <- vector("list", length(dims))

for(i in 1:length(dims)){
  mds <- plotMDS(props$Counts,
    gene.selection = "common",
    plot = FALSE, dim.plot = dims[[i]])

  data.frame(x = mds$x,
             y = mds$y,
             sample = rownames(mds$distance.matrix.squared)) %>%
    left_join(info,
             by = c("sample" = "sample.id")) %>%
    distinct() -> dat

  p[[i]] <- ggplot(dat, aes(x = x, y = y,
                            shape = as.factor(Disease),
                            color = as.factor(Batch))) +
    geom_point(size = 3) +
    labs(x = glue("Principal Component {dims[[i]][1]}"),
         y = glue("Principal Component {dims[[i]][2]}"),
         colour = "Batch",
         shape = "Disease") +
    theme(legend.direction = "horizontal",
          legend.text = element_text(size = 8),
          legend.title = element_text(size = 9),
          axis.text = element_text(size = 8),
          axis.title = element_text(size = 9))
}

wrap_plots(p, cols = 2) + plot_layout(guides = "collect") &
theme(legend.position = "bottom") 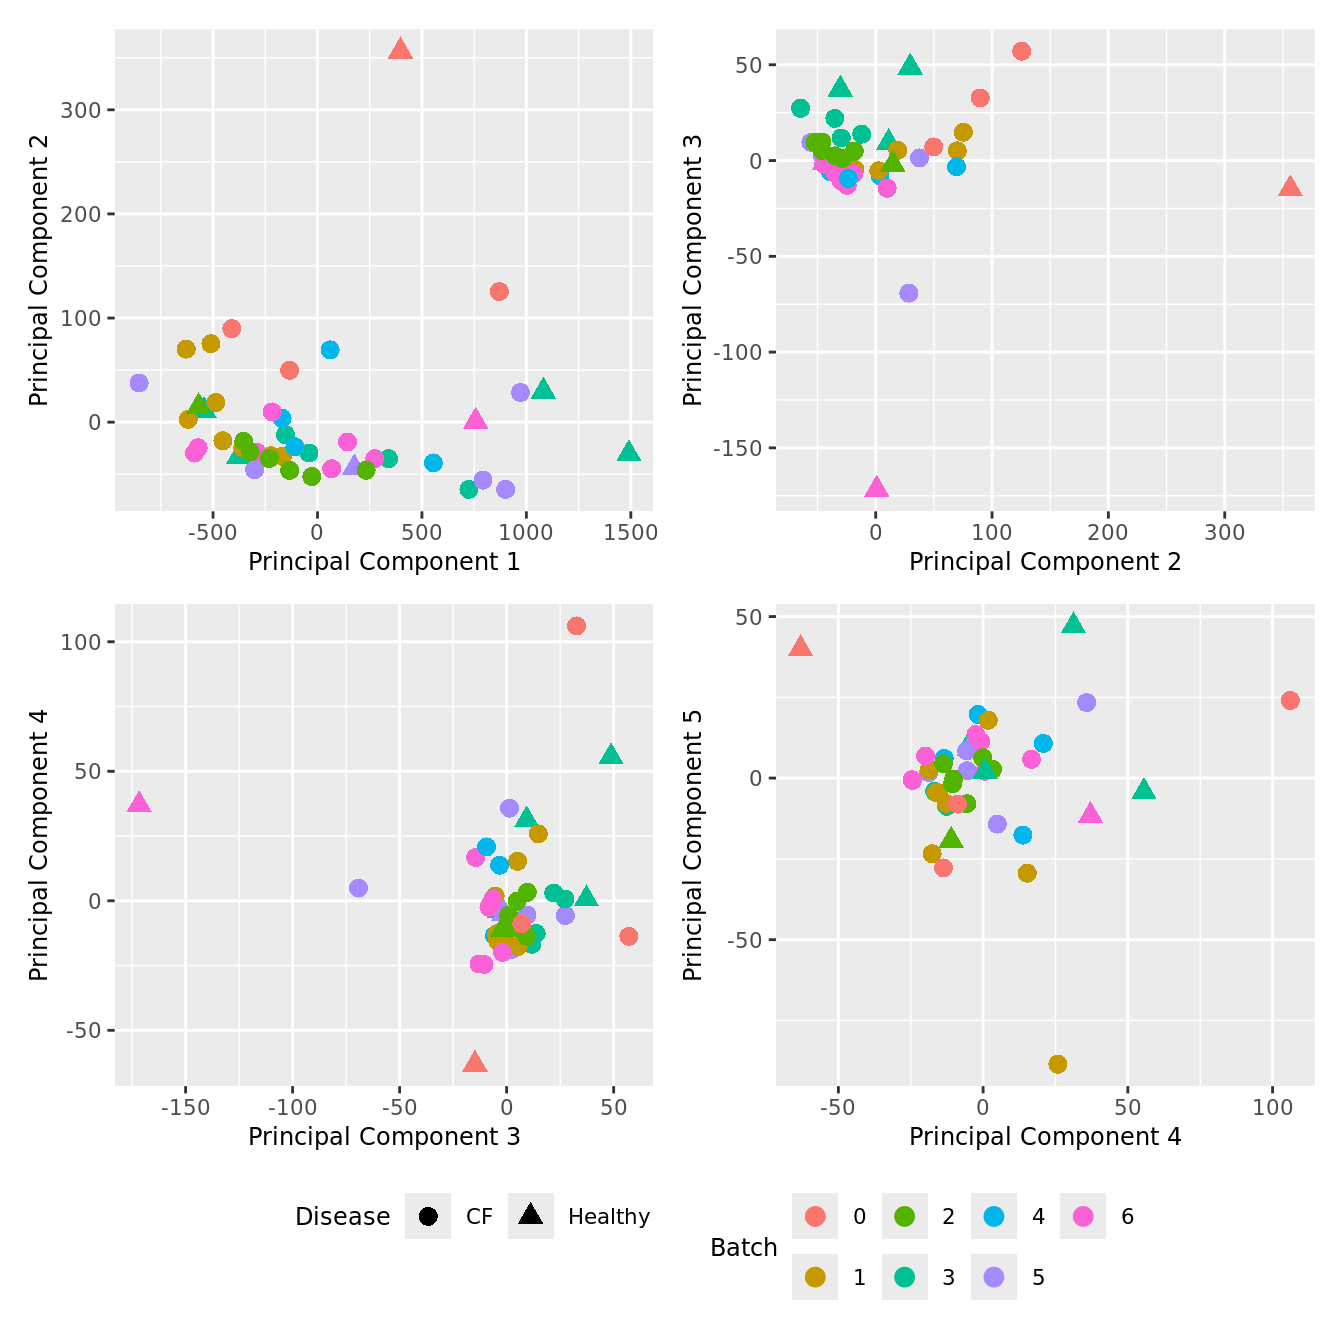
| Version | Author | Date |
|---|---|---|
| 7ae0444 | Jovana Maksimovic | 2024-12-24 |
dims <- list(c(1,2), c(2:3), c(3,4), c(4,5))
p <- vector("list", length(dims))

for(i in 1:length(dims)){
  mds <- plotMDS(props$Counts,
                 gene.selection = "common",
                 plot = FALSE, dim.plot = dims[[i]])

  data.frame(x = mds$x,
             y = mds$y,
             sample = rownames(mds$distance.matrix.squared)) %>%
    left_join(info,
             by = c("sample" = "sample.id")) %>%
    distinct() -> dat

  p[[i]] <- ggplot(dat, aes(x = x, y = y,
                            colour = log2(ncells)))+
    geom_text(aes(label = str_remove_all(sample, "sample_")), size = 2.5) +
    labs(x = glue("Principal Component {dims[[i]][1]}"),
         y = glue("Principal Component {dims[[i]][2]}"),
         colour = "Log2 No. Cells") +
    theme(legend.direction = "horizontal",
          legend.text = element_text(size = 8),
          legend.title = element_text(size = 9),
          axis.text = element_text(size = 8),
          axis.title = element_text(size = 9)) +
    scale_colour_viridis_c(option = "magma")
}

wrap_plots(p, cols = 2) + plot_layout(guides = "collect") &
theme(legend.position = "bottom") 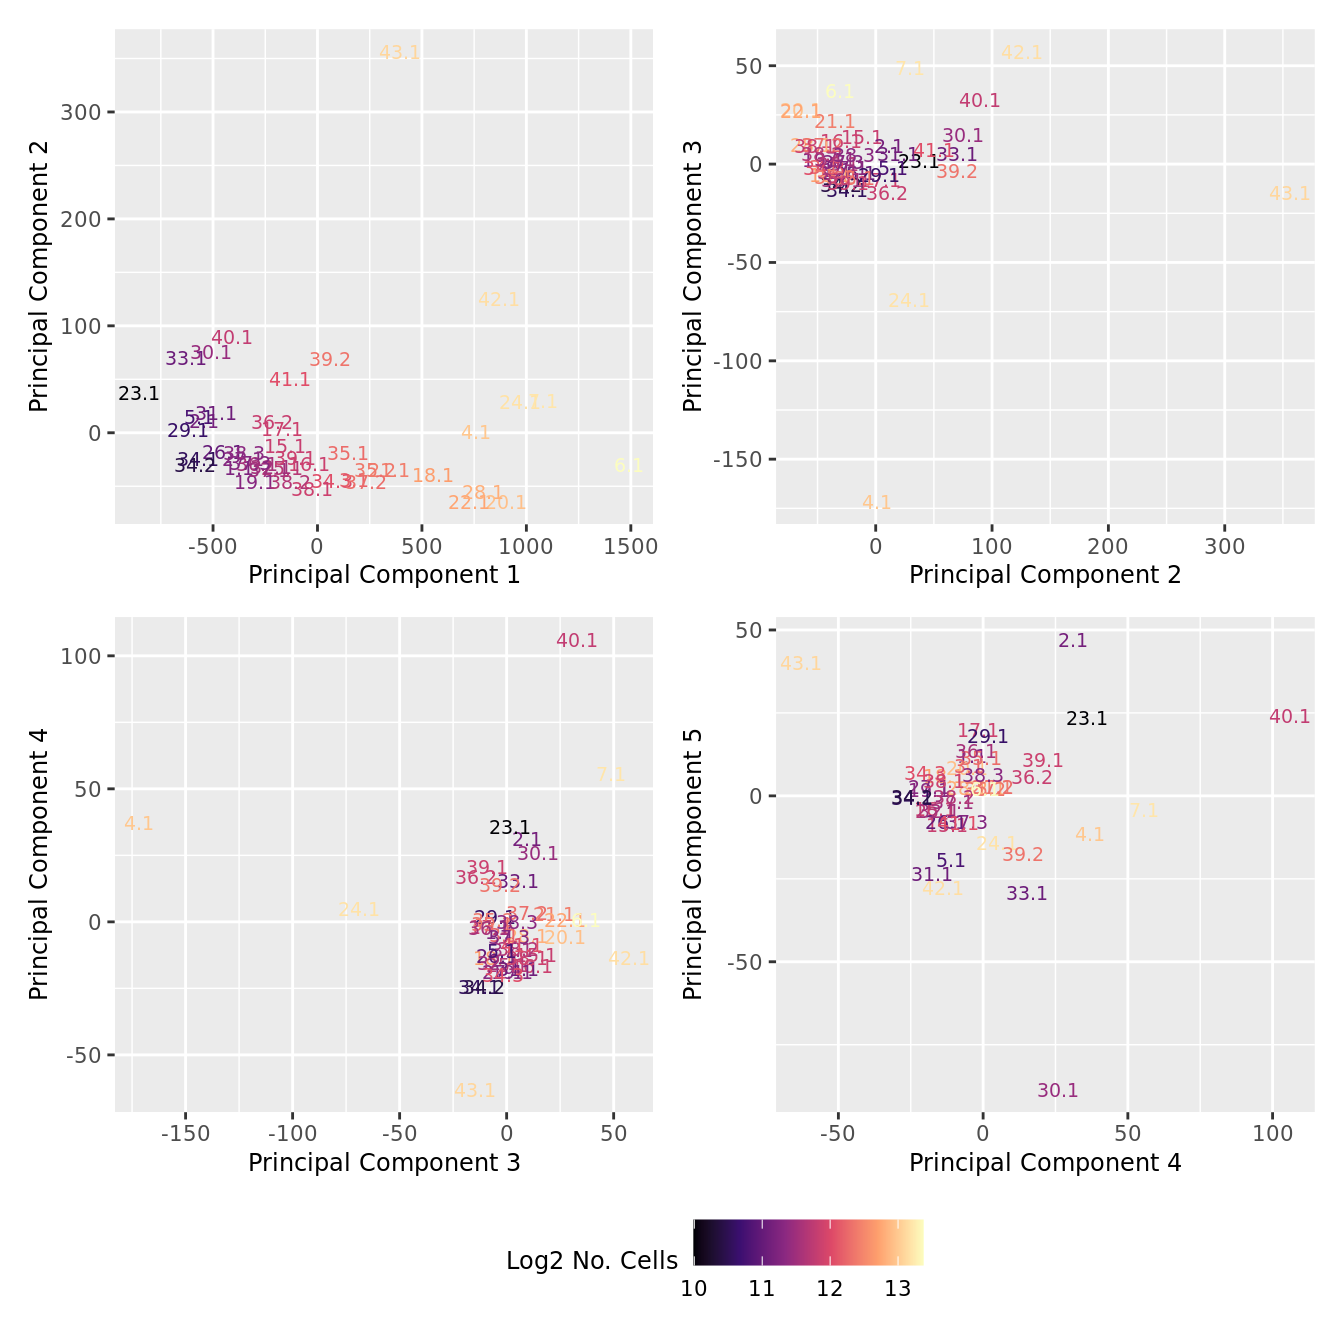
| Version | Author | Date |
|---|---|---|
| 7ae0444 | Jovana Maksimovic | 2024-12-24 |
Cell proportion data
Look at the sources of variation in the cell proportions data.
dims <- list(c(1,2), c(2:3), c(3,4), c(4,5))
p <- vector("list", length(dims))

for(i in 1:length(dims)){
  mds <- plotMDS(props$TransformedProps,
    gene.selection = "common",
    plot = FALSE, dim.plot = dims[[i]])

  data.frame(x = mds$x,
             y = mds$y,
             sample = rownames(mds$distance.matrix.squared)) %>%
    left_join(info,
             by = c("sample" = "sample.id")) %>%
    distinct() -> dat

  p[[i]] <- ggplot(dat, aes(x = x, y = y,
                            shape = as.factor(Disease),
                            color = as.factor(Batch)))+
    geom_point(size = 3) +
    labs(x = glue("Principal Component {dims[[i]][1]}"),
         y = glue("Principal Component {dims[[i]][2]}"),
         colour = "Batch",
         shape = "Disease") +
    theme(legend.direction = "horizontal",
          legend.text = element_text(size = 8),
          legend.title = element_text(size = 9),
          axis.text = element_text(size = 8),
          axis.title = element_text(size = 9))
}

wrap_plots(p, cols = 2) + plot_layout(guides = "collect") &
theme(legend.position = "bottom") 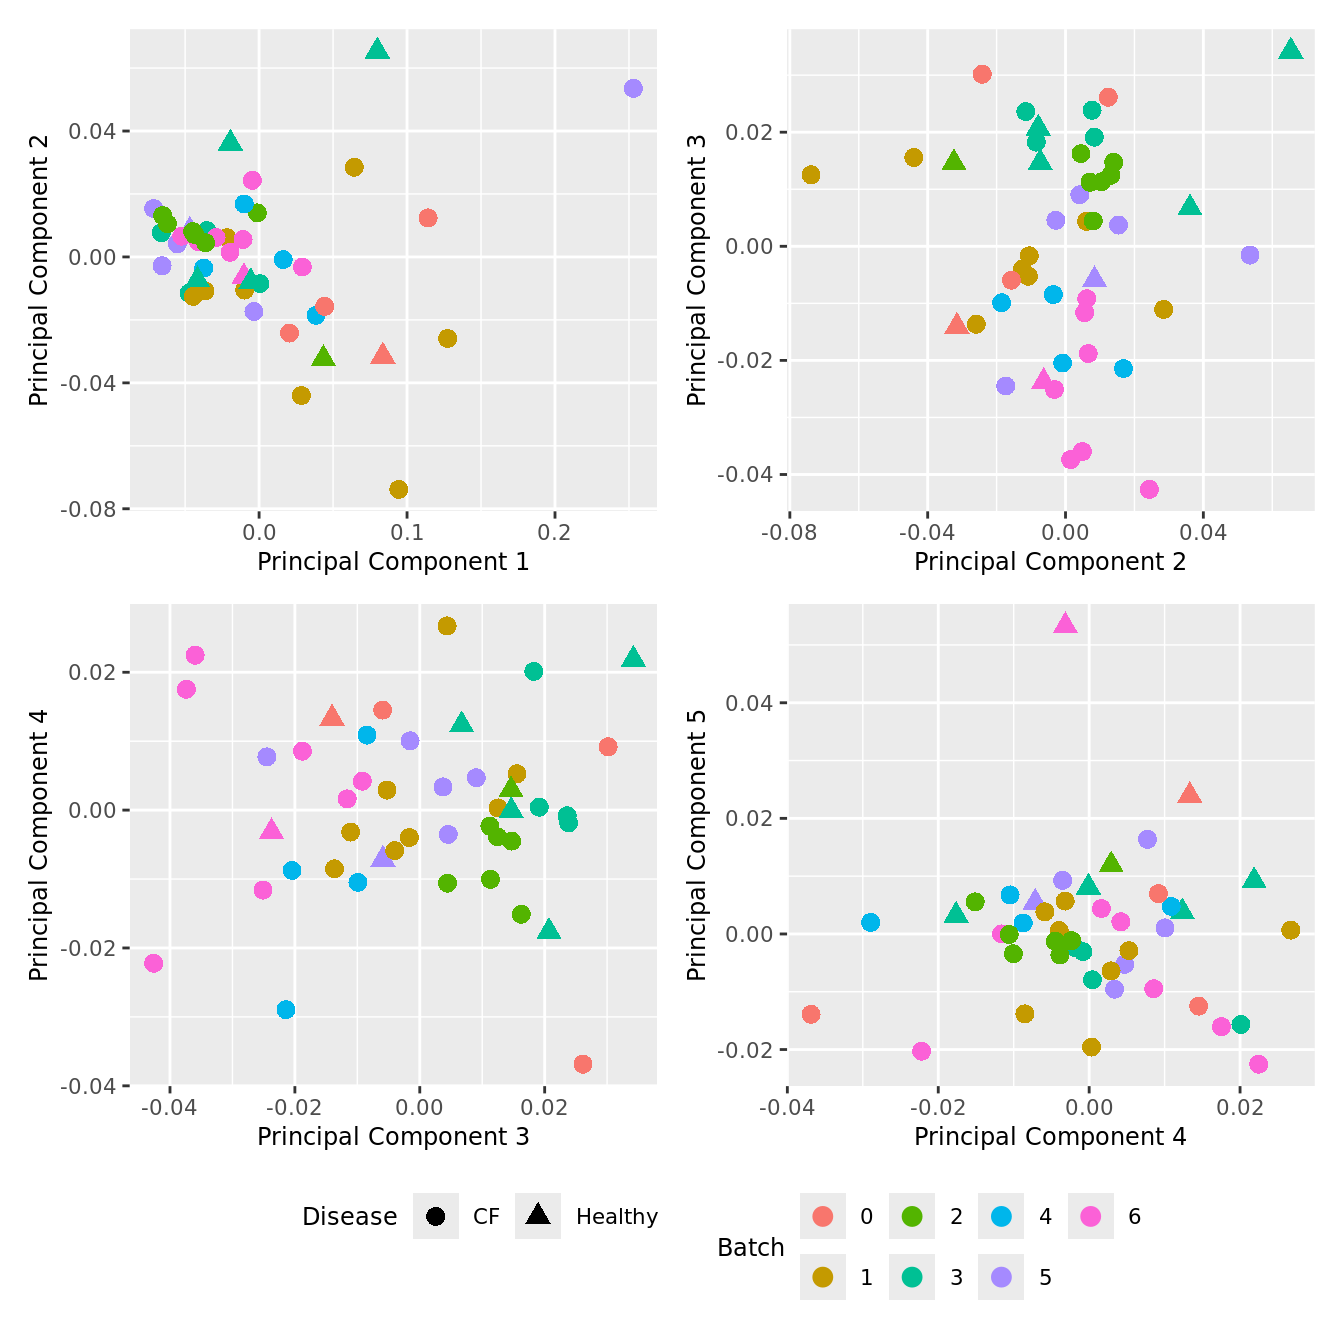
| Version | Author | Date |
|---|---|---|
| 7ae0444 | Jovana Maksimovic | 2024-12-24 |
dims <- list(c(1,2), c(2:3), c(3,4), c(4,5))
p <- vector("list", length(dims))

for(i in 1:length(dims)){
  mds <- plotMDS(props$TransformedProps,
    gene.selection = "common",
    plot = FALSE, dim.plot = dims[[i]])

  data.frame(x = mds$x,
             y = mds$y,
             sample = rownames(mds$distance.matrix.squared)) %>%
    left_join(info,
             by = c("sample" = "sample.id")) %>%
    distinct() -> dat

  p[[i]] <- ggplot(dat, aes(x = x, y = y,
                            shape = as.factor(Disease),
                            color = Sex))+
    geom_point(size = 3) +
    labs(x = glue("Principal Component {dims[[i]][1]}"),
         y = glue("Principal Component {dims[[i]][2]}"),
         colour = "Sex",
         shape = "Disease") +
    theme(legend.direction = "horizontal",
          legend.text = element_text(size = 8),
          legend.title = element_text(size = 9),
          axis.text = element_text(size = 8),
          axis.title = element_text(size = 9))
}

wrap_plots(p, cols = 2) + plot_layout(guides = "collect") &
theme(legend.position = "bottom") 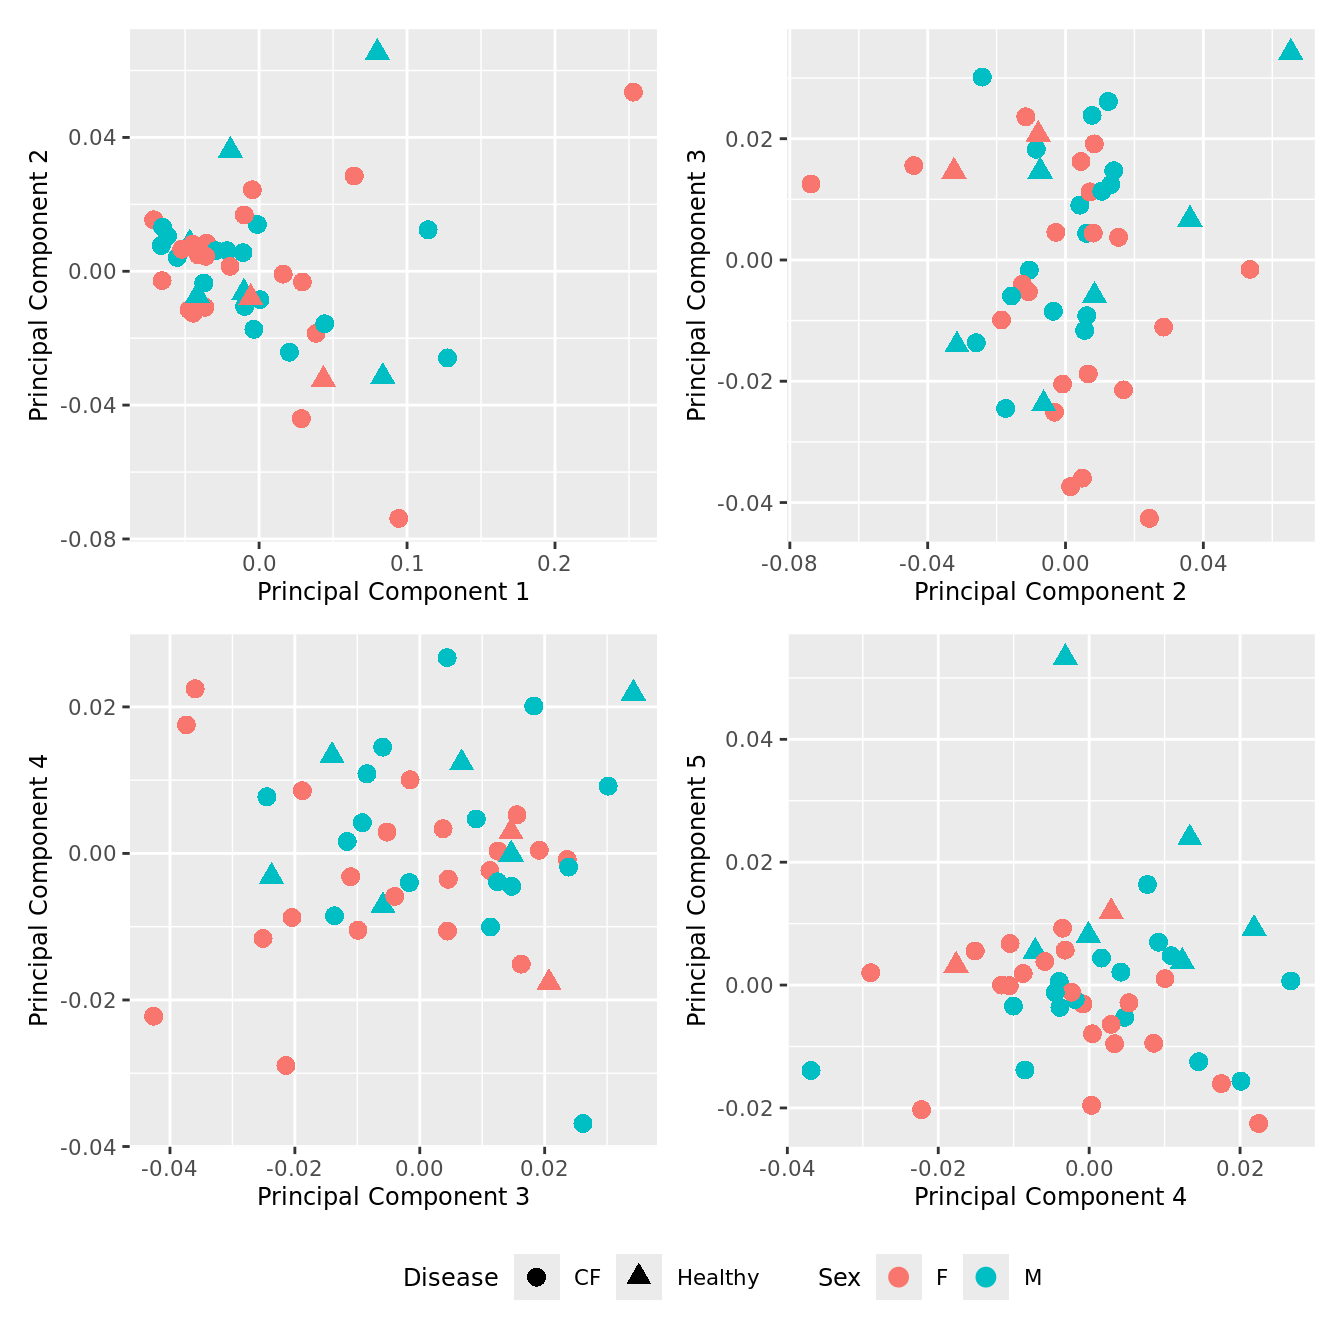
| Version | Author | Date |
|---|---|---|
| 7ae0444 | Jovana Maksimovic | 2024-12-24 |
dims <- list(c(1,2), c(2:3), c(3,4), c(4,5))
p <- vector("list", length(dims))

for(i in 1:length(dims)){
  mds <- plotMDS(props$TransformedProps,
                 gene.selection = "common",
                 plot = FALSE, dim.plot = dims[[i]])

   data.frame(x = mds$x,
             y = mds$y,
             sample = rownames(mds$distance.matrix.squared)) %>%
    left_join(info,
             by = c("sample" = "sample.id")) %>%
    distinct() -> dat

  p[[i]] <- ggplot(dat, aes(x = x, y = y,
                            colour = log2(Age)))+
    geom_text(aes(label = str_remove_all(sample, "sample_")), size = 2.5) +
    labs(x = glue("Principal Component {dims[[i]][1]}"),
         y = glue("Principal Component {dims[[i]][2]}"),
         colour = "Log2 Age") +
    theme(legend.direction = "horizontal",
          legend.text = element_text(size = 8),
          legend.title = element_text(size = 9),
          axis.text = element_text(size = 8),
          axis.title = element_text(size = 9)) +
    scale_colour_viridis_c(option = "magma")
}

wrap_plots(p, cols = 2) + plot_layout(guides = "collect") &
theme(legend.position = "bottom") 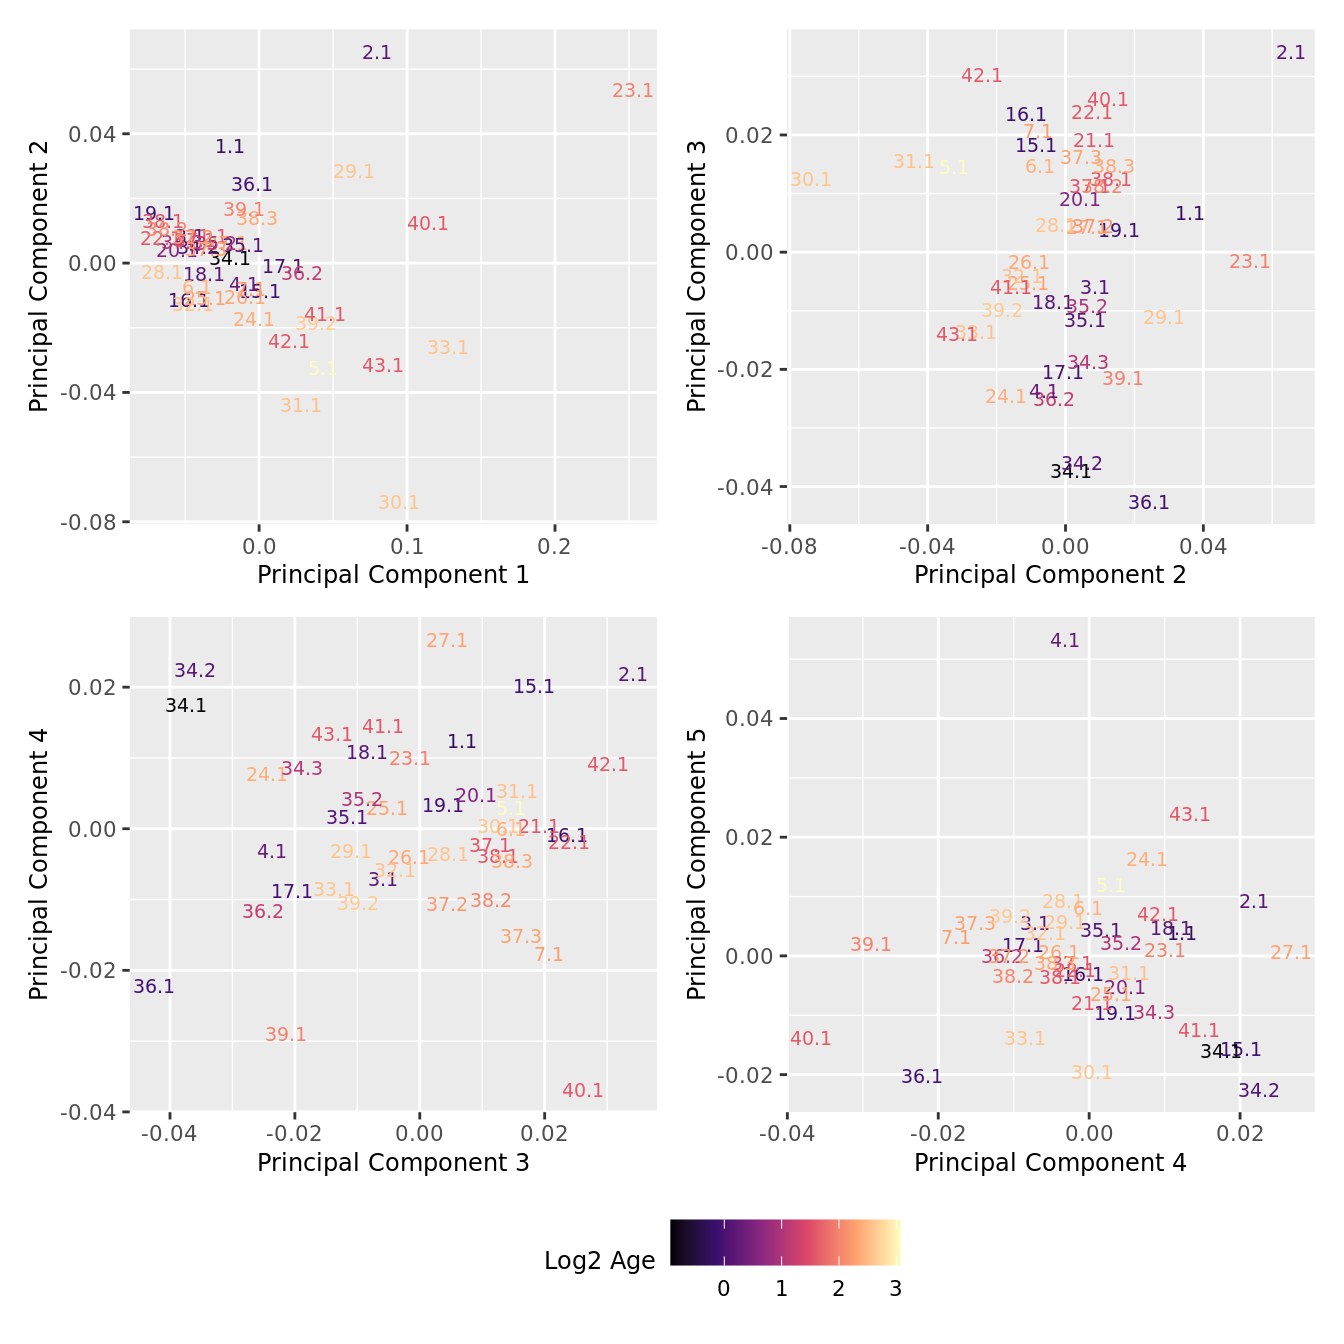
| Version | Author | Date |
|---|---|---|
| 7ae0444 | Jovana Maksimovic | 2024-12-24 |
dims <- list(c(1,2), c(2:3), c(3,4), c(4,5))
p <- vector("list", length(dims))

for(i in 1:length(dims)){
  mds <- plotMDS(props$TransformedProps,
                 gene.selection = "common",
                 plot = FALSE, dim.plot = dims[[i]])

  data.frame(x = mds$x,
             y = mds$y,
             sample = rownames(mds$distance.matrix.squared)) %>%
    left_join(info,
             by = c("sample" = "sample.id")) %>%
    distinct() -> dat

  p[[i]] <- ggplot(dat, aes(x = x, y = y,
                            colour = log2(ncells)))+
    geom_text(aes(label = str_remove_all(sample, "sample_")), size = 2.5) +
    labs(x = glue("Principal Component {dims[[i]][1]}"),
         y = glue("Principal Component {dims[[i]][2]}"),
         colour = "Log2 No. Cells") +
    theme(legend.direction = "horizontal",
          legend.text = element_text(size = 8),
          legend.title = element_text(size = 9),
          axis.text = element_text(size = 8),
          axis.title = element_text(size = 9)) +
    scale_colour_viridis_c(option = "magma")
}

wrap_plots(p, cols = 2) + plot_layout(guides = "collect") &
theme(legend.position = "bottom") 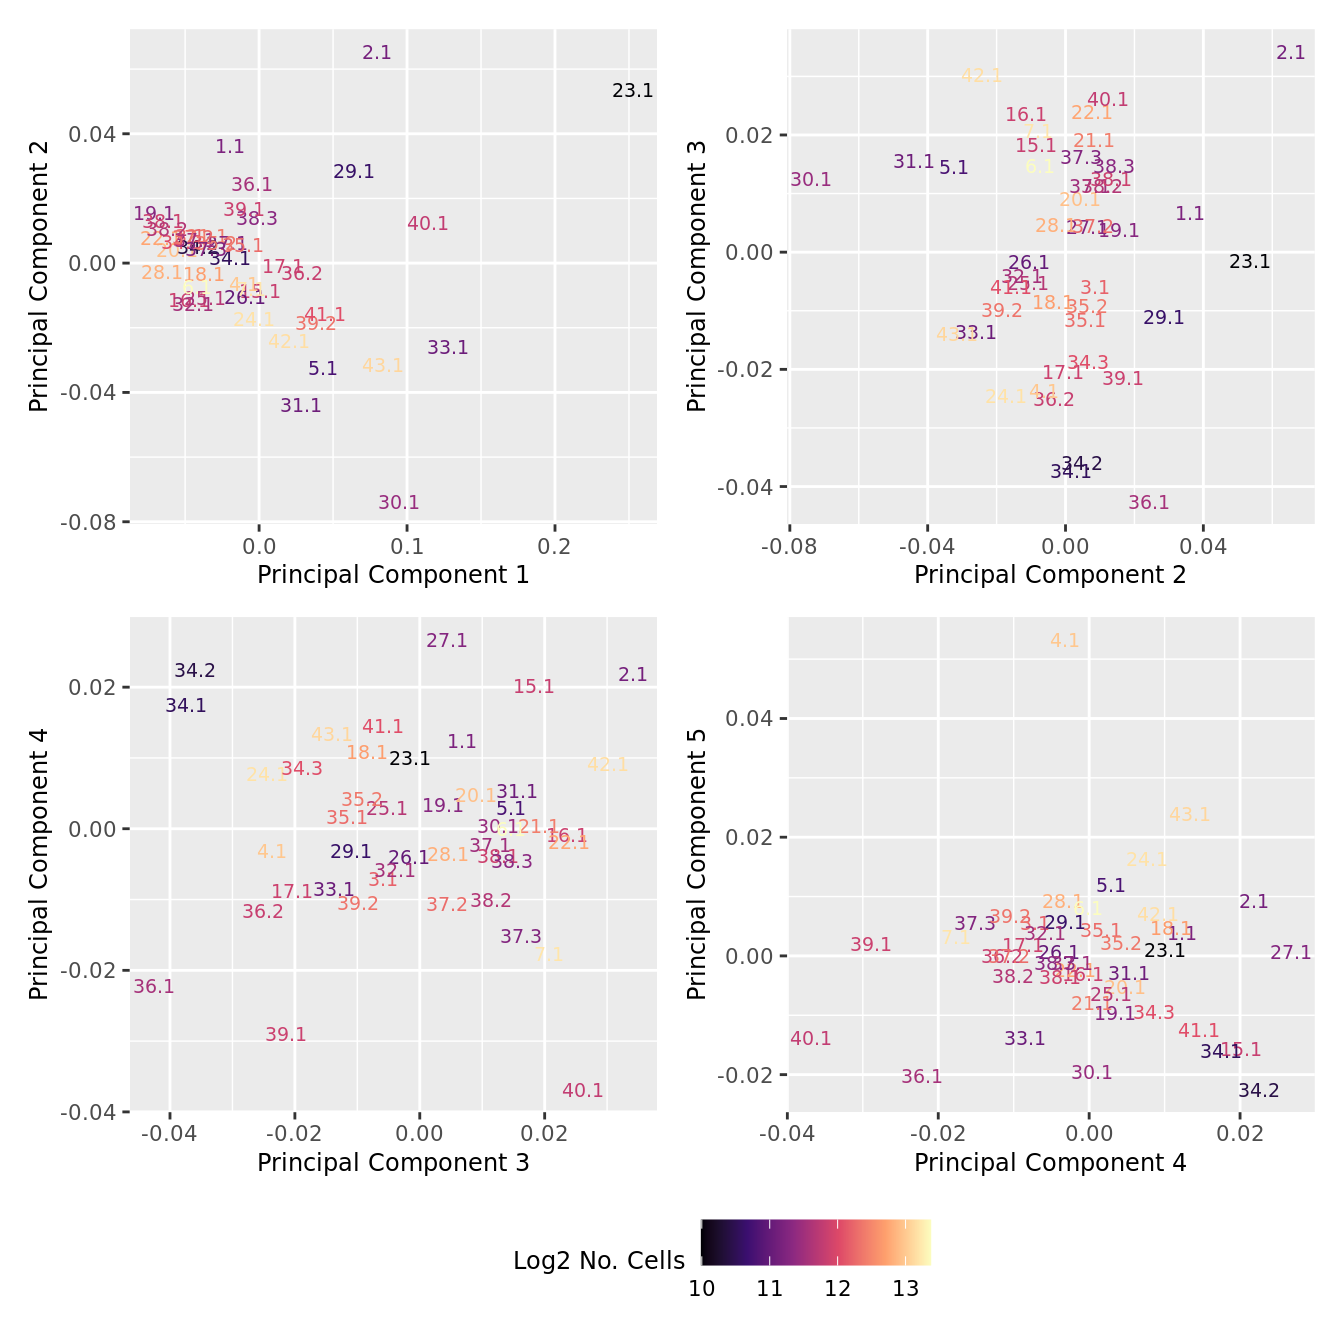
| Version | Author | Date |
|---|---|---|
| 7ae0444 | Jovana Maksimovic | 2024-12-24 |
Principal components versus traits
Principal components analysis (PCA) allows us to mathematically determine the sources of variation in the data. We can then investigate whether these correlate with any of the specifed covariates. First, we calculate the principal components. The scree plot belows shows us that most of the variation in this data is captured by the top 7 principal components.
# remove outlying sample
info <- info[info$sample.id != "sample_23.1",]
props$TransformedProps <- props$TransformedProps[, colnames(props$TransformedProps) != "sample_23.1"]

PCs <- prcomp(t(props$TransformedProps), center = TRUE,
              scale = TRUE, retx = TRUE)
loadings = PCs$x # pc loadings
plot(PCs, type="lines") # scree plot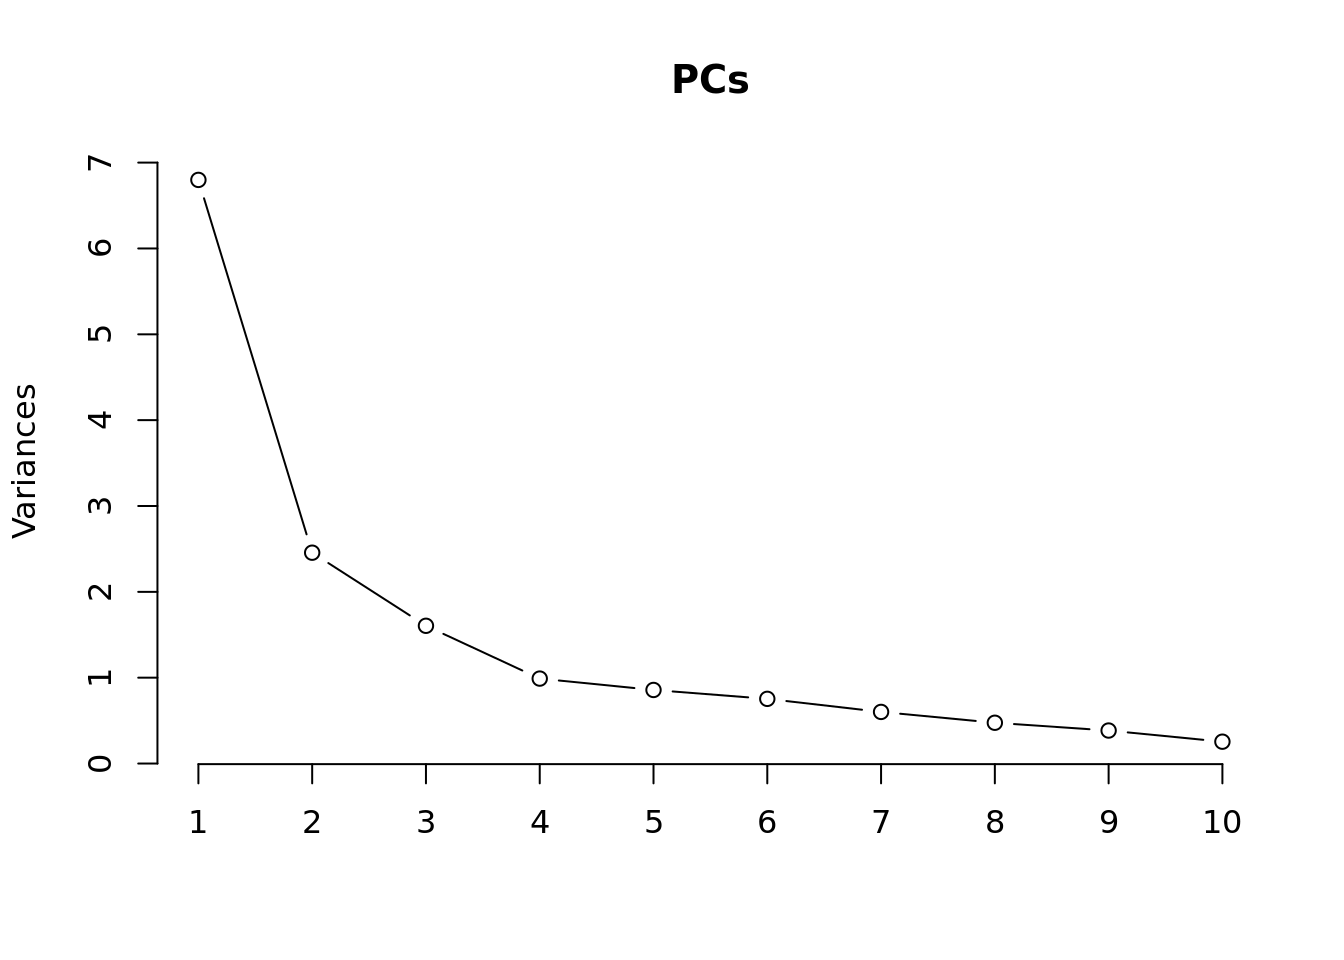
| Version | Author | Date |
|---|---|---|
| 7ae0444 | Jovana Maksimovic | 2024-12-24 |
Collect all of the known sample traits.
nGenes = nrow(props$TransformedProps)
nSamples = ncol(props$TransformedProps)

m <- match(colnames(props$TransformedProps), info$sample.id)
info <- info[m,]

datTraits <- info %>% dplyr::select(Participant, Batch, Disease, Treatment,
                                    Group, Severity, Age, Sex, ncells) %>%
  mutate(Age = log2(Age),
         ncells = log2(ncells),
    Donor = factor(Participant),
         Batch = factor(Batch),
         Disease = factor(Disease,
                          labels = 1:length(unique(Disease))),
         Group = factor(Group,
                        labels = 1:length(unique(Group))),
         Treatment = factor(Treatment,
                            labels = 1:length(unique(Treatment))),
         Sex = factor(Sex, labels = length(unique(Sex))),
         Severity = factor(Severity, labels = length(unique(Severity)))) %>%
  mutate(across(everything(), as.numeric)) %>%
  dplyr::select(-Participant)

datTraits %>%
knitr::kable()| Batch | Disease | Treatment | Group | Severity | Age | Sex | ncells | Donor | |
|---|---|---|---|---|---|---|---|---|---|
| 19 | 4 | 2 | 1 | 4 | 1 | -0.2590872 | 2 | 11.21006 | 1 |
| 18 | 4 | 1 | 4 | 3 | 2 | -0.0939001 | 2 | 11.82416 | 2 |
| 16 | 4 | 1 | 4 | 3 | 2 | -0.1151479 | 1 | 11.85604 | 3 |
| 24 | 5 | 1 | 4 | 3 | 2 | -0.0441471 | 1 | 11.86573 | 4 |
| 27 | 5 | 1 | 4 | 3 | 2 | 0.1428834 | 2 | 12.68036 | 5 |
| 33 | 6 | 1 | 4 | 3 | 2 | -0.0729608 | 1 | 11.29577 | 6 |
| 17 | 4 | 2 | 1 | 4 | 1 | 0.1464588 | 2 | 11.13635 | 7 |
| 32 | 6 | 1 | 4 | 3 | 3 | 0.5597097 | 2 | 12.93055 | 8 |
| 22 | 4 | 1 | 4 | 3 | 3 | 1.5743836 | 1 | 12.41627 | 9 |
| 23 | 4 | 1 | 2 | 1 | 2 | 1.5993830 | 2 | 12.73640 | 10 |
| 28 | 6 | 1 | 2 | 1 | 2 | 2.3883594 | 2 | 13.17633 | 11 |
| 2 | 2 | 1 | 4 | 3 | 3 | 2.2957230 | 1 | 11.67596 | 12 |
| 6 | 2 | 1 | 4 | 3 | 2 | 2.3360877 | 2 | 10.99435 | 13 |
| 4 | 2 | 1 | 2 | 1 | 2 | 2.2980155 | 2 | 11.26854 | 14 |
| 29 | 6 | 1 | 4 | 3 | 2 | 2.5790214 | 1 | 12.80554 | 15 |
| 3 | 2 | 1 | 4 | 3 | 3 | 2.5823250 | 1 | 10.61471 | 16 |
| 30 | 6 | 2 | 1 | 4 | 1 | 0.1321035 | 2 | 12.19414 | 17 |
| 7 | 2 | 1 | 4 | 3 | 3 | 2.5889097 | 1 | 11.43671 | 18 |
| 8 | 2 | 1 | 4 | 3 | 2 | 2.5583683 | 1 | 11.07682 | 19 |
| 5 | 2 | 1 | 4 | 3 | 2 | 2.5670653 | 1 | 11.53284 | 20 |
| 1 | 2 | 1 | 2 | 1 | 3 | 2.5730557 | 2 | 11.06272 | 21 |
| 40 | 7 | 1 | 4 | 3 | 2 | -0.9343238 | 1 | 10.54689 | 22 |
| 41 | 7 | 1 | 4 | 3 | 2 | 0.0918737 | 1 | 10.41680 | 22 |
| 34 | 7 | 1 | 4 | 3 | 2 | 1.0409164 | 1 | 12.04337 | 22 |
| 35 | 7 | 1 | 4 | 3 | 2 | 0.0807044 | 2 | 12.27612 | 23 |
| 39 | 7 | 1 | 4 | 3 | 2 | 0.9940589 | 2 | 12.36987 | 23 |
| 38 | 7 | 1 | 4 | 3 | 3 | -0.0564254 | 1 | 11.54448 | 24 |
| 37 | 7 | 1 | 3 | 2 | 3 | 1.1764977 | 1 | 11.82217 | 24 |
| 10 | 3 | 1 | 4 | 3 | 2 | 1.5597097 | 1 | 11.48884 | 25 |
| 9 | 3 | 1 | 3 | 2 | 2 | 2.1930156 | 1 | 12.27816 | 25 |
| 11 | 3 | 1 | 3 | 2 | 2 | 2.2980155 | 1 | 11.26562 | 25 |
| 14 | 3 | 1 | 2 | 1 | 2 | 1.5703964 | 2 | 11.86147 | 26 |
| 15 | 3 | 1 | 2 | 1 | 2 | 2.0206033 | 2 | 11.65821 | 26 |
| 13 | 3 | 1 | 2 | 1 | 2 | 2.3485584 | 2 | 11.33483 | 26 |
| 26 | 5 | 1 | 4 | 3 | 2 | 1.9730702 | 1 | 11.85565 | 27 |
| 25 | 5 | 1 | 3 | 2 | 2 | 2.6297159 | 1 | 12.33371 | 27 |
| 36 | 7 | 2 | 1 | 4 | 1 | 0.2923784 | 2 | 12.97782 | 28 |
| 42 | 1 | 1 | 4 | 3 | 3 | 1.5801455 | 2 | 11.77767 | 29 |
| 43 | 1 | 1 | 4 | 3 | 2 | 1.5801455 | 2 | 12.04985 | 30 |
| 45 | 1 | 1 | 2 | 1 | 3 | 1.5993178 | 2 | 13.14991 | 31 |
| 44 | 1 | 2 | 1 | 4 | 1 | 1.5849625 | 2 | 13.08813 | 32 |
| 12 | 3 | 2 | 1 | 4 | 1 | 3.0699187 | 1 | 10.78054 | 33 |
| 20 | 4 | 2 | 1 | 4 | 1 | 2.4204621 | 2 | 13.37246 | 34 |
| 21 | 4 | 2 | 1 | 4 | 1 | 2.2356012 | 1 | 13.20075 | 35 |
Correlate known sample traits with the top 10 principal components. This can help us determine which traits are potentially contributing to the main sources of variation in the data and should thus be included in our statistical analysis.
moduleTraitCor <- suppressWarnings(cor(loadings[, 1:10], datTraits, use = "p"))
moduleTraitPvalue <- WGCNA::corPvalueStudent(moduleTraitCor, (nSamples - 2))

textMatrix <- paste(signif(moduleTraitCor, 2), "\n(",
                    signif(moduleTraitPvalue, 1), ")", sep = "")
dim(textMatrix) <- dim(moduleTraitCor)

## Display the correlation values within a heatmap plot
par(cex=0.75, mar = c(6, 8.5, 3, 3))
WGCNA::labeledHeatmap(Matrix = t(moduleTraitCor),
                      xLabels = colnames(loadings)[1:10],
                      yLabels = names(datTraits),
                      colorLabels = FALSE,
                      colors = WGCNA::blueWhiteRed(6),
                      textMatrix = t(textMatrix),
                      setStdMargins = FALSE,
                      cex.text = 1,
                      zlim = c(-1,1),
                      main = paste("PCA-trait relationships: Top 10 PCs"))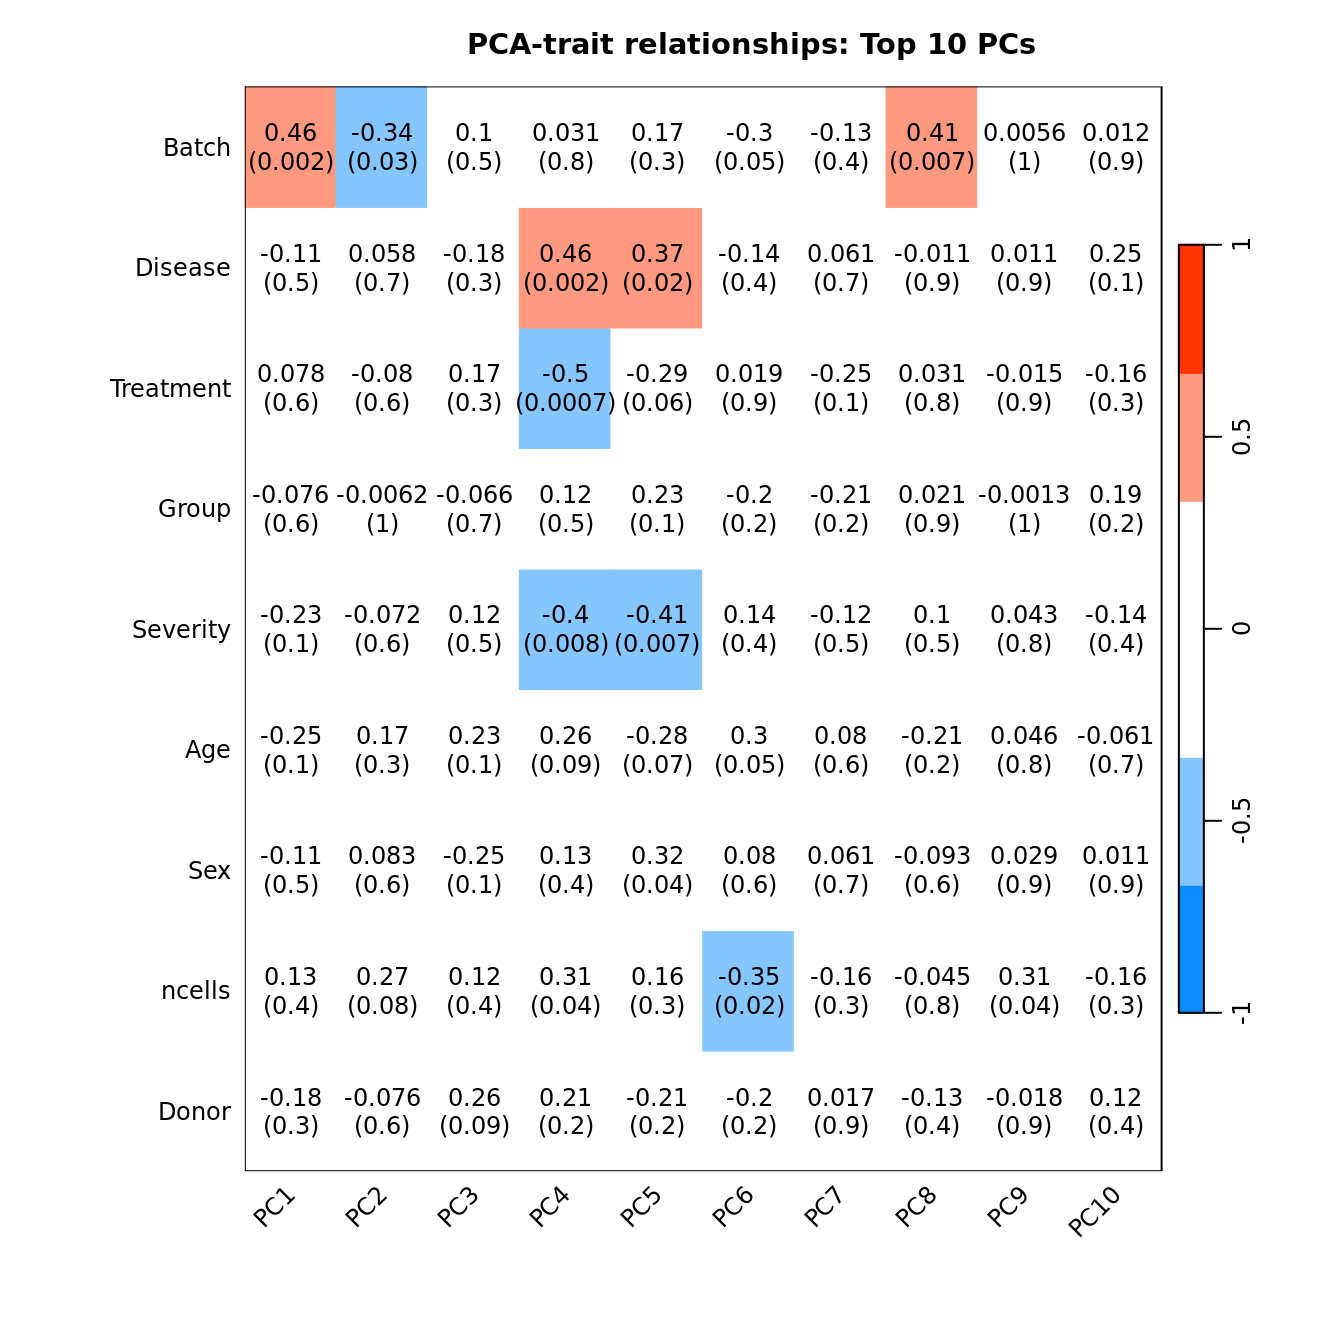
| Version | Author | Date |
|---|---|---|
| 7ae0444 | Jovana Maksimovic | 2024-12-24 |
Statistical analysis using propeller and
limma
Create the design matrix.
group <- factor(info$Group_severity)
participant <- factor(info$Participant)
age <- log2(info$Age)
batch <- factor(info$Batch)
sex <- factor(info$Sex)

design <- model.matrix(~ 0 + group + batch + age + sex)
colnames(design)[1:7] <- levels(group)
design
CF.IVA.M CF.IVA.S CF.LUMA_IVA.M CF.LUMA_IVA.S CF.NO_MOD.M CF.NO_MOD.S
1 0 0 0 0 0 0
2 0 0 0 0 1 0
3 0 0 0 0 1 0
4 0 0 0 0 1 0
5 0 0 0 0 1 0
6 0 0 0 0 1 0
7 0 0 0 0 0 0
8 0 0 0 0 0 1
9 0 0 0 0 0 1
10 1 0 0 0 0 0
11 1 0 0 0 0 0
12 0 0 0 0 0 1
13 0 0 0 0 1 0
14 1 0 0 0 0 0
15 0 0 0 0 1 0
16 0 0 0 0 0 1
17 0 0 0 0 0 0
18 0 0 0 0 0 1
19 0 0 0 0 1 0
20 0 0 0 0 1 0
21 0 1 0 0 0 0
22 0 0 0 0 1 0
23 0 0 0 0 1 0
24 0 0 0 0 1 0
25 0 0 0 0 1 0
26 0 0 0 0 1 0
27 0 0 0 0 0 1
28 0 0 0 1 0 0
29 0 0 0 0 1 0
30 0 0 1 0 0 0
31 0 0 1 0 0 0
32 1 0 0 0 0 0
33 1 0 0 0 0 0
34 1 0 0 0 0 0
35 0 0 0 0 1 0
36 0 0 1 0 0 0
37 0 0 0 0 0 0
38 0 0 0 0 0 1
39 0 0 0 0 1 0
40 0 1 0 0 0 0
41 0 0 0 0 0 0
42 0 0 0 0 0 0
43 0 0 0 0 0 0
44 0 0 0 0 0 0
NON_CF.CTRL batch1 batch2 batch3 batch4 batch5 batch6 age sexM
1 1 0 0 1 0 0 0 -0.25908722 1
2 0 0 0 1 0 0 0 -0.09390014 1
3 0 0 0 1 0 0 0 -0.11514787 0
4 0 0 0 0 1 0 0 -0.04414710 0
5 0 0 0 0 1 0 0 0.14288337 1
6 0 0 0 0 0 1 0 -0.07296080 0
7 1 0 0 1 0 0 0 0.14645883 1
8 0 0 0 0 0 1 0 0.55970971 1
9 0 0 0 1 0 0 0 1.57438357 0
10 0 0 0 1 0 0 0 1.59938302 1
11 0 0 0 0 0 1 0 2.38835941 1
12 0 1 0 0 0 0 0 2.29572302 0
13 0 1 0 0 0 0 0 2.33608770 1
14 0 1 0 0 0 0 0 2.29801547 1
15 0 0 0 0 0 1 0 2.57902140 0
16 0 1 0 0 0 0 0 2.58232503 0
17 1 0 0 0 0 1 0 0.13210354 1
18 0 1 0 0 0 0 0 2.58890969 0
19 0 1 0 0 0 0 0 2.55836829 0
20 0 1 0 0 0 0 0 2.56706530 0
21 0 1 0 0 0 0 0 2.57305573 1
22 0 0 0 0 0 0 1 -0.93432383 0
23 0 0 0 0 0 0 1 0.09187369 0
24 0 0 0 0 0 0 1 1.04091644 0
25 0 0 0 0 0 0 1 0.08070438 1
26 0 0 0 0 0 0 1 0.99405890 1
27 0 0 0 0 0 0 1 -0.05642543 0
28 0 0 0 0 0 0 1 1.17649766 0
29 0 0 1 0 0 0 0 1.55970971 0
30 0 0 1 0 0 0 0 2.19301559 0
31 0 0 1 0 0 0 0 2.29801547 0
32 0 0 1 0 0 0 0 1.57039639 1
33 0 0 1 0 0 0 0 2.02060327 1
34 0 0 1 0 0 0 0 2.34855840 1
35 0 0 0 0 1 0 0 1.97307024 0
36 0 0 0 0 1 0 0 2.62971590 0
37 1 0 0 0 0 0 1 0.29237837 1
38 0 0 0 0 0 0 0 1.58014548 1
39 0 0 0 0 0 0 0 1.58014548 1
40 0 0 0 0 0 0 0 1.59931779 1
41 1 0 0 0 0 0 0 1.58496250 1
42 1 0 1 0 0 0 0 3.06991870 0
43 1 0 0 1 0 0 0 2.42046210 1
44 1 0 0 1 0 0 0 2.23560118 0
attr(,"assign")
[1] 1 1 1 1 1 1 1 2 2 2 2 2 2 3 4
attr(,"contrasts")
attr(,"contrasts")$group
[1] "contr.treatment"
attr(,"contrasts")$batch
[1] "contr.treatment"
attr(,"contrasts")$sex
[1] "contr.treatment"Create the contrast matrix.
contr <- makeContrasts(CF.NO_MODvNON_CF.CTRL = 0.5*(CF.NO_MOD.M + CF.NO_MOD.S) - NON_CF.CTRL,
                       CF.IVAvCF.NO_MOD = 0.5*(CF.IVA.S + CF.IVA.M) - 0.5*(CF.NO_MOD.S + CF.NO_MOD.M),
                       CF.LUMA_IVAvCF.NO_MOD = 0.5*(CF.LUMA_IVA.S + CF.LUMA_IVA.M) - 0.5*(CF.NO_MOD.S + CF.NO_MOD.M),
                       CF.NO_MOD.SvCF.NO_MOD.M = CF.NO_MOD.S - CF.NO_MOD.M,
                       levels = design)
contr
Contrasts
Levels CF.NO_MODvNON_CF.CTRL CF.IVAvCF.NO_MOD CF.LUMA_IVAvCF.NO_MOD
CF.IVA.M 0.0 0.5 0.0
CF.IVA.S 0.0 0.5 0.0
CF.LUMA_IVA.M 0.0 0.0 0.5
CF.LUMA_IVA.S 0.0 0.0 0.5
CF.NO_MOD.M 0.5 -0.5 -0.5
CF.NO_MOD.S 0.5 -0.5 -0.5
NON_CF.CTRL -1.0 0.0 0.0
batch1 0.0 0.0 0.0
batch2 0.0 0.0 0.0
batch3 0.0 0.0 0.0
batch4 0.0 0.0 0.0
batch5 0.0 0.0 0.0
batch6 0.0 0.0 0.0
age 0.0 0.0 0.0
sexM 0.0 0.0 0.0
Contrasts
Levels CF.NO_MOD.SvCF.NO_MOD.M
CF.IVA.M 0
CF.IVA.S 0
CF.LUMA_IVA.M 0
CF.LUMA_IVA.S 0
CF.NO_MOD.M -1
CF.NO_MOD.S 1
NON_CF.CTRL 0
batch1 0
batch2 0
batch3 0
batch4 0
batch5 0
batch6 0
age 0
sexM 0Add random effect for samples from the same individual.
dupcor <- duplicateCorrelation(props$TransformedProps, design=design,
                                block=participant)
dupcor
$consensus.correlation
[1] 0.6815988
$cor
[1] 0.6815988
$atanh.correlations
[1] 0.91280819 1.07781785 -0.05536504 0.85854344 0.52144441 1.11093619
[7] 0.20770523 1.17122725 0.94099741 0.54921399 1.71581017 1.63069725
[13] 1.14397325 0.51267513 -0.53606034 0.97778570Fit the model.
fit <- lmFit(props$TransformedProps, design=design, block=participant,
                correlation=dupcor$consensus)
fit2 <- contrasts.fit(fit, contr)
fit2 <- eBayes(fit2, robust=TRUE, trend=FALSE)
pvalue <- 0.05
summary(decideTests(fit2, p.value = pvalue))
CF.NO_MODvNON_CF.CTRL CF.IVAvCF.NO_MOD CF.LUMA_IVAvCF.NO_MOD
Down 1 0 1
NotSig 15 16 15
Up 0 0 0
CF.NO_MOD.SvCF.NO_MOD.M
Down 0
NotSig 16
Up 0Save the limma fit object as an RDS object for
downstream use in plotting, etc.
# save proportion analysis results
saveRDS(fit2, file = here("data",
"intermediate_objects",
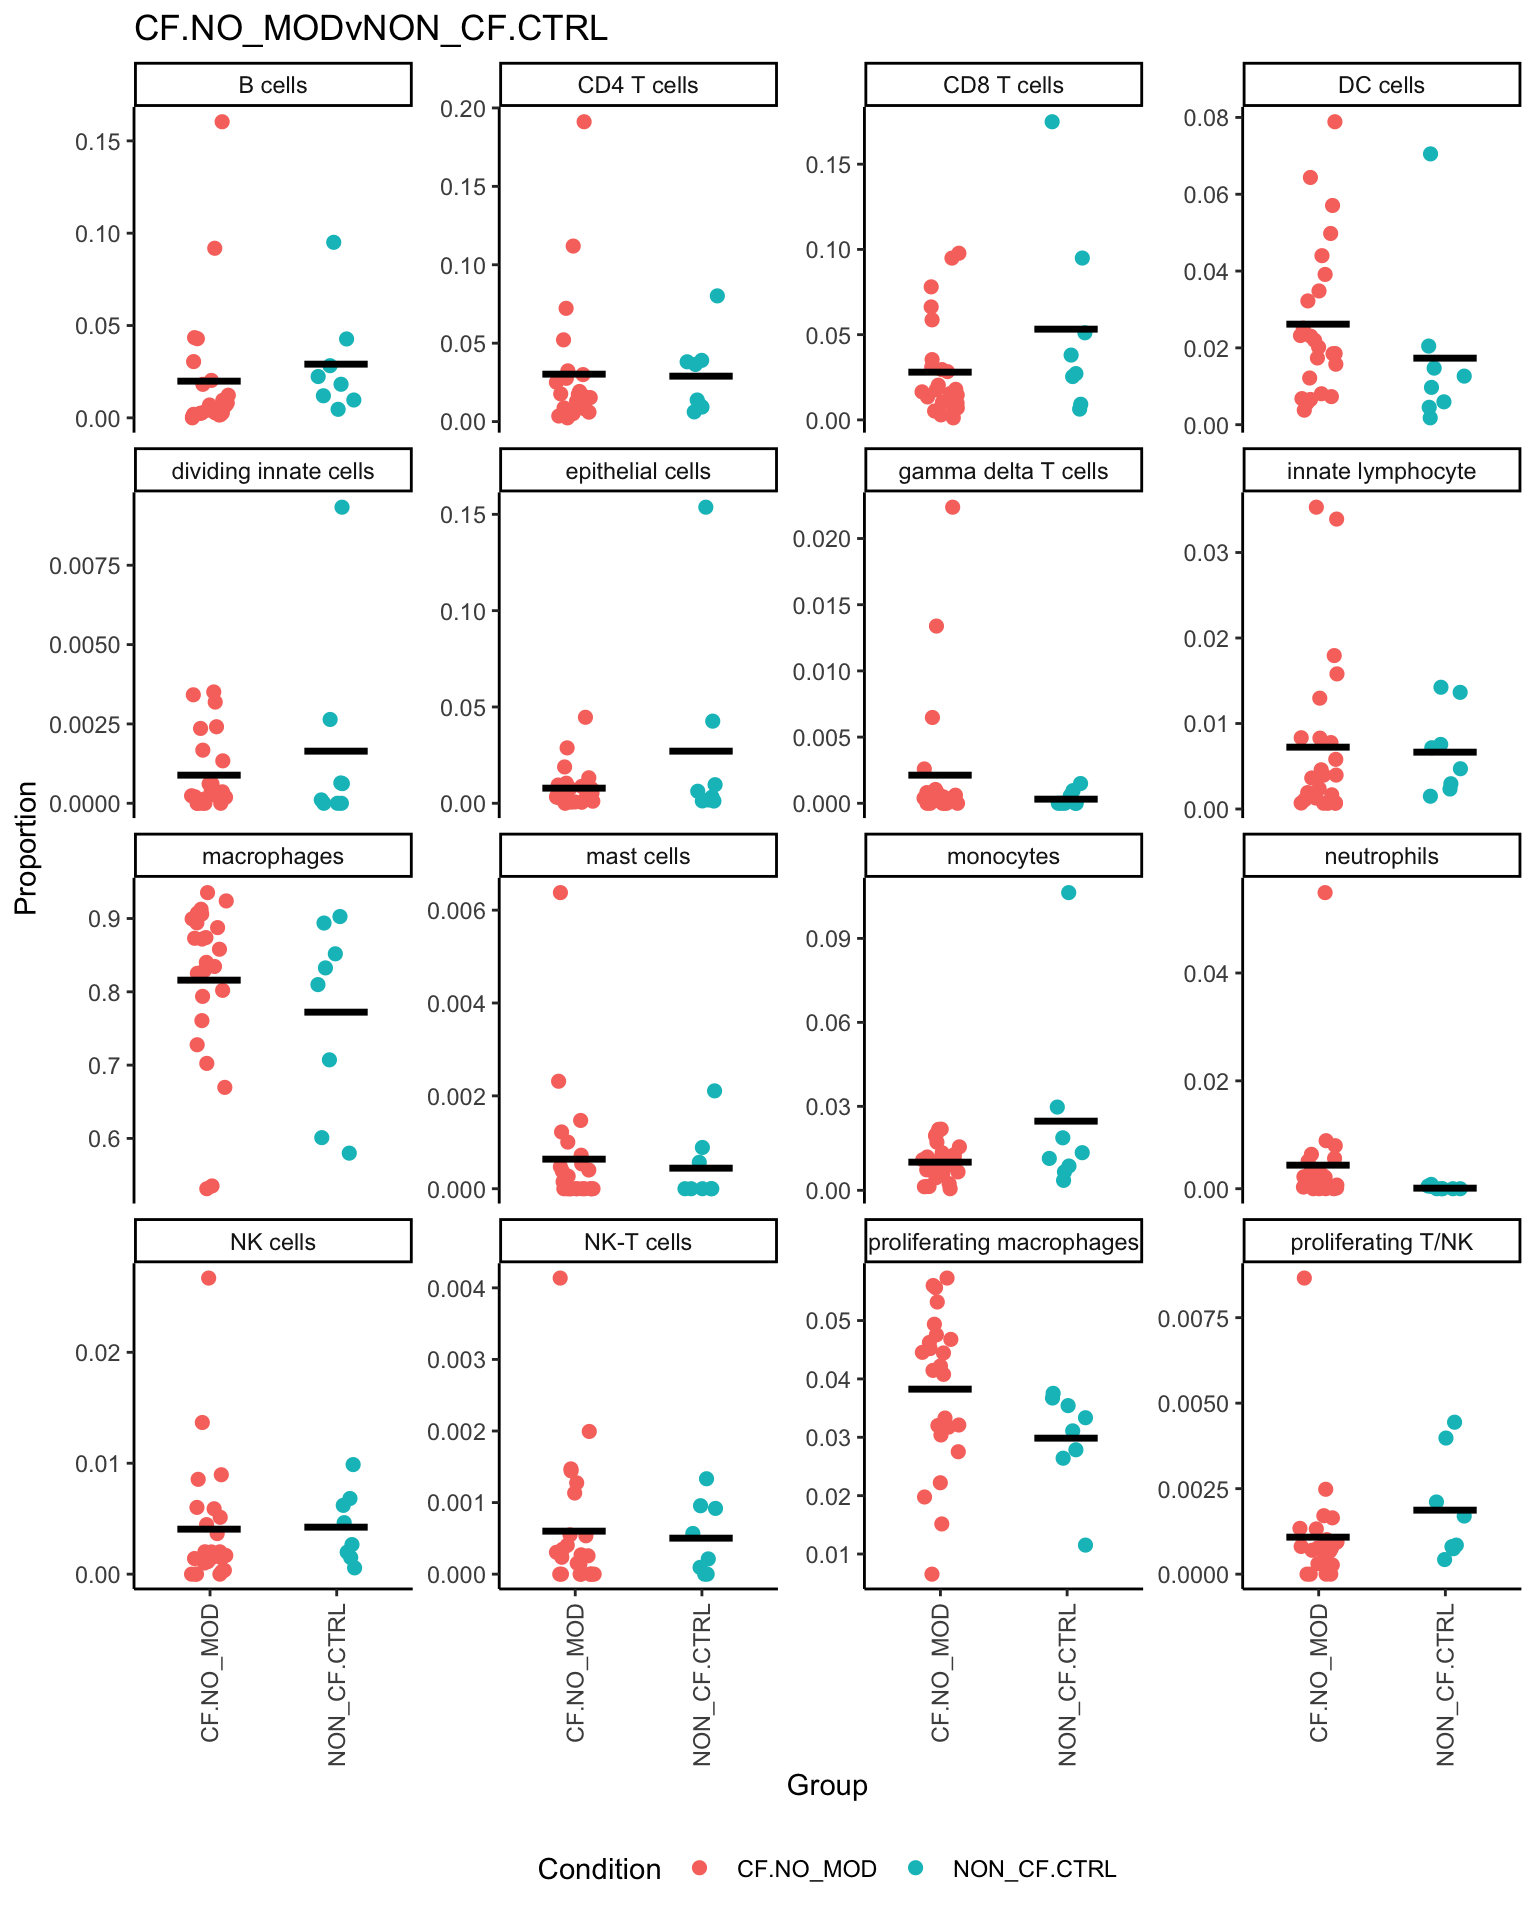
glue("prop.ann_level1.all.fit.rds")))Results
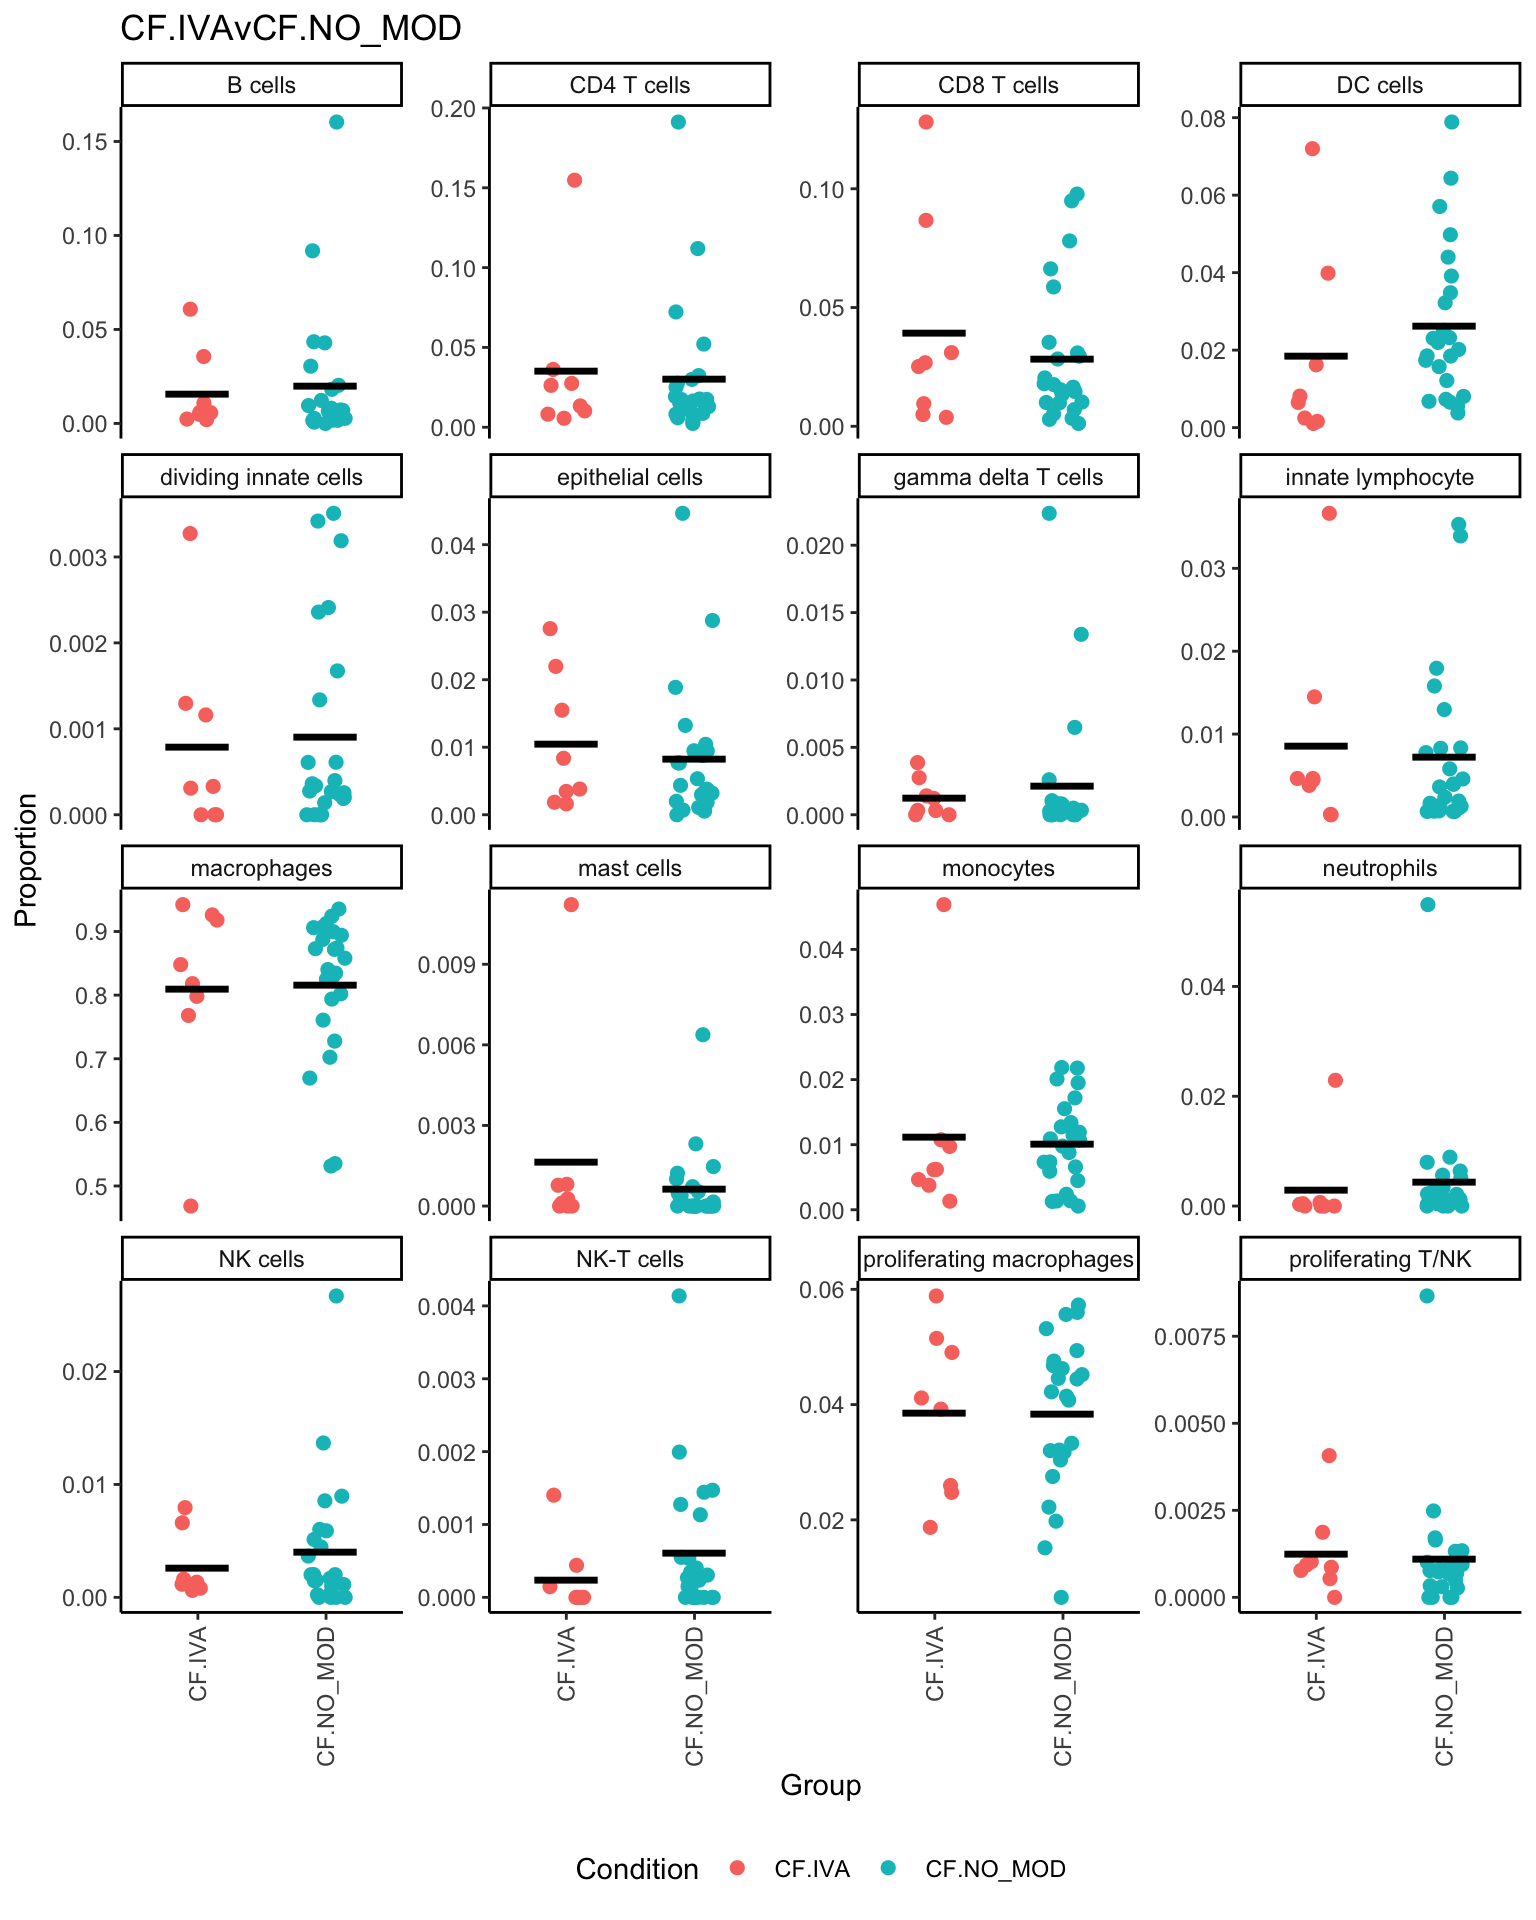
p <- vector("list", ncol(contr))

for(i in 1:ncol(contr)){
  print(knitr::kable(topTable(fit2, coef = i, number = Inf),
                     caption = colnames(contr)[i]))

  props$Proportions %>% data.frame %>%
    left_join(info,
              by = c("sample" = "sample.id")) %>%
    mutate(Group = Group_severity) %>%
    dplyr::filter(Group %in% names(contr[,i])[abs(contr[, i]) > 0]) -> dat

  if(length(unique(dat$Group)) > 2) dat$Group <- str_remove(dat$Group, ".(M|S)$")
  ggplot(dat, aes(x = Group,
                  y = Freq,
                  colour = Group,
                  group = Group)) +
    geom_jitter(stat = "identity",
                width = 0.15,
                size = 2) +
    stat_summary(geom = "point",
      fun.y = "mean",
      col = "black",
      shape = "_",
      size = 14) +
    theme_classic() +
    theme(axis.text.x = element_text(angle = 90,
                                     hjust = 1,
                                     vjust = 0.5),
          legend.position = "bottom",
          legend.direction = "horizontal") +
    labs(x = "Group", y = "Proportion",
         colour = "Condition") +
    facet_wrap(~clusters, scales = "free_y", ncol = 4) +
    ggtitle(colnames(contr)[i]) -> p[[i]]

  print(p[[i]])
}| logFC | AveExpr | t | P.Value | adj.P.Val | B | |
|---|---|---|---|---|---|---|
| monocytes | -0.0866804 | 0.1046134 | -4.5306909 | 0.0000812 | 0.0012991 | 1.413145 |
| CD8 T cells | -0.0741143 | 0.1671905 | -1.8914421 | 0.0679821 | 0.5438572 | -4.779980 |
| macrophages | 0.0887124 | 1.1311489 | 1.3773538 | 0.1783099 | 0.7581057 | -5.557175 |
| NK-T cells | 0.0121502 | 0.0158486 | 1.3412624 | 0.1895264 | 0.7581057 | -5.603834 |
| gamma delta T cells | 0.0183142 | 0.0242845 | 1.1081569 | 0.2762713 | 0.8449842 | -5.878127 |
| neutrophils | 0.0195569 | 0.0365714 | 1.0017495 | 0.3241777 | 0.8449842 | -5.987338 |
| B cells | -0.0286482 | 0.1209003 | -0.6654712 | 0.5106920 | 0.8449842 | -6.263453 |
| DC cells | -0.0196543 | 0.1376617 | -0.6424225 | 0.5253424 | 0.8449842 | -6.278446 |
| dividing innate cells | -0.0073307 | 0.0232467 | -0.5587345 | 0.5803349 | 0.8449842 | -6.328590 |
| innate lymphocyte | 0.0095538 | 0.0733282 | 0.4797679 | 0.6347417 | 0.8449842 | -6.369579 |
| mast cells | -0.0047191 | 0.0158193 | -0.4753958 | 0.6378193 | 0.8449842 | -6.371669 |
| NK cells | -0.0065650 | 0.0505933 | -0.4046685 | 0.6884847 | 0.8449842 | -6.402857 |
| epithelial cells | -0.0139599 | 0.0868234 | -0.3768585 | 0.7088574 | 0.8449842 | -6.413742 |
| proliferating macrophages | 0.0077459 | 0.1876178 | 0.3356832 | 0.7393612 | 0.8449842 | -6.428493 |
| proliferating T/NK | -0.0018288 | 0.0310578 | -0.1712652 | 0.8651221 | 0.9227969 | -6.470429 |
| CD4 T cells | -0.0008403 | 0.1587382 | -0.0216559 | 0.9828618 | 0.9828618 | -6.484976 |
| logFC | AveExpr | t | P.Value | adj.P.Val | B | |
|---|---|---|---|---|---|---|
| NK-T cells | -0.0178018 | 0.0158486 | -1.6771544 | 0.1035136 | 0.9866568 | -4.880636 |
| mast cells | 0.0125230 | 0.0158193 | 1.0766777 | 0.2898866 | 0.9866568 | -5.649573 |
| monocytes | 0.0204331 | 0.1046134 | 0.9115003 | 0.3690271 | 0.9866568 | -5.807150 |
| CD8 T cells | 0.0365180 | 0.1671905 | 0.7953837 | 0.4324648 | 0.9866568 | -5.903003 |
| neutrophils | 0.0180237 | 0.0365714 | 0.7879191 | 0.4366948 | 0.9866568 | -5.908806 |
| gamma delta T cells | -0.0131149 | 0.0242845 | -0.6772627 | 0.5032350 | 0.9866568 | -5.987763 |
| B cells | -0.0232246 | 0.1209003 | -0.4604248 | 0.6484389 | 0.9866568 | -6.108684 |
| macrophages | -0.0324599 | 1.1311489 | -0.4301181 | 0.6700981 | 0.9866568 | -6.121979 |
| DC cells | 0.0105310 | 0.1376617 | 0.2937740 | 0.7708971 | 0.9866568 | -6.170703 |
| proliferating T/NK | 0.0033930 | 0.0310578 | 0.2711860 | 0.7880358 | 0.9866568 | -6.177025 |
| dividing innate cells | 0.0034334 | 0.0232467 | 0.2233408 | 0.8247274 | 0.9866568 | -6.188731 |
| proliferating macrophages | 0.0057278 | 0.1876178 | 0.2118509 | 0.8336040 | 0.9866568 | -6.191205 |
| NK cells | -0.0036478 | 0.0505933 | -0.1918965 | 0.8490679 | 0.9866568 | -6.195195 |
| epithelial cells | -0.0034896 | 0.0868234 | -0.0803995 | 0.9364385 | 0.9866568 | -6.210234 |
| innate lymphocyte | -0.0015606 | 0.0733282 | -0.0668821 | 0.9471027 | 0.9866568 | -6.211222 |
| CD4 T cells | 0.0007665 | 0.1587382 | 0.0168600 | 0.9866568 | 0.9866568 | -6.213299 |
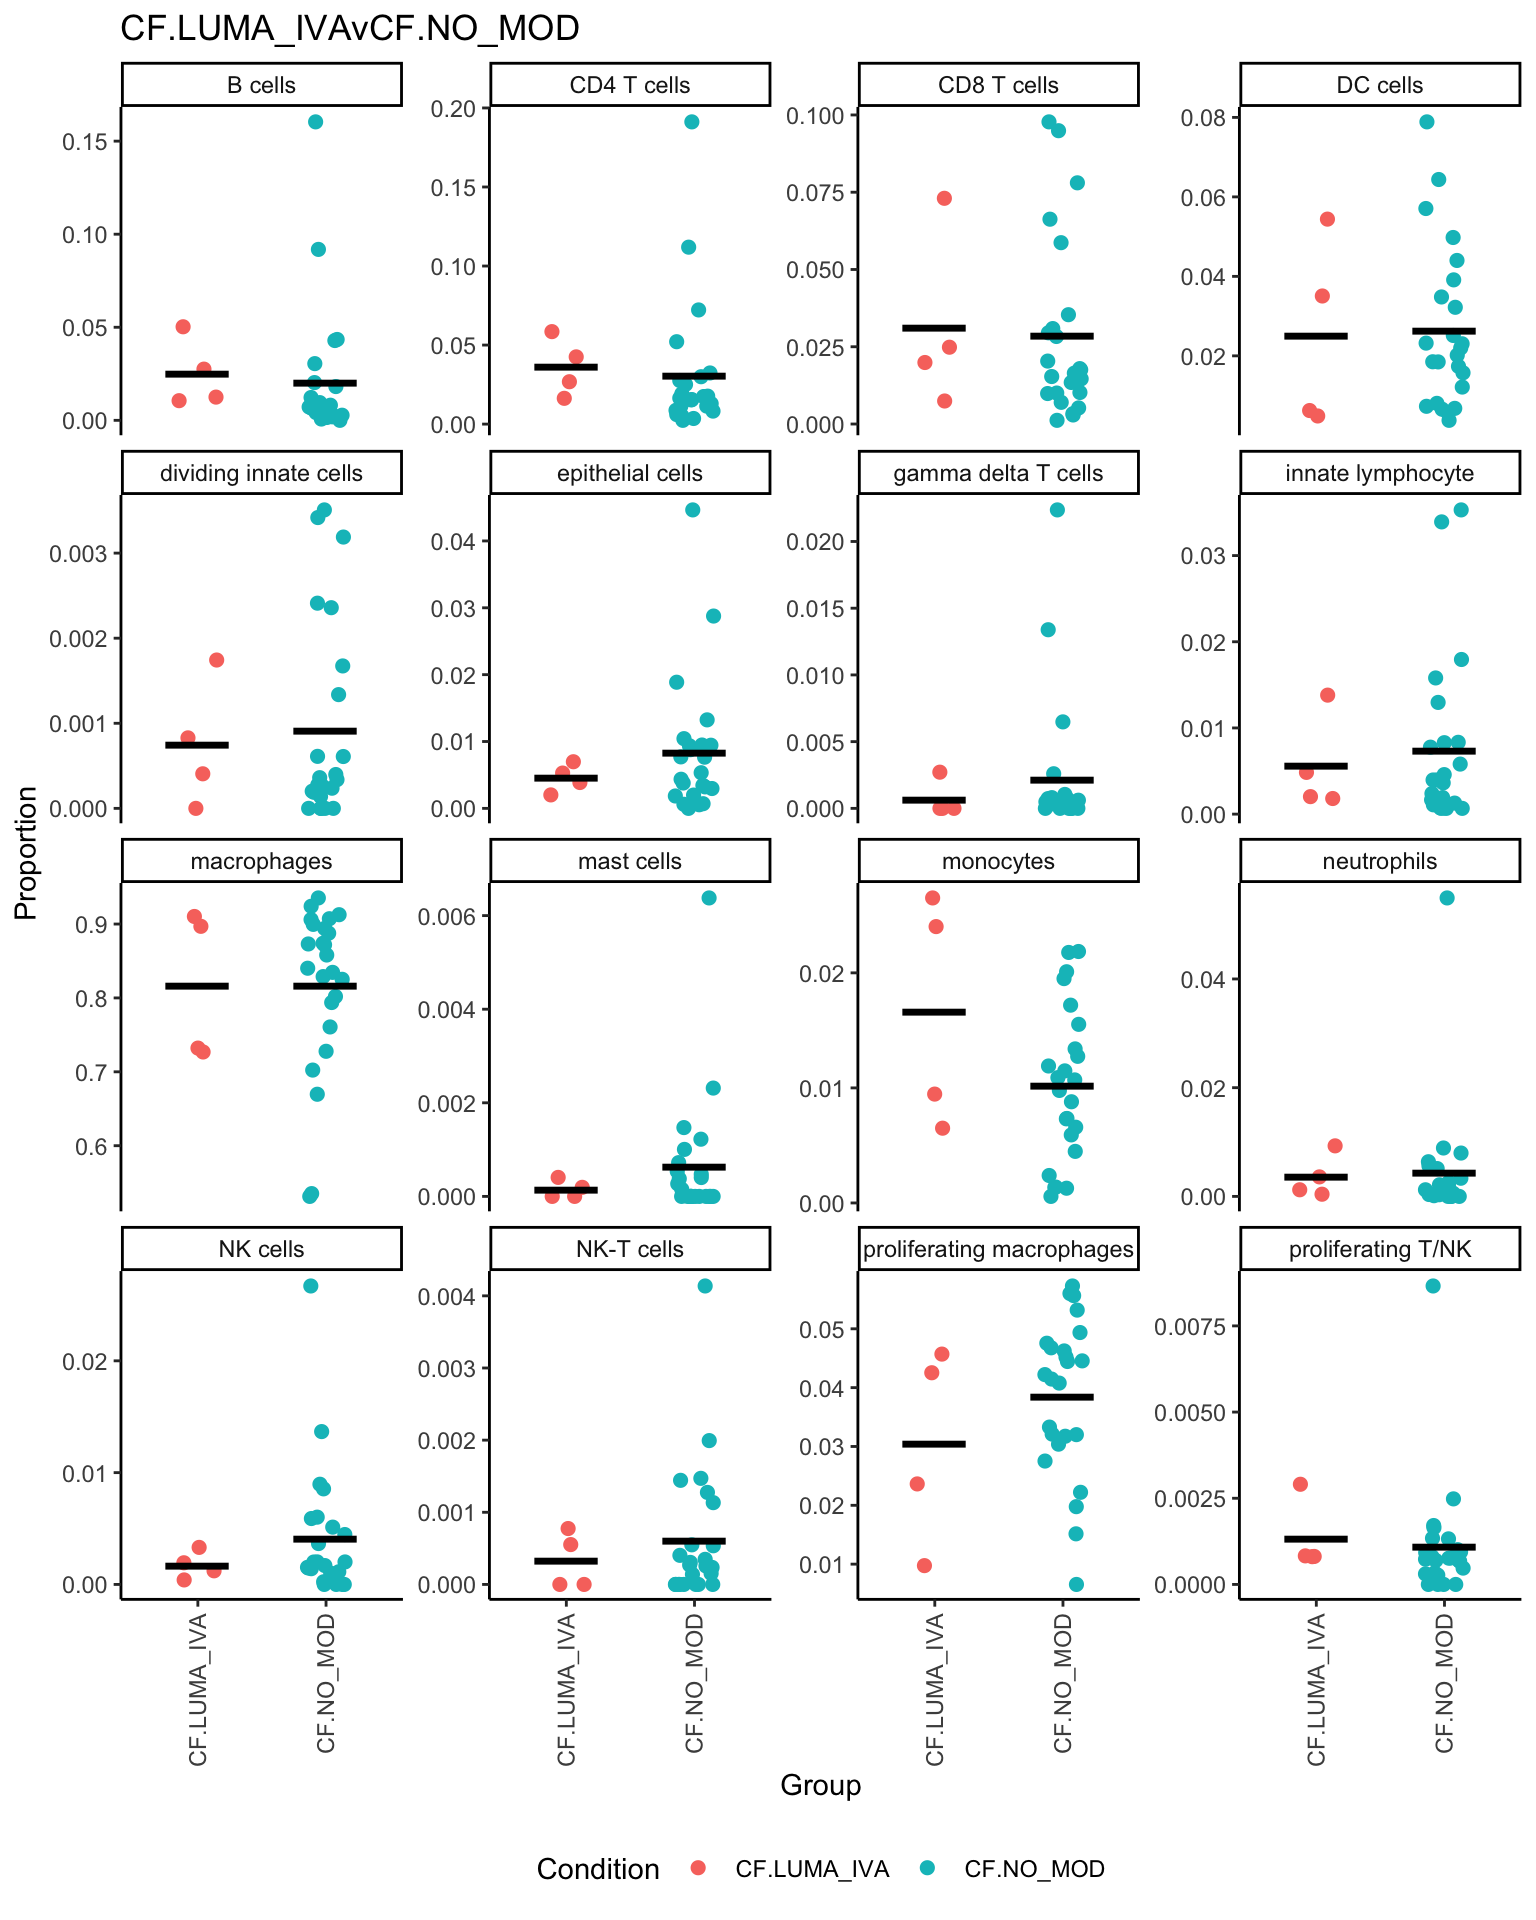
| logFC | AveExpr | t | P.Value | adj.P.Val | B | |
|---|---|---|---|---|---|---|
| neutrophils | -0.0623699 | 0.0365714 | -3.4098325 | 0.0018145 | 0.0290321 | -1.482959 |
| innate lymphocyte | 0.0449772 | 0.0733282 | 2.4107062 | 0.0220055 | 0.1760439 | -3.756250 |
| mast cells | -0.0165537 | 0.0158193 | -1.7798855 | 0.0848459 | 0.4089010 | -4.914571 |
| CD8 T cells | 0.0618318 | 0.1671905 | 1.6842303 | 0.1022253 | 0.4089010 | -5.066366 |
| NK cells | 0.0236804 | 0.0505933 | 1.5579412 | 0.1293431 | 0.4138978 | -5.255670 |
| CD4 T cells | 0.0514344 | 0.1587382 | 1.4148505 | 0.1671225 | 0.4456600 | -5.455042 |
| monocytes | 0.0223527 | 0.1046134 | 1.2470181 | 0.2216793 | 0.4552617 | -5.667274 |
| DC cells | 0.0342966 | 0.1376617 | 1.1964989 | 0.2406122 | 0.4552617 | -5.726384 |
| macrophages | -0.0697972 | 1.1311489 | -1.1566397 | 0.2562936 | 0.4552617 | -5.771489 |
| gamma delta T cells | -0.0168610 | 0.0242845 | -1.0889147 | 0.2845386 | 0.4552617 | -5.844982 |
| NK-T cells | 0.0075934 | 0.0158486 | 0.8946787 | 0.3778153 | 0.5495495 | -6.032605 |
| B cells | 0.0332548 | 0.1209003 | 0.8244896 | 0.4159878 | 0.5546504 | -6.091776 |
| proliferating T/NK | 0.0053150 | 0.0310578 | 0.5312473 | 0.5990128 | 0.7372465 | -6.288659 |
| proliferating macrophages | 0.0039370 | 0.1876178 | 0.1821064 | 0.8566796 | 0.9363171 | -6.413262 |
| epithelial cells | 0.0053809 | 0.0868234 | 0.1550425 | 0.8777973 | 0.9363171 | -6.417843 |
| dividing innate cells | -0.0001671 | 0.0232467 | -0.0135948 | 0.9892399 | 0.9892399 | -6.429838 |
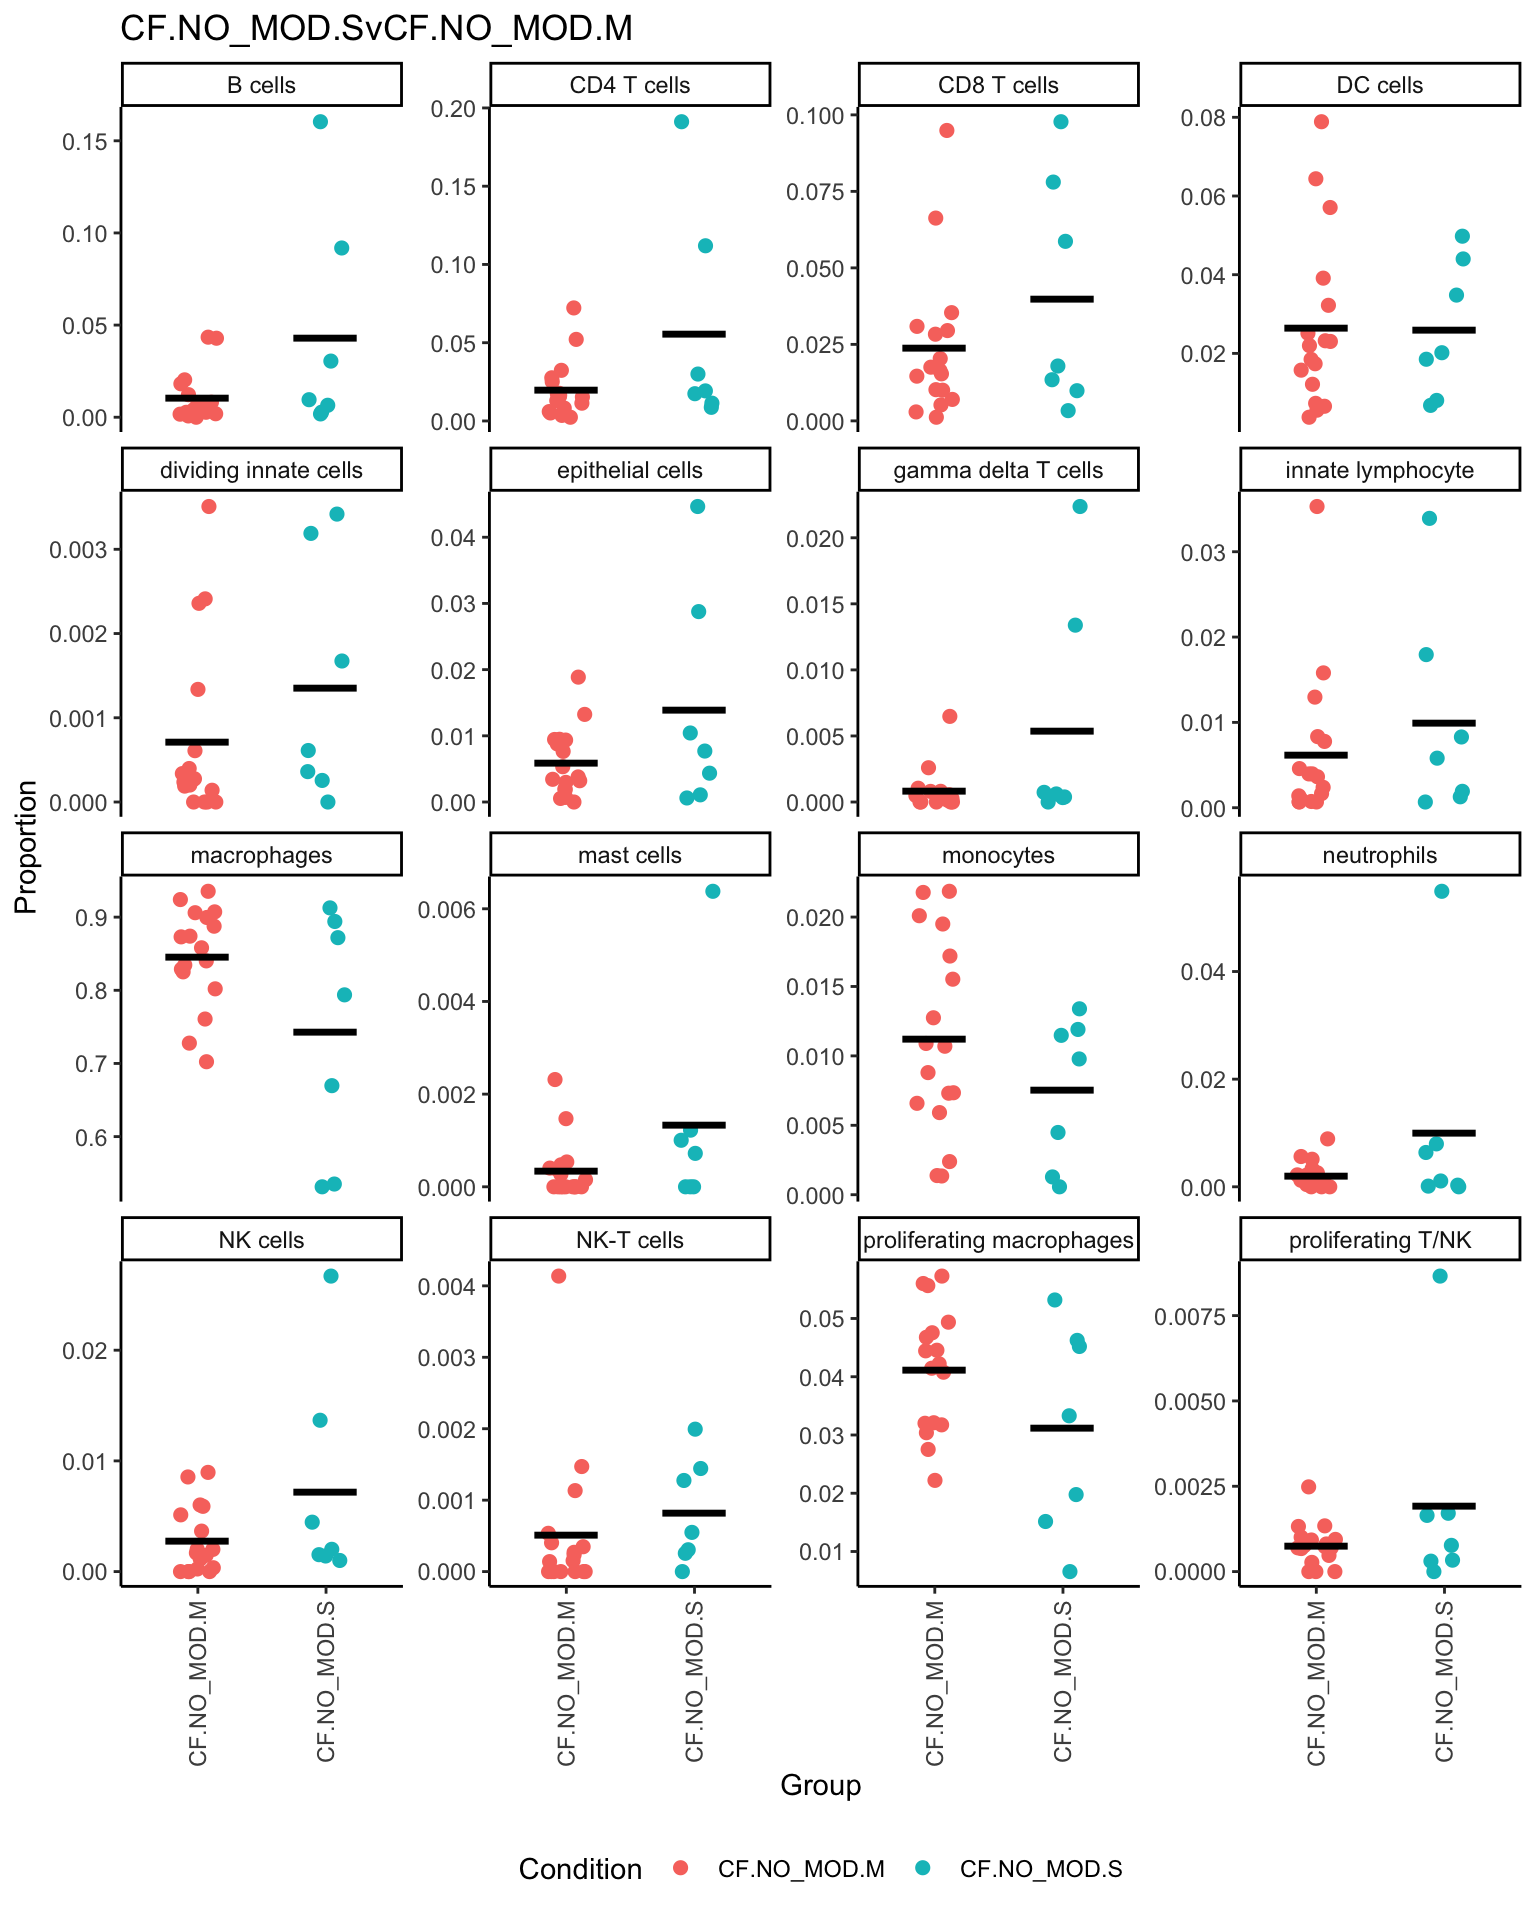
| logFC | AveExpr | t | P.Value | adj.P.Val | B | |
|---|---|---|---|---|---|---|
| neutrophils | 0.0399716 | 0.0365714 | 2.1596541 | 0.0386053 | 0.3092130 | -4.238117 |
| B cells | 0.0881572 | 0.1209003 | 2.1600493 | 0.0386516 | 0.3092130 | -4.238184 |
| macrophages | -0.0954724 | 1.1311489 | -1.5635542 | 0.1281186 | 0.4022276 | -5.236842 |
| NK cells | 0.0222587 | 0.0505933 | 1.4472245 | 0.1578166 | 0.4022276 | -5.400533 |
| CD4 T cells | 0.0486446 | 0.1587382 | 1.3224106 | 0.1957475 | 0.4022276 | -5.563891 |
| gamma delta T cells | 0.0204081 | 0.0242845 | 1.3025331 | 0.2022756 | 0.4022276 | -5.588735 |
| mast cells | 0.0113367 | 0.0158193 | 1.2046501 | 0.2374051 | 0.4022276 | -5.705992 |
| proliferating macrophages | -0.0258037 | 0.1876178 | -1.1795495 | 0.2471137 | 0.4022276 | -5.734717 |
| proliferating T/NK | 0.0114745 | 0.0310578 | 1.1334637 | 0.2656620 | 0.4022276 | -5.786035 |
| dividing innate cells | 0.0139205 | 0.0232467 | 1.1191517 | 0.2716253 | 0.4022276 | -5.801588 |
| epithelial cells | 0.0389018 | 0.0868234 | 1.1077417 | 0.2765315 | 0.4022276 | -5.813788 |
| NK-T cells | 0.0086840 | 0.0158486 | 1.0111665 | 0.3197215 | 0.4262954 | -5.913028 |
| monocytes | -0.0115897 | 0.1046134 | -0.6389809 | 0.5275030 | 0.6492345 | -6.214598 |
| innate lymphocyte | 0.0043002 | 0.0733282 | 0.2277804 | 0.8213044 | 0.8980556 | -6.392380 |
| DC cells | 0.0058333 | 0.1376617 | 0.2011164 | 0.8419271 | 0.8980556 | -6.398113 |
| CD8 T cells | 0.0012509 | 0.1671905 | 0.0336741 | 0.9733538 | 0.9733538 | -6.417864 |
Session info
sessioninfo::session_info()─ Session info ───────────────────────────────────────────────────────────────
setting value
version R version 4.3.3 (2024-02-29)
os macOS 15.5
system aarch64, darwin20
ui X11
language (EN)
collate en_US.UTF-8
ctype en_US.UTF-8
tz Australia/Melbourne
date 2026-04-02
pandoc 3.6.3 @ /Applications/RStudio.app/Contents/Resources/app/quarto/bin/tools/aarch64/ (via rmarkdown)
quarto 1.8.25 @ /Applications/RStudio.app/Contents/Resources/app/quarto/bin/quarto
─ Packages ───────────────────────────────────────────────────────────────────
! package * version date (UTC) lib source
P abind 1.4-5 2016-07-21 [?] RSPM (R 4.3.0)
P AnnotationDbi * 1.64.1 2023-11-02 [?] Bioconductor
P backports 1.4.1 2021-12-13 [?] RSPM (R 4.3.0)
P base64enc 0.1-3 2015-07-28 [?] RSPM (R 4.3.0)
P Biobase * 2.62.0 2023-10-26 [?] Bioconductor
P BiocGenerics * 0.48.1 2023-11-02 [?] Bioconductor
P BiocManager 1.30.22 2023-08-08 [?] RSPM (R 4.3.0)
P Biostrings 2.70.2 2024-01-30 [?] Bioconductor 3.18 (R 4.3.2)
P bit 4.0.5 2022-11-15 [?] RSPM (R 4.3.0)
P bit64 4.0.5 2020-08-30 [?] RSPM (R 4.3.0)
P bitops 1.0-7 2021-04-24 [?] RSPM (R 4.3.0)
P blob 1.2.4 2023-03-17 [?] RSPM (R 4.3.0)
P bslib 0.6.1 2023-11-28 [?] RSPM (R 4.3.0)
P cachem 1.0.8 2023-05-01 [?] RSPM (R 4.3.0)
P callr 3.7.3 2022-11-02 [?] RSPM (R 4.3.0)
P checkmate 2.3.1 2023-12-04 [?] RSPM (R 4.3.0)
P circlize 0.4.15 2022-05-10 [?] RSPM (R 4.3.0)
P cli 3.6.5 2025-04-23 [?] RSPM
P clue 0.3-65 2023-09-23 [?] RSPM (R 4.3.0)
P cluster 2.1.6 2023-12-01 [?] CRAN (R 4.3.3)
P clustree * 0.5.1 2023-11-05 [?] RSPM (R 4.3.0)
P codetools 0.2-19 2023-02-01 [?] CRAN (R 4.3.3)
P colorspace 2.1-0 2023-01-23 [?] RSPM (R 4.3.0)
P ComplexHeatmap 2.18.0 2023-10-26 [?] Bioconductor
P cowplot 1.1.3 2024-01-22 [?] RSPM (R 4.3.0)
P crayon 1.5.2 2022-09-29 [?] RSPM (R 4.3.0)
P data.table 1.15.0 2024-01-30 [?] RSPM (R 4.3.0)
P DBI 1.2.1 2024-01-12 [?] RSPM (R 4.3.0)
P DelayedArray 0.28.0 2023-11-06 [?] Bioconductor
P deldir 2.0-2 2023-11-23 [?] RSPM (R 4.3.0)
P dendextend 1.17.1 2023-03-25 [?] RSPM (R 4.3.0)
P digest 0.6.34 2024-01-11 [?] RSPM (R 4.3.0)
P dittoSeq * 1.14.2 2024-02-10 [?] Bioconductor 3.18 (R 4.3.2)
P doParallel 1.0.17 2022-02-07 [?] RSPM (R 4.3.0)
P dplyr * 1.1.4 2023-11-17 [?] RSPM (R 4.3.0)
P dynamicTreeCut 1.63-1 2016-03-11 [?] RSPM (R 4.3.0)
P edgeR * 4.0.15 2024-02-10 [?] Bioconductor 3.18 (R 4.3.2)
P ellipsis 0.3.2 2021-04-29 [?] RSPM (R 4.3.0)
P evaluate 0.23 2023-11-01 [?] RSPM (R 4.3.0)
P fansi 1.0.6 2023-12-08 [?] RSPM (R 4.3.0)
P farver 2.1.1 2022-07-06 [?] RSPM (R 4.3.0)
P fastcluster 1.3.0 2025-05-07 [?] RSPM
P fastmap 1.1.1 2023-02-24 [?] RSPM (R 4.3.0)
P fitdistrplus 1.1-11 2023-04-25 [?] RSPM (R 4.3.0)
P forcats * 1.0.0 2023-01-29 [?] RSPM (R 4.3.0)
P foreach 1.5.2 2022-02-02 [?] RSPM (R 4.3.0)
P foreign 0.8-86 2023-11-28 [?] CRAN (R 4.3.3)
P Formula 1.2-5 2023-02-24 [?] RSPM (R 4.3.0)
P fs 1.6.6 2025-04-12 [?] RSPM
P future 1.33.1 2023-12-22 [?] RSPM (R 4.3.0)
P future.apply 1.11.1 2023-12-21 [?] RSPM (R 4.3.0)
P generics 0.1.3 2022-07-05 [?] RSPM (R 4.3.0)
P GenomeInfoDb * 1.38.6 2024-02-10 [?] Bioconductor 3.18 (R 4.3.2)
P GenomeInfoDbData 1.2.11 2024-02-16 [?] Bioconductor
P GenomicRanges * 1.54.1 2023-10-30 [?] Bioconductor
P GetoptLong 1.0.5 2020-12-15 [?] RSPM (R 4.3.0)
P getPass 0.2-4 2023-12-10 [?] RSPM (R 4.3.0)
P ggforce 0.4.2 2024-02-19 [?] RSPM (R 4.3.0)
P ggplot2 * 3.5.2 2025-04-09 [?] RSPM
P ggraph * 2.2.0 2024-02-27 [?] RSPM (R 4.3.0)
P ggrepel 0.9.5 2024-01-10 [?] RSPM (R 4.3.0)
P ggridges 0.5.6 2024-01-23 [?] RSPM (R 4.3.0)
P git2r 0.33.0 2023-11-26 [?] RSPM (R 4.3.0)
P glmGamPoi * 1.14.3 2024-02-10 [?] Bioconductor 3.18 (R 4.3.2)
P GlobalOptions 0.1.2 2020-06-10 [?] RSPM (R 4.3.0)
P globals 0.16.2 2022-11-21 [?] RSPM (R 4.3.0)
P glue * 1.8.0 2024-09-30 [?] RSPM
P GO.db 3.18.0 2024-02-21 [?] Bioconductor
P goftest 1.2-3 2021-10-07 [?] RSPM (R 4.3.0)
P graphlayouts 1.1.0 2024-01-19 [?] RSPM (R 4.3.0)
P gridExtra 2.3 2017-09-09 [?] RSPM (R 4.3.0)
P gtable 0.3.6 2024-10-25 [?] RSPM
P here * 1.0.1 2020-12-13 [?] RSPM (R 4.3.0)
P Hmisc 5.1-1 2023-09-12 [?] RSPM (R 4.3.0)
P hms 1.1.3 2023-03-21 [?] RSPM (R 4.3.0)
P htmlTable 2.4.2 2023-10-29 [?] RSPM (R 4.3.0)
P htmltools 0.5.8.1 2024-04-04 [?] RSPM
P htmlwidgets 1.6.4 2023-12-06 [?] RSPM (R 4.3.0)
P httpuv 1.6.14 2024-01-26 [?] RSPM (R 4.3.0)
P httr 1.4.7 2023-08-15 [?] RSPM (R 4.3.0)
P ica 1.0-3 2022-07-08 [?] RSPM (R 4.3.0)
P igraph 2.0.1.1 2024-01-30 [?] RSPM (R 4.3.0)
P impute 1.76.0 2023-10-26 [?] Bioconductor
P IRanges * 2.36.0 2023-10-26 [?] Bioconductor
P irlba 2.3.5.1 2022-10-03 [?] RSPM (R 4.3.0)
P iterators 1.0.14 2022-02-05 [?] RSPM (R 4.3.0)
P jquerylib 0.1.4 2021-04-26 [?] RSPM (R 4.3.0)
P jsonlite 1.8.8 2023-12-04 [?] RSPM (R 4.3.0)
P KEGGREST 1.42.0 2023-10-26 [?] Bioconductor
P KernSmooth 2.23-22 2023-07-10 [?] CRAN (R 4.3.3)
P knitr 1.50 2025-03-16 [?] RSPM
P labeling 0.4.3 2023-08-29 [?] RSPM (R 4.3.0)
P later 1.3.2 2023-12-06 [?] RSPM (R 4.3.0)
P lattice 0.22-5 2023-10-24 [?] CRAN (R 4.3.3)
P lazyeval 0.2.2 2019-03-15 [?] RSPM (R 4.3.0)
P leiden 0.4.3.1 2023-11-17 [?] RSPM (R 4.3.0)
P lifecycle 1.0.4 2023-11-07 [?] RSPM (R 4.3.0)
P limma * 3.58.1 2023-11-02 [?] Bioconductor
P listenv 0.9.1 2024-01-29 [?] RSPM (R 4.3.0)
P lmtest 0.9-40 2022-03-21 [?] RSPM (R 4.3.0)
P locfit 1.5-9.8 2023-06-11 [?] RSPM (R 4.3.0)
P lubridate * 1.9.3 2023-09-27 [?] RSPM (R 4.3.0)
P magrittr 2.0.3 2022-03-30 [?] RSPM (R 4.3.0)
P MASS 7.3-60.0.1 2024-01-13 [?] CRAN (R 4.3.3)
P Matrix 1.6-5 2024-01-11 [?] CRAN (R 4.3.3)
P MatrixGenerics * 1.14.0 2023-10-26 [?] Bioconductor
P matrixStats * 1.2.0 2023-12-11 [?] RSPM (R 4.3.0)
P memoise 2.0.1 2021-11-26 [?] RSPM (R 4.3.0)
P mime 0.12 2021-09-28 [?] RSPM (R 4.3.0)
P miniUI 0.1.1.1 2018-05-18 [?] RSPM (R 4.3.0)
P munsell 0.5.0 2018-06-12 [?] RSPM (R 4.3.0)
P nlme 3.1-164 2023-11-27 [?] CRAN (R 4.3.3)
P nnet 7.3-19 2023-05-03 [?] CRAN (R 4.3.3)
P org.Hs.eg.db * 3.18.0 2024-02-21 [?] Bioconductor
P paletteer * 1.6.0 2024-01-21 [?] RSPM (R 4.3.0)
P parallelly 1.37.0 2024-02-14 [?] RSPM (R 4.3.0)
P patchwork * 1.3.1 2025-06-21 [?] RSPM
P pbapply 1.7-2 2023-06-27 [?] RSPM (R 4.3.0)
P pheatmap 1.0.12 2019-01-04 [?] RSPM (R 4.3.0)
P pillar 1.9.0 2023-03-22 [?] RSPM (R 4.3.0)
P pkgconfig 2.0.3 2019-09-22 [?] RSPM (R 4.3.0)
P plotly 4.10.4 2024-01-13 [?] RSPM (R 4.3.0)
P plyr 1.8.9 2023-10-02 [?] RSPM (R 4.3.0)
P png 0.1-8 2022-11-29 [?] RSPM (R 4.3.0)
P polyclip 1.10-6 2023-09-27 [?] RSPM (R 4.3.0)
P preprocessCore 1.64.0 2023-10-26 [?] Bioconductor
P prismatic 1.1.1 2022-08-15 [?] RSPM (R 4.3.0)
P processx 3.8.3 2023-12-10 [?] RSPM (R 4.3.0)
P progressr 0.14.0 2023-08-10 [?] RSPM (R 4.3.0)
P promises 1.2.1 2023-08-10 [?] RSPM (R 4.3.0)
P ps 1.7.6 2024-01-18 [?] RSPM (R 4.3.0)
P purrr * 1.0.2 2023-08-10 [?] RSPM (R 4.3.0)
P R6 2.5.1 2021-08-19 [?] RSPM (R 4.3.0)
P RANN 2.6.1 2019-01-08 [?] RSPM (R 4.3.0)
P RColorBrewer 1.1-3 2022-04-03 [?] RSPM (R 4.3.0)
P Rcpp 1.0.12 2024-01-09 [?] RSPM (R 4.3.0)
P RcppAnnoy 0.0.22 2024-01-23 [?] RSPM (R 4.3.0)
P RCurl 1.98-1.14 2024-01-09 [?] RSPM (R 4.3.0)
P readr * 2.1.5 2024-01-10 [?] RSPM (R 4.3.0)
P rematch2 2.1.2 2020-05-01 [?] RSPM (R 4.3.0)
renv 1.1.4 2025-03-20 [1] CRAN (R 4.3.3)
P reshape2 1.4.4 2020-04-09 [?] RSPM (R 4.3.0)
P reticulate 1.42.0 2025-03-25 [?] RSPM
P rjson 0.2.21 2022-01-09 [?] RSPM (R 4.3.0)
P rlang 1.1.6 2025-04-11 [?] RSPM
P rmarkdown 2.29 2024-11-04 [?] RSPM
P ROCR 1.0-11 2020-05-02 [?] RSPM (R 4.3.0)
P rpart 4.1.23 2023-12-05 [?] CRAN (R 4.3.3)
P rprojroot 2.0.4 2023-11-05 [?] RSPM (R 4.3.0)
P RSQLite 2.3.5 2024-01-21 [?] RSPM (R 4.3.0)
P rstudioapi 0.15.0 2023-07-07 [?] RSPM (R 4.3.0)
P Rtsne 0.17 2023-12-07 [?] RSPM (R 4.3.0)
P S4Arrays 1.2.0 2023-10-26 [?] Bioconductor
P S4Vectors * 0.40.2 2023-11-25 [?] Bioconductor 3.18 (R 4.3.2)
P sass 0.4.10 2025-04-11 [?] RSPM
P scales 1.3.0 2023-11-28 [?] RSPM (R 4.3.0)
P scattermore 1.2 2023-06-12 [?] RSPM (R 4.3.0)
P sctransform 0.4.1 2023-10-19 [?] RSPM (R 4.3.0)
P sessioninfo 1.2.3 2025-02-05 [?] RSPM
P Seurat * 4.4.0 2023-09-28 [?] RSPM (R 4.3.2)
P SeuratObject * 4.1.4 2023-09-26 [?] RSPM (R 4.3.2)
P shape 1.4.6 2021-05-19 [?] RSPM (R 4.3.0)
P shiny 1.8.0 2023-11-17 [?] RSPM (R 4.3.0)
P SingleCellExperiment * 1.24.0 2023-11-06 [?] Bioconductor
P sp 2.1-3 2024-01-30 [?] RSPM (R 4.3.0)
P SparseArray 1.2.4 2024-02-10 [?] Bioconductor 3.18 (R 4.3.2)
P spatstat.data 3.0-4 2024-01-15 [?] RSPM (R 4.3.0)
P spatstat.explore 3.2-6 2024-02-01 [?] RSPM (R 4.3.0)
P spatstat.geom 3.2-8 2024-01-26 [?] RSPM (R 4.3.0)
P spatstat.random 3.2-2 2023-11-29 [?] RSPM (R 4.3.0)
P spatstat.sparse 3.0-3 2023-10-24 [?] RSPM (R 4.3.0)
P spatstat.utils 3.0-4 2023-10-24 [?] RSPM (R 4.3.0)
P speckle * 1.2.0 2023-10-26 [?] Bioconductor
P statmod 1.5.0 2023-01-06 [?] RSPM (R 4.3.0)
P stringi 1.8.3 2023-12-11 [?] RSPM (R 4.3.0)
P stringr * 1.5.1 2023-11-14 [?] RSPM (R 4.3.0)
P SummarizedExperiment * 1.32.0 2023-11-06 [?] Bioconductor
P survival 3.5-8 2024-02-14 [?] CRAN (R 4.3.3)
P tensor 1.5 2012-05-05 [?] RSPM (R 4.3.0)
P tibble * 3.2.1 2023-03-20 [?] RSPM (R 4.3.0)
P tidygraph 1.3.1 2024-01-30 [?] RSPM (R 4.3.0)
P tidyHeatmap * 1.8.1 2022-05-20 [?] RSPM (R 4.3.2)
P tidyr * 1.3.1 2024-01-24 [?] RSPM (R 4.3.0)
P tidyselect 1.2.1 2024-03-11 [?] RSPM
P tidyverse * 2.0.0 2023-02-22 [?] RSPM (R 4.3.0)
P timechange 0.3.0 2024-01-18 [?] RSPM (R 4.3.0)
P tweenr 2.0.3 2024-02-26 [?] RSPM (R 4.3.0)
P tzdb 0.4.0 2023-05-12 [?] RSPM (R 4.3.0)
P utf8 1.2.4 2023-10-22 [?] RSPM (R 4.3.0)
P uwot 0.1.16 2023-06-29 [?] RSPM (R 4.3.0)
P vctrs 0.6.5 2023-12-01 [?] RSPM (R 4.3.0)
P viridis 0.6.5 2024-01-29 [?] RSPM (R 4.3.0)
P viridisLite 0.4.2 2023-05-02 [?] RSPM (R 4.3.0)
P WGCNA 1.73 2024-09-18 [?] RSPM
P whisker 0.4.1 2022-12-05 [?] RSPM (R 4.3.0)
P withr 3.0.0 2024-01-16 [?] RSPM (R 4.3.0)
P workflowr * 1.7.1 2023-08-23 [?] RSPM (R 4.3.2)
P xfun 0.52 2025-04-02 [?] RSPM
P xtable 1.8-4 2019-04-21 [?] RSPM (R 4.3.0)
P XVector 0.42.0 2023-10-26 [?] Bioconductor
P yaml 2.3.8 2023-12-11 [?] RSPM (R 4.3.0)
P zlibbioc 1.48.0 2023-10-26 [?] Bioconductor
P zoo 1.8-12 2023-04-13 [?] RSPM (R 4.3.0)
[1] /Users/maksimovicjovana/Library/CloudStorage/OneDrive-PeterMac/Desktop/projects/collaborative_research/paediatric-cf-inflammation-citeseq/renv/library/R-4.3/aarch64-apple-darwin20
[2] /Users/maksimovicjovana/Library/Caches/org.R-project.R/R/renv/sandbox/R-4.3/aarch64-apple-darwin20/ac5c2659
* ── Packages attached to the search path.
P ── Loaded and on-disk path mismatch.
──────────────────────────────────────────────────────────────────────────────
sessionInfo()R version 4.3.3 (2024-02-29)
Platform: aarch64-apple-darwin20 (64-bit)
Running under: macOS 15.5
Matrix products: default
BLAS: /Library/Frameworks/R.framework/Versions/4.3-arm64/Resources/lib/libRblas.0.dylib
LAPACK: /Library/Frameworks/R.framework/Versions/4.3-arm64/Resources/lib/libRlapack.dylib; LAPACK version 3.11.0
locale:
[1] en_US.UTF-8/en_US.UTF-8/en_US.UTF-8/C/en_US.UTF-8/en_US.UTF-8
time zone: Australia/Melbourne
tzcode source: internal
attached base packages:
[1] stats4 stats graphics grDevices datasets utils methods
[8] base
other attached packages:
[1] here_1.0.1 tidyHeatmap_1.8.1
[3] paletteer_1.6.0 patchwork_1.3.1
[5] speckle_1.2.0 glue_1.8.0
[7] org.Hs.eg.db_3.18.0 AnnotationDbi_1.64.1
[9] clustree_0.5.1 ggraph_2.2.0
[11] dittoSeq_1.14.2 glmGamPoi_1.14.3
[13] SeuratObject_4.1.4 Seurat_4.4.0
[15] lubridate_1.9.3 forcats_1.0.0
[17] stringr_1.5.1 dplyr_1.1.4
[19] purrr_1.0.2 readr_2.1.5
[21] tidyr_1.3.1 tibble_3.2.1
[23] ggplot2_3.5.2 tidyverse_2.0.0
[25] edgeR_4.0.15 limma_3.58.1
[27] SingleCellExperiment_1.24.0 SummarizedExperiment_1.32.0
[29] Biobase_2.62.0 GenomicRanges_1.54.1
[31] GenomeInfoDb_1.38.6 IRanges_2.36.0
[33] S4Vectors_0.40.2 BiocGenerics_0.48.1
[35] MatrixGenerics_1.14.0 matrixStats_1.2.0
[37] workflowr_1.7.1
loaded via a namespace (and not attached):
[1] fs_1.6.6 spatstat.sparse_3.0-3 bitops_1.0-7
[4] httr_1.4.7 RColorBrewer_1.1-3 doParallel_1.0.17
[7] dynamicTreeCut_1.63-1 backports_1.4.1 tools_4.3.3
[10] sctransform_0.4.1 utf8_1.2.4 R6_2.5.1
[13] lazyeval_0.2.2 uwot_0.1.16 GetoptLong_1.0.5
[16] withr_3.0.0 sp_2.1-3 gridExtra_2.3
[19] preprocessCore_1.64.0 progressr_0.14.0 WGCNA_1.73
[22] cli_3.6.5 spatstat.explore_3.2-6 labeling_0.4.3
[25] sass_0.4.10 prismatic_1.1.1 spatstat.data_3.0-4
[28] ggridges_0.5.6 pbapply_1.7-2 foreign_0.8-86
[31] sessioninfo_1.2.3 parallelly_1.37.0 impute_1.76.0
[34] rstudioapi_0.15.0 RSQLite_2.3.5 generics_0.1.3
[37] shape_1.4.6 ica_1.0-3 spatstat.random_3.2-2
[40] dendextend_1.17.1 GO.db_3.18.0 Matrix_1.6-5
[43] fansi_1.0.6 abind_1.4-5 lifecycle_1.0.4
[46] whisker_0.4.1 yaml_2.3.8 SparseArray_1.2.4
[49] Rtsne_0.17 grid_4.3.3 blob_1.2.4
[52] promises_1.2.1 crayon_1.5.2 miniUI_0.1.1.1
[55] lattice_0.22-5 cowplot_1.1.3 KEGGREST_1.42.0
[58] pillar_1.9.0 knitr_1.50 ComplexHeatmap_2.18.0
[61] rjson_0.2.21 future.apply_1.11.1 codetools_0.2-19
[64] leiden_0.4.3.1 getPass_0.2-4 data.table_1.15.0
[67] vctrs_0.6.5 png_0.1-8 gtable_0.3.6
[70] rematch2_2.1.2 cachem_1.0.8 xfun_0.52
[73] S4Arrays_1.2.0 mime_0.12 tidygraph_1.3.1
[76] survival_3.5-8 pheatmap_1.0.12 iterators_1.0.14
[79] statmod_1.5.0 ellipsis_0.3.2 fitdistrplus_1.1-11
[82] ROCR_1.0-11 nlme_3.1-164 bit64_4.0.5
[85] RcppAnnoy_0.0.22 rprojroot_2.0.4 bslib_0.6.1
[88] irlba_2.3.5.1 rpart_4.1.23 KernSmooth_2.23-22
[91] Hmisc_5.1-1 colorspace_2.1-0 DBI_1.2.1
[94] nnet_7.3-19 tidyselect_1.2.1 processx_3.8.3
[97] bit_4.0.5 compiler_4.3.3 git2r_0.33.0
[100] htmlTable_2.4.2 DelayedArray_0.28.0 plotly_4.10.4
[103] checkmate_2.3.1 scales_1.3.0 lmtest_0.9-40
[106] callr_3.7.3 digest_0.6.34 goftest_1.2-3
[109] spatstat.utils_3.0-4 rmarkdown_2.29 XVector_0.42.0
[112] base64enc_0.1-3 htmltools_0.5.8.1 pkgconfig_2.0.3
[115] fastmap_1.1.1 rlang_1.1.6 GlobalOptions_0.1.2
[118] htmlwidgets_1.6.4 shiny_1.8.0 farver_2.1.1
[121] jquerylib_0.1.4 zoo_1.8-12 jsonlite_1.8.8
[124] RCurl_1.98-1.14 magrittr_2.0.3 Formula_1.2-5
[127] GenomeInfoDbData_1.2.11 munsell_0.5.0 Rcpp_1.0.12
[130] viridis_0.6.5 reticulate_1.42.0 stringi_1.8.3
[133] zlibbioc_1.48.0 MASS_7.3-60.0.1 plyr_1.8.9
[136] parallel_4.3.3 listenv_0.9.1 ggrepel_0.9.5
[139] deldir_2.0-2 Biostrings_2.70.2 graphlayouts_1.1.0
[142] splines_4.3.3 tensor_1.5 hms_1.1.3
[145] circlize_0.4.15 locfit_1.5-9.8 ps_1.7.6
[148] fastcluster_1.3.0 igraph_2.0.1.1 spatstat.geom_3.2-8
[151] reshape2_1.4.4 evaluate_0.23 renv_1.1.4
[154] BiocManager_1.30.22 tzdb_0.4.0 foreach_1.5.2
[157] tweenr_2.0.3 httpuv_1.6.14 RANN_2.6.1
[160] polyclip_1.10-6 future_1.33.1 clue_0.3-65
[163] scattermore_1.2 ggforce_0.4.2 xtable_1.8-4
[166] later_1.3.2 viridisLite_0.4.2 memoise_2.0.1
[169] cluster_2.1.6 timechange_0.3.0 globals_0.16.2