Figure 2
Jovana Maksimovic
April 01, 2026
Last updated: 2026-04-01
Checks: 7 0
Knit directory:
paediatric-cf-inflammation-citeseq/
This reproducible R Markdown analysis was created with workflowr (version 1.7.1). The Checks tab describes the reproducibility checks that were applied when the results were created. The Past versions tab lists the development history.
Great! Since the R Markdown file has been committed to the Git repository, you know the exact version of the code that produced these results.
Great job! The global environment was empty. Objects defined in the global environment can affect the analysis in your R Markdown file in unknown ways. For reproduciblity it’s best to always run the code in an empty environment.
The command set.seed(20240216) was run prior to running
the code in the R Markdown file. Setting a seed ensures that any results
that rely on randomness, e.g. subsampling or permutations, are
reproducible.
Great job! Recording the operating system, R version, and package versions is critical for reproducibility.
Nice! There were no cached chunks for this analysis, so you can be confident that you successfully produced the results during this run.
Great job! Using relative paths to the files within your workflowr project makes it easier to run your code on other machines.
Great! You are using Git for version control. Tracking code development and connecting the code version to the results is critical for reproducibility.
The results in this page were generated with repository version 5879432. See the Past versions tab to see a history of the changes made to the R Markdown and HTML files.
Note that you need to be careful to ensure that all relevant files for
the analysis have been committed to Git prior to generating the results
(you can use wflow_publish or
wflow_git_commit). workflowr only checks the R Markdown
file, but you know if there are other scripts or data files that it
depends on. Below is the status of the Git repository when the results
were generated:
Ignored files:
    Ignored:    .Rhistory
    Ignored:    .Rproj.user/
    Ignored:    analysis/.DS_Store
    Ignored:    analysis/obsolete/
    Ignored:    code/obsolete/
    Ignored:    data/.DS_Store
    Ignored:    data/C133_Neeland_batch0/
    Ignored:    data/C133_Neeland_batch1/
    Ignored:    data/C133_Neeland_batch2/
    Ignored:    data/C133_Neeland_batch3/
    Ignored:    data/C133_Neeland_batch4/
    Ignored:    data/C133_Neeland_batch5/
    Ignored:    data/C133_Neeland_batch6/
    Ignored:    data/C133_Neeland_merged/
    Ignored:    data/Neeland_processed_data_1.h5ad
    Ignored:    data/Neeland_processed_data_2.h5ad
    Ignored:    data/Neeland_processed_data_3.h5ad
    Ignored:    data/intermediate_objects/.DS_Store
    Ignored:    data/updated_h5ad_files/
    Ignored:    output/.DS_Store
    Ignored:    renv/library/
    Ignored:    renv/staging/

Untracked files:
    Untracked:  C133_Neeland_preprocessed_SCEs.tar.gz
    Untracked:  analysis/cellxgene_submission.Rmd
    Untracked:  data/GOBP_CYTOKINE_MEDIATED_SIGNALING_PATHWAY.v2025.1.Hs.tsv
    Untracked:  data/cellxgene_cell_ontologies_ann_level_3.xlsx
    Untracked:  data/gencode.v44.primary_assembly.annotation.gtf

Unstaged changes:
    Modified:   .DS_Store
    Modified:   analysis/13.0_DGE_analysis_macrophages.Rmd
    Modified:   analysis/13.1_DGE_analysis_macro-alveolar.Rmd
    Modified:   analysis/13.2_DGE_analysis_macro-APOC2+.Rmd
    Modified:   analysis/13.3_DGE_analysis_macro-CCL.Rmd
    Modified:   analysis/13.4_DGE_analysis_macro-IFI27.Rmd
    Modified:   analysis/13.5_DGE_analysis_macro-lipid.Rmd
    Modified:   analysis/13.6_DGE_analysis_macro-monocyte-derived.Rmd
    Modified:   analysis/13.7_DGE_analysis_macro-proliferating.Rmd
    Modified:   analysis/14.0_DGE_analysis_CD4-T-cells.Rmd
    Modified:   analysis/14.1_DGE_analysis_CD8-T-cells.Rmd
    Modified:   analysis/14.2_DGE_analysis_DC-cells.Rmd
    Modified:   analysis/15.0_proportions_analysis_ann_level_1.Rmd
    Modified:   analysis/15.1_proportions_analysis_ann_level_3_non-macrophages.Rmd
    Modified:   analysis/15.2_proportions_analysis_ann_level_3_macrophages.Rmd
    Modified:   output/dge_analysis/macrophages/CAM.FIBROSIS.CF.IVAvCF.NO_MOD.csv
    Modified:   output/dge_analysis/macrophages/CAM.FIBROSIS.CF.IVAvNON_CF.CTRL.csv
    Modified:   output/dge_analysis/macrophages/CAM.FIBROSIS.CF.LUMA_IVAvCF.NO_MOD.csv
    Modified:   output/dge_analysis/macrophages/CAM.FIBROSIS.CF.NO_MOD.SvCF.NO_MOD.M.csv
    Modified:   output/dge_analysis/macrophages/CAM.FIBROSIS.CF.NO_MODvNON_CF.CTRL.csv
    Modified:   output/dge_analysis/macrophages/CAM.GO.CF.IVAvCF.NO_MOD.csv
    Modified:   output/dge_analysis/macrophages/CAM.GO.CF.IVAvNON_CF.CTRL.csv
    Modified:   output/dge_analysis/macrophages/CAM.GO.CF.LUMA_IVAvCF.NO_MOD.csv
    Modified:   output/dge_analysis/macrophages/CAM.GO.CF.NO_MOD.SvCF.NO_MOD.M.csv
    Modified:   output/dge_analysis/macrophages/CAM.GO.CF.NO_MODvNON_CF.CTRL.csv
    Modified:   output/dge_analysis/macrophages/CAM.HALLMARK.CF.IVAvCF.NO_MOD.csv
    Modified:   output/dge_analysis/macrophages/CAM.HALLMARK.CF.IVAvNON_CF.CTRL.csv
    Modified:   output/dge_analysis/macrophages/CAM.HALLMARK.CF.LUMA_IVAvCF.NO_MOD.csv
    Modified:   output/dge_analysis/macrophages/CAM.HALLMARK.CF.NO_MOD.SvCF.NO_MOD.M.csv
    Modified:   output/dge_analysis/macrophages/CAM.HALLMARK.CF.NO_MODvNON_CF.CTRL.csv
    Modified:   output/dge_analysis/macrophages/CAM.REACTOME.CF.IVAvCF.NO_MOD.csv
    Modified:   output/dge_analysis/macrophages/CAM.REACTOME.CF.IVAvNON_CF.CTRL.csv
    Modified:   output/dge_analysis/macrophages/CAM.REACTOME.CF.LUMA_IVAvCF.NO_MOD.csv
    Modified:   output/dge_analysis/macrophages/CAM.REACTOME.CF.NO_MOD.SvCF.NO_MOD.M.csv
    Modified:   output/dge_analysis/macrophages/CAM.REACTOME.CF.NO_MODvNON_CF.CTRL.csv
    Modified:   output/dge_analysis/macrophages/CAM.WP.CF.IVAvCF.NO_MOD.csv
    Modified:   output/dge_analysis/macrophages/CAM.WP.CF.IVAvNON_CF.CTRL.csv
    Modified:   output/dge_analysis/macrophages/CAM.WP.CF.LUMA_IVAvCF.NO_MOD.csv
    Modified:   output/dge_analysis/macrophages/CAM.WP.CF.NO_MOD.SvCF.NO_MOD.M.csv
    Modified:   output/dge_analysis/macrophages/CAM.WP.CF.NO_MODvNON_CF.CTRL.csv
    Modified:   output/dge_analysis/macrophages/CF.IVAvCF.NO_MOD.csv
    Modified:   output/dge_analysis/macrophages/CF.IVAvNON_CF.CTRL.csv
    Modified:   output/dge_analysis/macrophages/CF.LUMA_IVAvCF.NO_MOD.csv
    Modified:   output/dge_analysis/macrophages/CF.NO_MOD.SvCF.NO_MOD.M.csv
    Modified:   output/dge_analysis/macrophages/CF.NO_MODvNON_CF.CTRL.csv
    Modified:   output/dge_analysis/macrophages/ORA.GO.CF.IVAvNON_CF.CTRL.csv
    Modified:   output/dge_analysis/macrophages/ORA.GO.CF.NO_MOD.SvCF.NO_MOD.M.csv
    Modified:   output/dge_analysis/macrophages/ORA.GO.CF.NO_MODvNON_CF.CTRL.csv
    Modified:   output/dge_analysis/macrophages/ORA.HALLMARK.CF.IVAvCF.NO_MOD.csv
    Modified:   output/dge_analysis/macrophages/ORA.REACTOME.CF.NO_MODvNON_CF.CTRL.csv
    Modified:   output/pdf_figures/Figure_1.pdf
Note that any generated files, e.g. HTML, png, CSS, etc., are not included in this status report because it is ok for generated content to have uncommitted changes.
These are the previous versions of the repository in which changes were
made to the R Markdown (analysis/16.1_Figure_2.Rmd) and
HTML (docs/16.1_Figure_2.html) files. If you’ve configured
a remote Git repository (see ?wflow_git_remote), click on
the hyperlinks in the table below to view the files as they were in that
past version.
| File | Version | Author | Date | Message |
|---|---|---|---|---|
| Rmd | 5879432 | Jovana Maksimovic | 2026-04-01 | wflow_publish(c("analysis/16.0_Figure_1.Rmd", "analysis/16.1_Figure_2.Rmd", |
| html | 95d5f30 | Jovana Maksimovic | 2025-09-10 | Build site. |
| Rmd | aa65179 | Jovana Maksimovic | 2025-09-10 | wflow_publish("analysis/16.1_Figure_2.Rmd") |
| html | c370eea | Jovana Maksimovic | 2025-02-20 | Build site. |
| Rmd | a72c6b4 | Jovana Maksimovic | 2025-02-20 | wflow_publish("analysis/16.1_Figure_2.Rmd") |
Load libraries.
suppressPackageStartupMessages({
 library(SingleCellExperiment)
 library(edgeR)
 library(tidyverse)
 library(ggplot2)
 library(Seurat)
 library(glmGamPoi)
 library(dittoSeq)
 library(here)
 library(clustree)
 library(patchwork)
 library(AnnotationDbi)
 library(org.Hs.eg.db)
 library(glue)
 library(speckle)
 library(tidyHeatmap)
 library(paletteer)
 library(dsb)
 library(ggh4x)
  library(readxl)
})

source(here("code/utility.R"))
Load data
files <- list.files(here("data/C133_Neeland_merged"),
                    pattern = "C133_Neeland_full_clean.*(macrophages|t_cells|other_cells)_annotated_full.SEU.rds",
                    full.names = TRUE)

seuLst <- lapply(files, function(f) readRDS(f))
seuLst
[[1]]
An object of class Seurat
41892 features across 13687 samples within 5 assays
Active assay: RNA (19973 features, 0 variable features)
4 other assays present: ADT, SCT, integrated, ADT.dsb
2 dimensional reductions calculated: pca, umap
[[2]]
An object of class Seurat
38775 features across 15511 samples within 5 assays
Active assay: RNA (19973 features, 0 variable features)
4 other assays present: ADT, SCT, integrated, ADT.dsb
2 dimensional reductions calculated: pca, umap
[[3]]
An object of class Seurat
46108 features across 165209 samples within 5 assays
Active assay: RNA (21568 features, 0 variable features)
4 other assays present: ADT, SCT, integrated, ADT.dsb
2 dimensional reductions calculated: pca, umapMacrophage cells figure panels
lab_map <- c(
  "macro-alveolar"          = "AM",
  "macro-IGF1"              = "AM.IGF1",
  "macro-CCL"               = "AM.CCL",
  "macro-lipid"             = "AM.Lipid",
  "macro-MT"                = "AM.MT",
  "macro-IFN"               = "AM.IFN",
  "macro-APOC2+"            = "AM.APOC2",
  "macro-CCL18"             = "AM.CCL18",
  "macro-IFI27"             = "AM.IFI27",
  "macro-monocyte-derived"  = "Mac.Mono.Deriv",
  "macro-interstitial"      = "Mac.Interstitial",
  "macro-lipid-APOC2+"      = "AM.Lipid.APOC2",
  "macro-T"                 = "Mac.T",
  "macro-IFI27+CCL18+"      = "AM.IFI27.CCL18",
  "macro-IFI27+APOC2+"      = "AM.IFI27.APOC2",
  "macro-proliferating"     = "Mac.Prolif"    # ← collapse proliferating
)
Map long cell type labels to short labels.
seuLst[[3]]$ann_level_3 <- ifelse(str_detect(seuLst[[3]]$ann_level_3, "proliferating"),
                                  "macro-proliferating",
                                  seuLst[[3]]$ann_level_3)
# map long labels to short labels
seuLst[[3]]$short_labels <- lab_map[seuLst[[3]]$ann_level_3]
# match ordering of the levels betwen long and short labels
lut <- unique(seuLst[[3]]@meta.data[, c("ann_level_3", "short_labels")])
lut <- lut[match(levels(factor(seuLst[[3]]$ann_level_3)), lut$ann_level_3), , drop = FALSE]
# update level ordering for short labels
seuLst[[3]]$short_labels <- factor(seuLst[[3]]$short_labels,
                                   levels = unique(lut$short_labels))
options(ggrepel.max.overlaps = Inf)
cluster_pal <- "ggsci::category20_d3"
draw_umap_with_labels(seuLst[[3]],
ann_level = "short_labels",
cluster_pal) -> f2a
f2a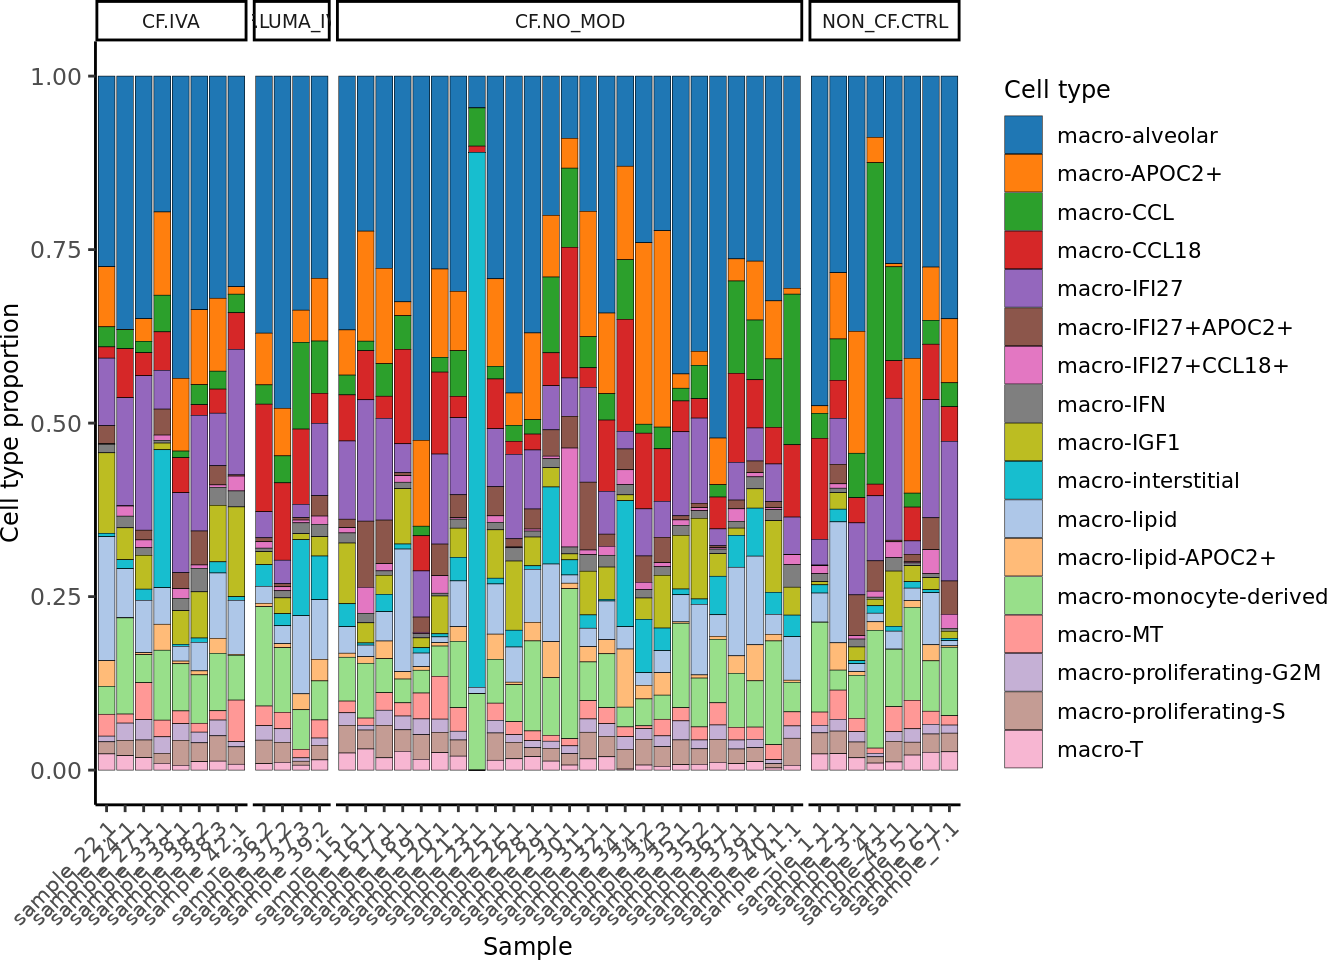
#markers <- readRDS(here("data/cluster_annotations/seurat_markers_macrophages.rds"))
#
# draw_marker_gene_dotplot(seuLst[[3]],
#                          markers,
#                          "ann_level_3",
#                          cluster_pal)

labels <- read_excel(here("data",
                          "cluster_annotations",
                          "marker_genes_macrophages_figure_2.xlsx"))
                          #"macrophages_26.06.24.xlsx"))

unnest(enframe(setNames(str_split(labels$`non-overlapping marker genes`, ", "),
                        labels$`cell label`),
               value = "gene",
               name = "cluster"),
       cols = gene) %>%
  arrange(cluster) %>%
  distinct() -> markers

markers <- markers[markers$gene %in% rownames(seuLst[[3]]),]

draw_marker_gene_dotplot(seuLst[[3]],
                         markers,
                         ann_level = "ann_level_3",
                         cluster_pal,
                         lab_map = lab_map,
                         direction = 1,
                         num = 5,
                         strip.text.blank = TRUE,
                         strip.alpha = 1,
                         dot.scale = 3) -> f2b

f2b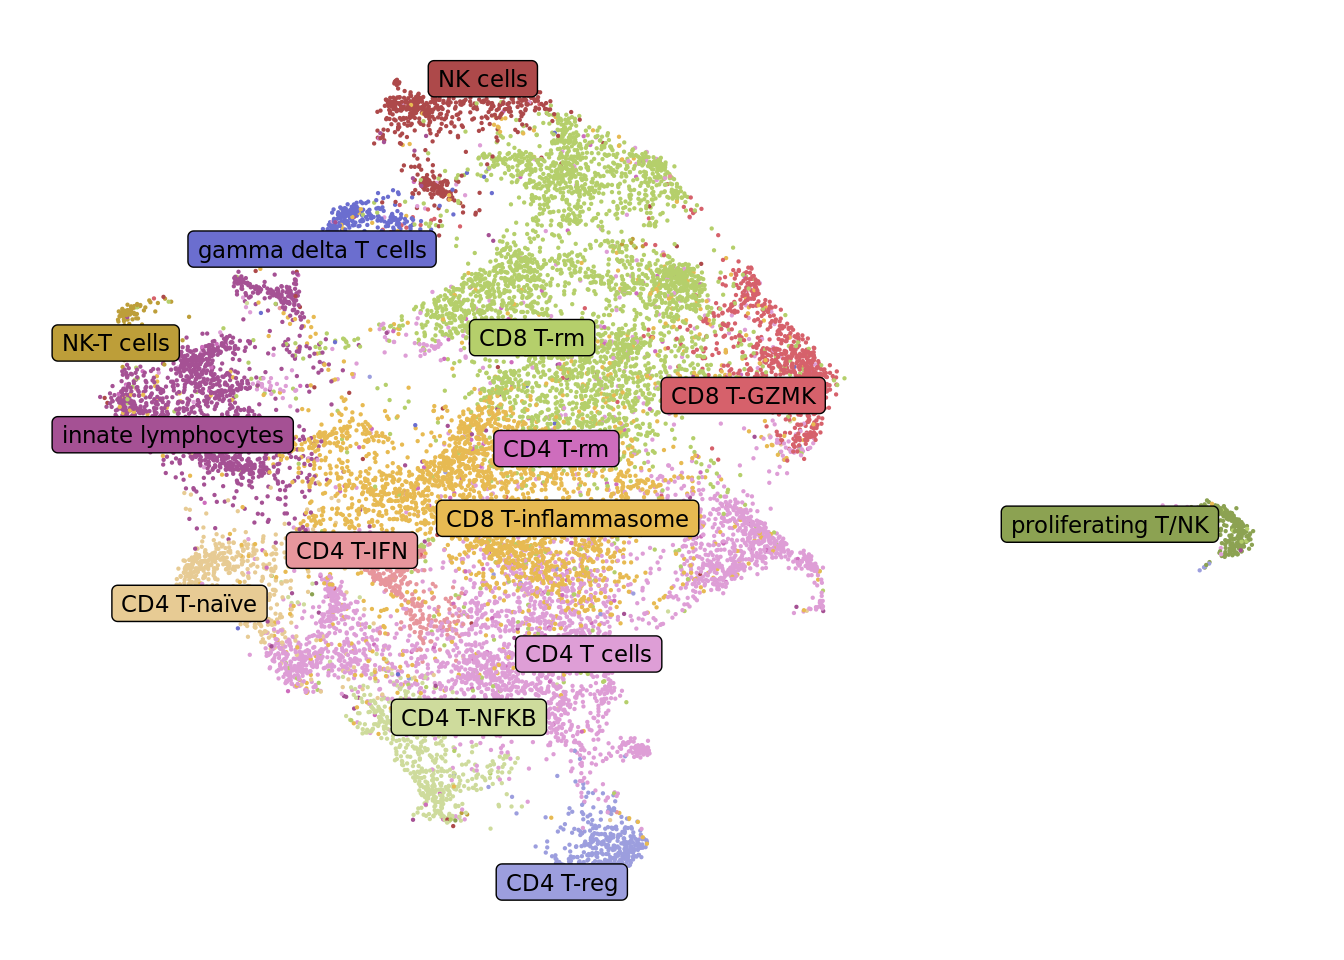
samp_map <-
c(
  "CF.IVA" = "CF (iva)",
  "CF.LUMA_IVA" = "CF (luma/iva)",
  "CF.NO_MOD" = "CF (no mod)",
  "NON_CF.CTRL" = "Non-CF control"
)

seuLst[[3]]$Group <- samp_map[seuLst[[3]]$Group]

# Map colours to groups
strip_colours <- c(
  "CF (iva)" = "#66C2A5",
  "CF (luma/iva)" = "#FC8D62",
  "CF (no mod)" = "#8DA0CB",
  "Non-CF control" = "#E78AC3"
)
draw_cell_type_proportions_barplot(seuLst[[3]],
ann_level = "short_labels",
cluster_pal,
strip_colours = strip_colours) -> f2c
f2c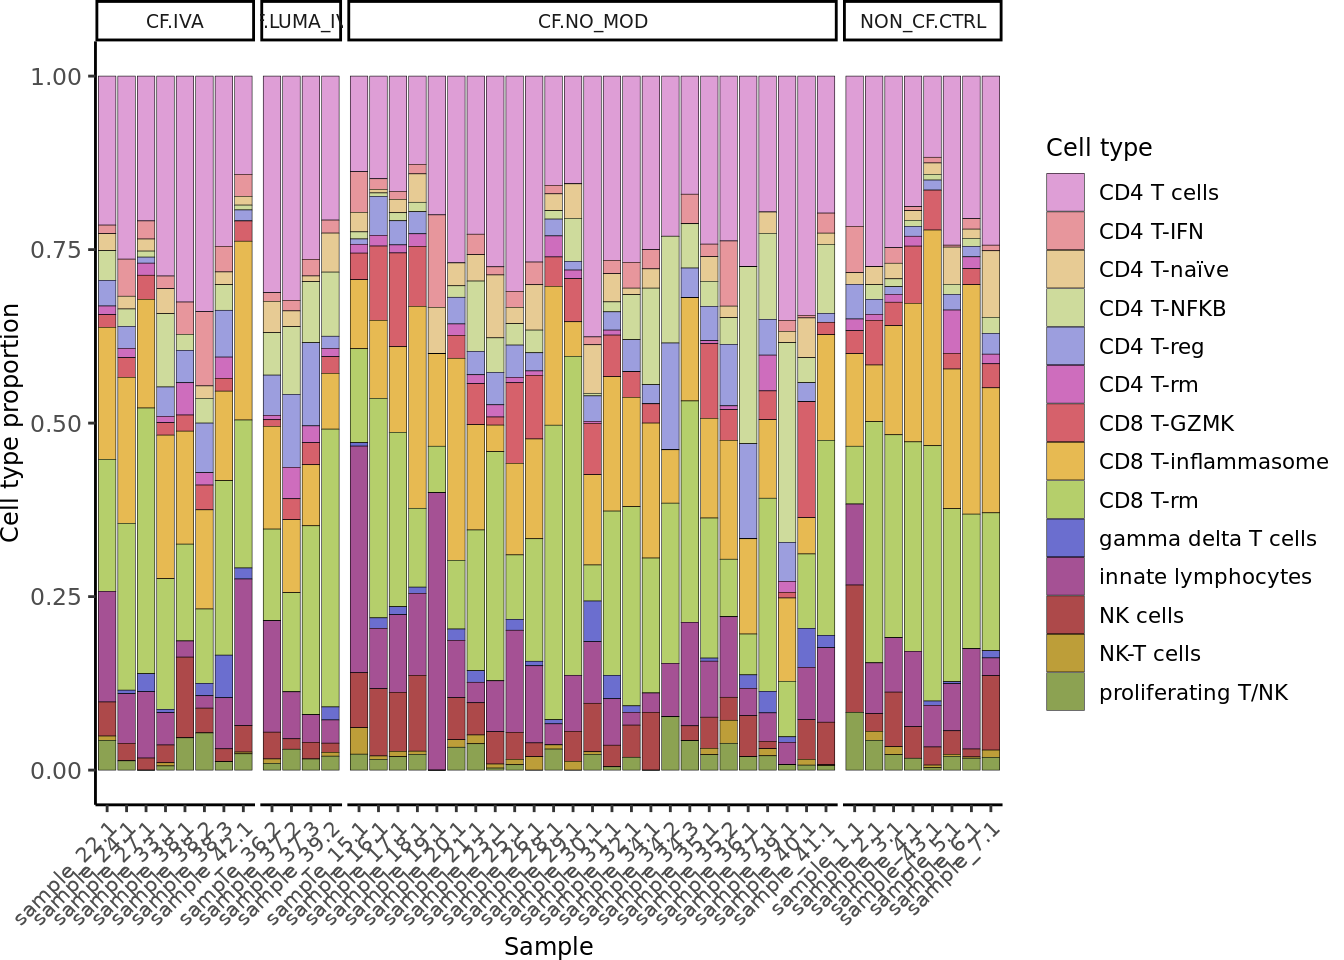
T/NK cells figure panels
lab_map <- c(
  "CD4 T cells"         = "CD4 T",
  "CD4 T-IFN"           = "CD4 T-IFN",
  "CD4 T-naïve"         = "CD4 T-naïve",   # use "CD4 naive" if you want ASCII
  "CD4 T-NFKB"          = "CD4 T-NFκB",    # use "CD4 NFKB" for ASCII
  "CD4 T-reg"           = "CD4 T-reg",
  "CD4 T-rm"            = "CD4 T-rm",
  "CD8 T-GZMK"          = "CD8 T-GZMK",
  "CD8 T-inflammasome"  = "CD8 T-inflam",
  "CD8 T-rm"            = "CD8 T-rm",
  "gamma delta T cells" = "γδ T",        # or "gd T"
  "innate lymphocytes"  = "ILC",
  "NK cells"            = "NK",
  "NK-T cells"          = "NKT",
  "proliferating T/NK"  = "Prolif T/NK"
)
Map long cell type labels to short labels.
# map long labels to short labels
seuLst[[2]]$short_labels <- lab_map[seuLst[[2]]$ann_level_3]
# match ordering of the levels betwen long and short labels
lut <- unique(seuLst[[2]]@meta.data[, c("ann_level_3", "short_labels")])
lut <- lut[match(levels(factor(seuLst[[2]]$ann_level_3)), lut$ann_level_3), , drop = FALSE]
# update level ordering for short labels
seuLst[[2]]$short_labels <- factor(seuLst[[2]]$short_labels,
                                   levels = unique(lut$short_labels))
cluster_pal <- "ggsci::category20b_d3"
draw_umap_with_labels(seuLst[[2]],
"short_labels",
cluster_pal,
direction = -1) -> f2d
f2d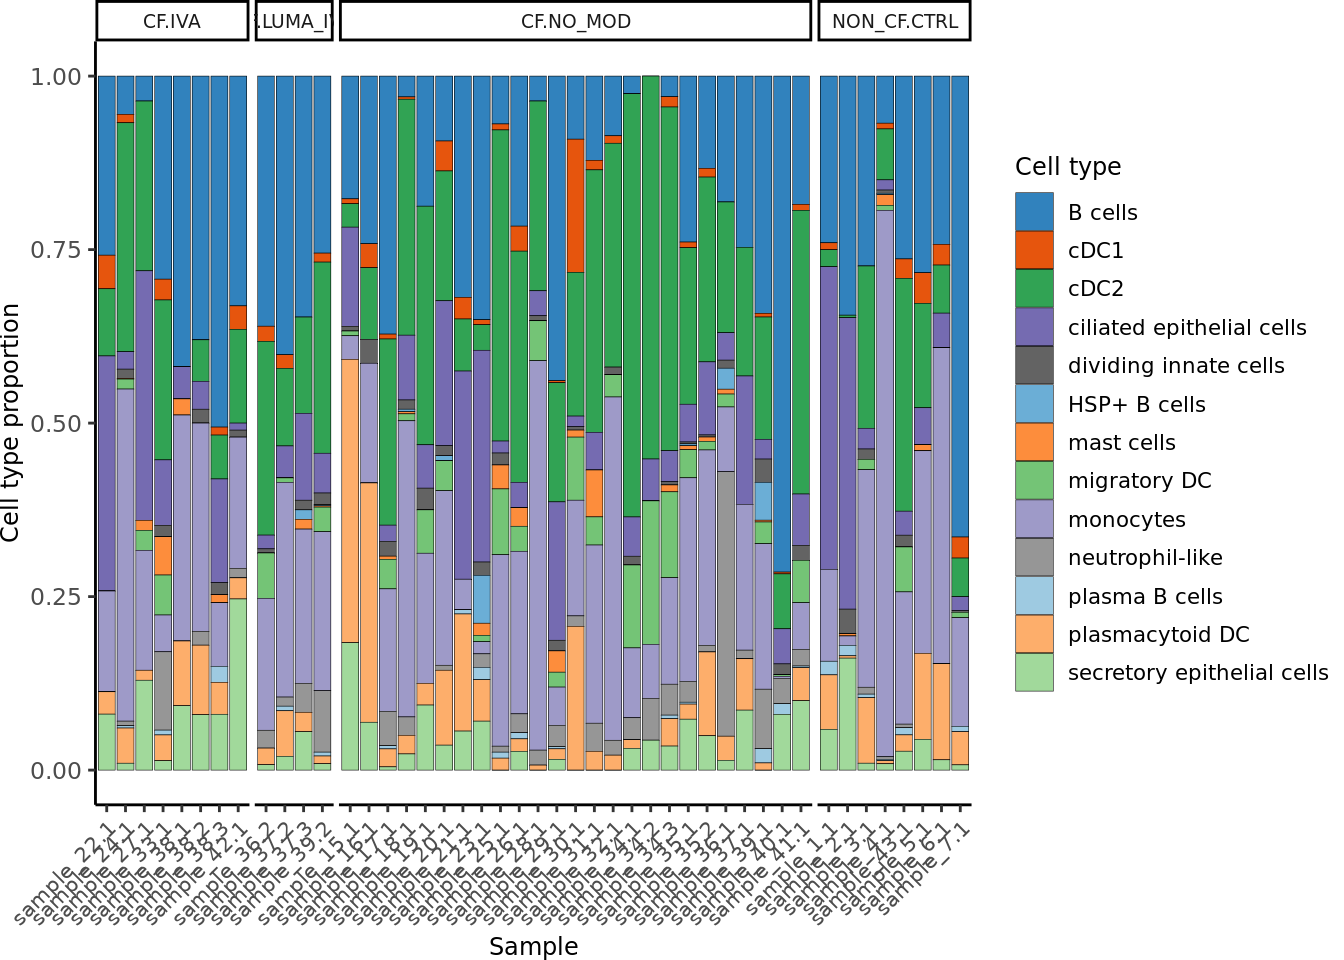
# markers <- readRDS(here("data/cluster_annotations/seurat_markers_TNK_cells.rds"))
#
# draw_marker_gene_dotplot(seuLst[[2]],
#                          markers,
#                          "ann_level_3",
#                          cluster_pal,
#                          direction = -1)
labels <- read_excel(here("data",
                          "cluster_annotations",
                          #"T-NK_ambientRNAremoval_21.03.24.xlsx"),
                          "marker_genes_TNK_figure_2.xlsx"))
                     #skip = 1)

unnest(enframe(setNames(str_split(labels$`non-overlapping marker genes`, ", "),
                        labels$`cell label`),
               value = "gene",
               name = "cluster"),
       cols = gene) %>%
  arrange(cluster) %>%
  distinct() %>%
  dplyr::filter(gene != "MALAT1") -> markers

markers <- markers[markers$gene %in% rownames(seuLst[[2]]),]

draw_marker_gene_dotplot(seuLst[[2]],
                         markers,
                         ann_level = "ann_level_3",
                         cluster_pal,
                         lab_map = lab_map,
                         direction = 1,
                         num = 5,
                         strip.text.blank = TRUE,
                         strip.alpha = 1,
                         dot.scale = 5) -> f2e

f2e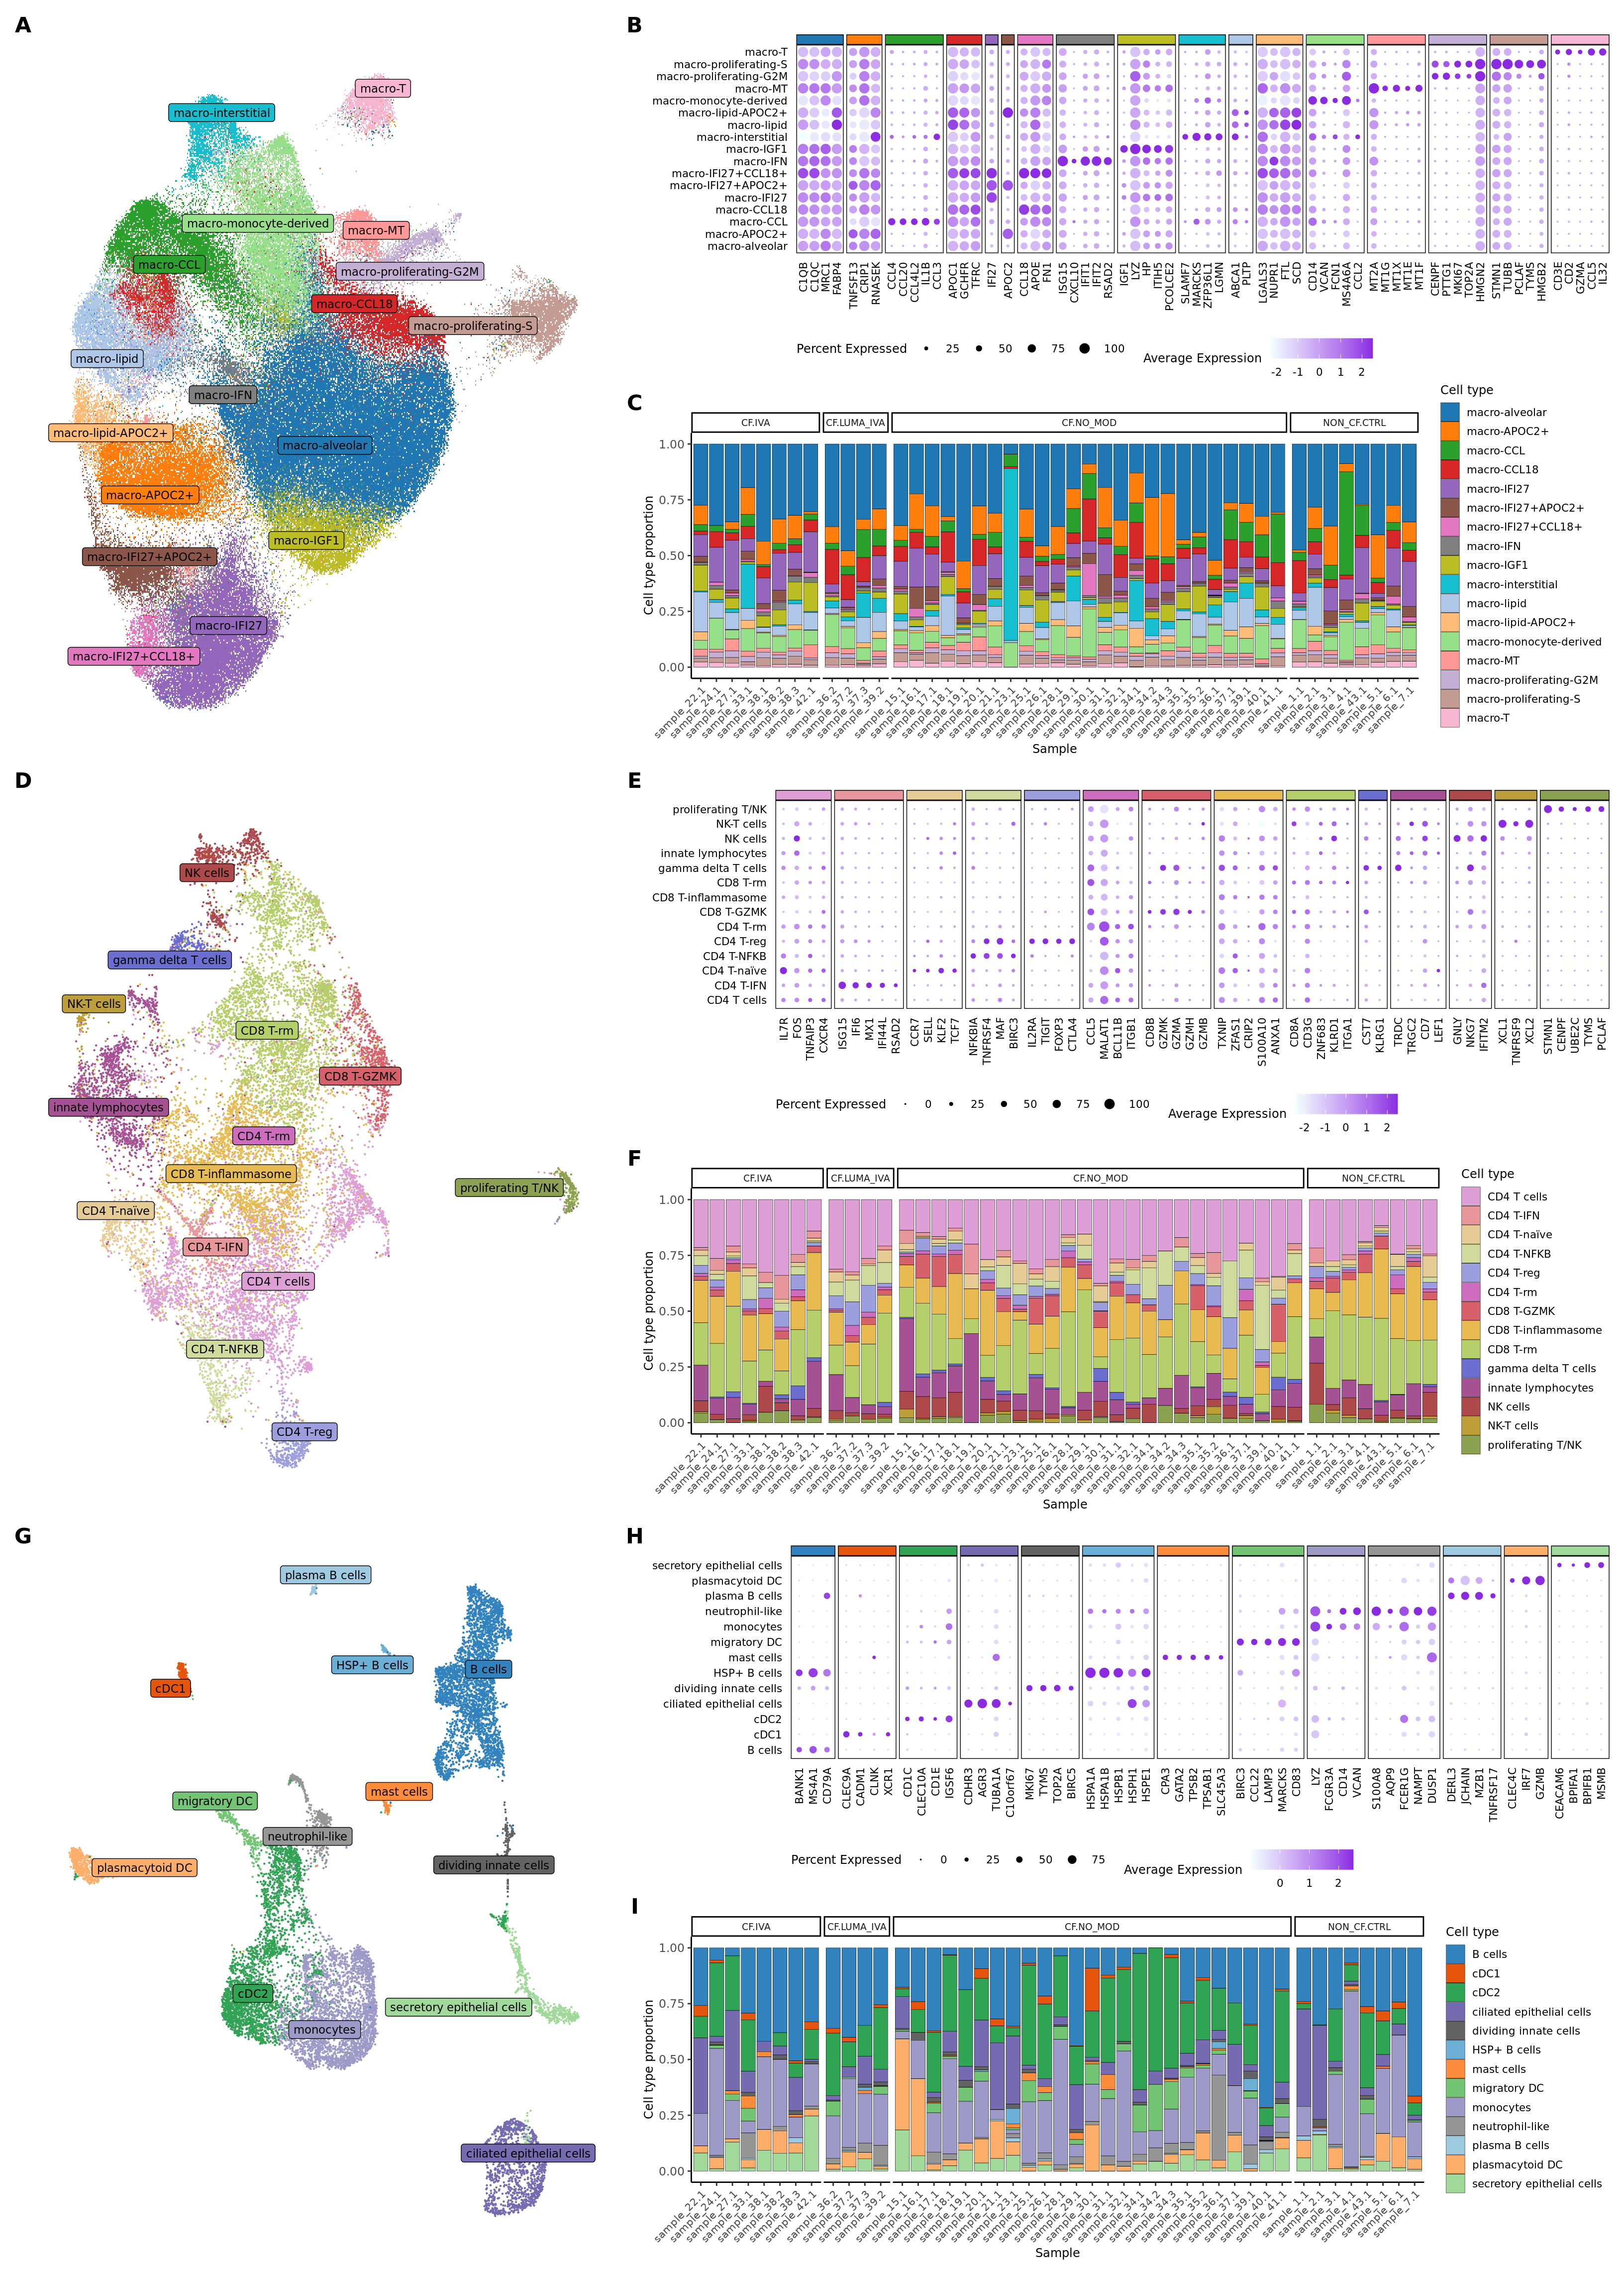
seuLst[[2]]$Group <- samp_map[seuLst[[2]]$Group]

draw_cell_type_proportions_barplot(seuLst[[2]],
                                   ann_level = "short_labels",
                                   cluster_pal,
                                   strip_colours = strip_colours,
                                   direction = -1) -> f2f

f2f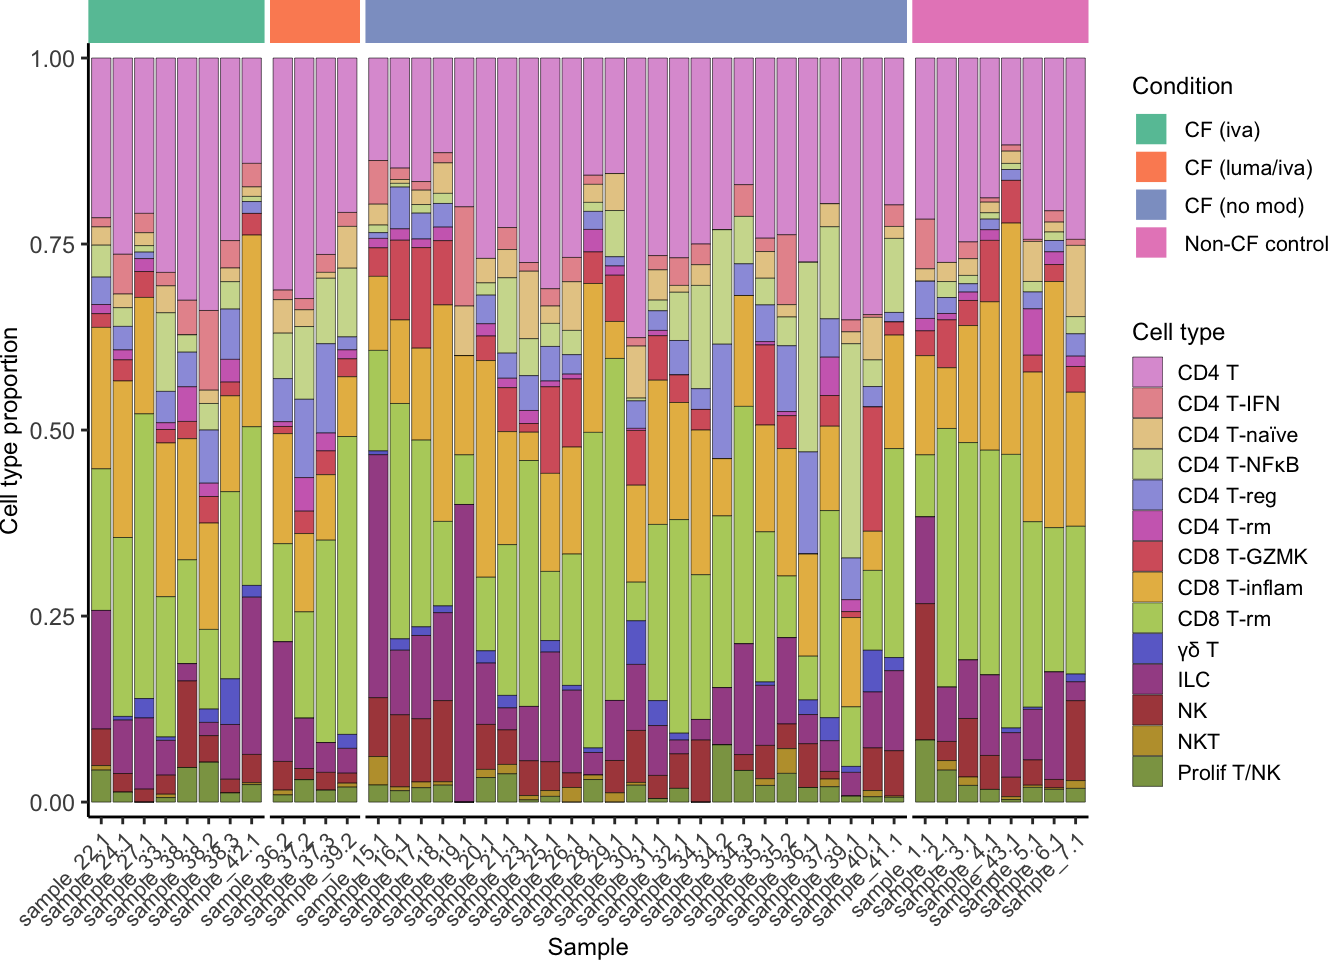
| Version | Author | Date |
|---|---|---|
| 95d5f30 | Jovana Maksimovic | 2025-09-10 |
Rare cells figure panels
lab_map <- c(
  "B cells"                   = "B",
  "cDC1"                      = "cDC1",
  "cDC2"                      = "cDC2",
  "ciliated epithelial cells" = "Ciliated epi",
  "dividing innate cells"     = "Div innate",
  "HSP+ B cells"              = "HSP+ B",
  "mast cells"                = "Mast",
  "migratory DC"              = "Mig DC",
  "monocytes"                 = "Mono",
  "neutrophil-like"           = "Neut-like",
  "plasma B cells"            = "Plasma B",
  "plasmacytoid DC"           = "pDC",
  "secretory epithelial cells"= "Secretory epi"
)
Map long cell type labels to short labels.
# map long labels to short labels
seuLst[[1]]$short_labels <- lab_map[seuLst[[1]]$ann_level_3]
# match ordering of the levels betwen long and short labels
lut <- unique(seuLst[[1]]@meta.data[, c("ann_level_3", "short_labels")])
lut <- lut[match(levels(factor(seuLst[[1]]$ann_level_3)), lut$ann_level_3), , drop = FALSE]
# update level ordering for short labels
seuLst[[1]]$short_labels <- factor(seuLst[[1]]$short_labels,
                                   levels = unique(lut$short_labels))
cluster_pal <- "ggsci::category20c_d3"
draw_umap_with_labels(seuLst[[1]],
"short_labels",
cluster_pal) -> f2g
f2g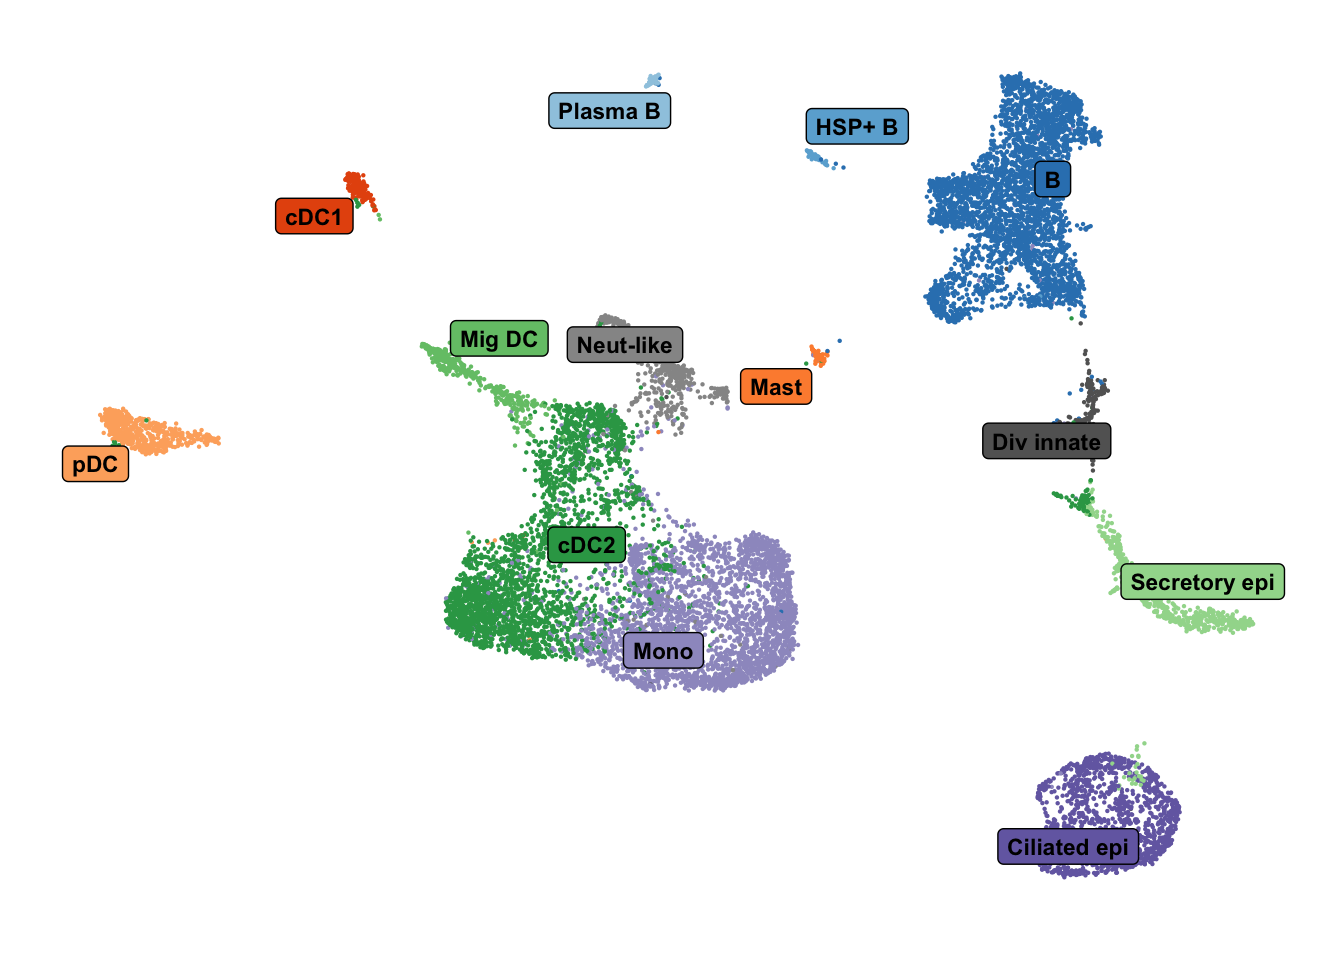
| Version | Author | Date |
|---|---|---|
| 95d5f30 | Jovana Maksimovic | 2025-09-10 |
# markers <- readRDS(here("data/cluster_annotations/seurat_markers_other_cells.rds"))
#
# draw_marker_gene_dotplot(seuLst[[1]],
#                          markers,
#                          "ann_level_3",
#                          cluster_pal)

labels <- read_excel(here("data",
                          "cluster_annotations",
                          #"others_ambientRNAremoval_21.03.24.xlsx"),
                          "marker_genes_other_figure_2.xlsx"))
                     #skip = 1)

unnest(enframe(setNames(str_split(labels$`non-overlapping marker genes`, ", "),
                        labels$`cell label`),
               value = "gene",
               name = "cluster"),
       cols = gene) %>%
  arrange(cluster) %>%
  distinct() -> markers

markers <- markers[markers$gene %in% rownames(seuLst[[1]]),]

draw_marker_gene_dotplot(seuLst[[1]],
                         markers,
                         ann_level = "ann_level_3",
                         cluster_pal,
                         lab_map = lab_map,
                         direction = 1,
                         num = 5,
                         strip.text.blank = TRUE,
                         strip.alpha = 1,
                         dot.scale = 4) -> f2h

f2h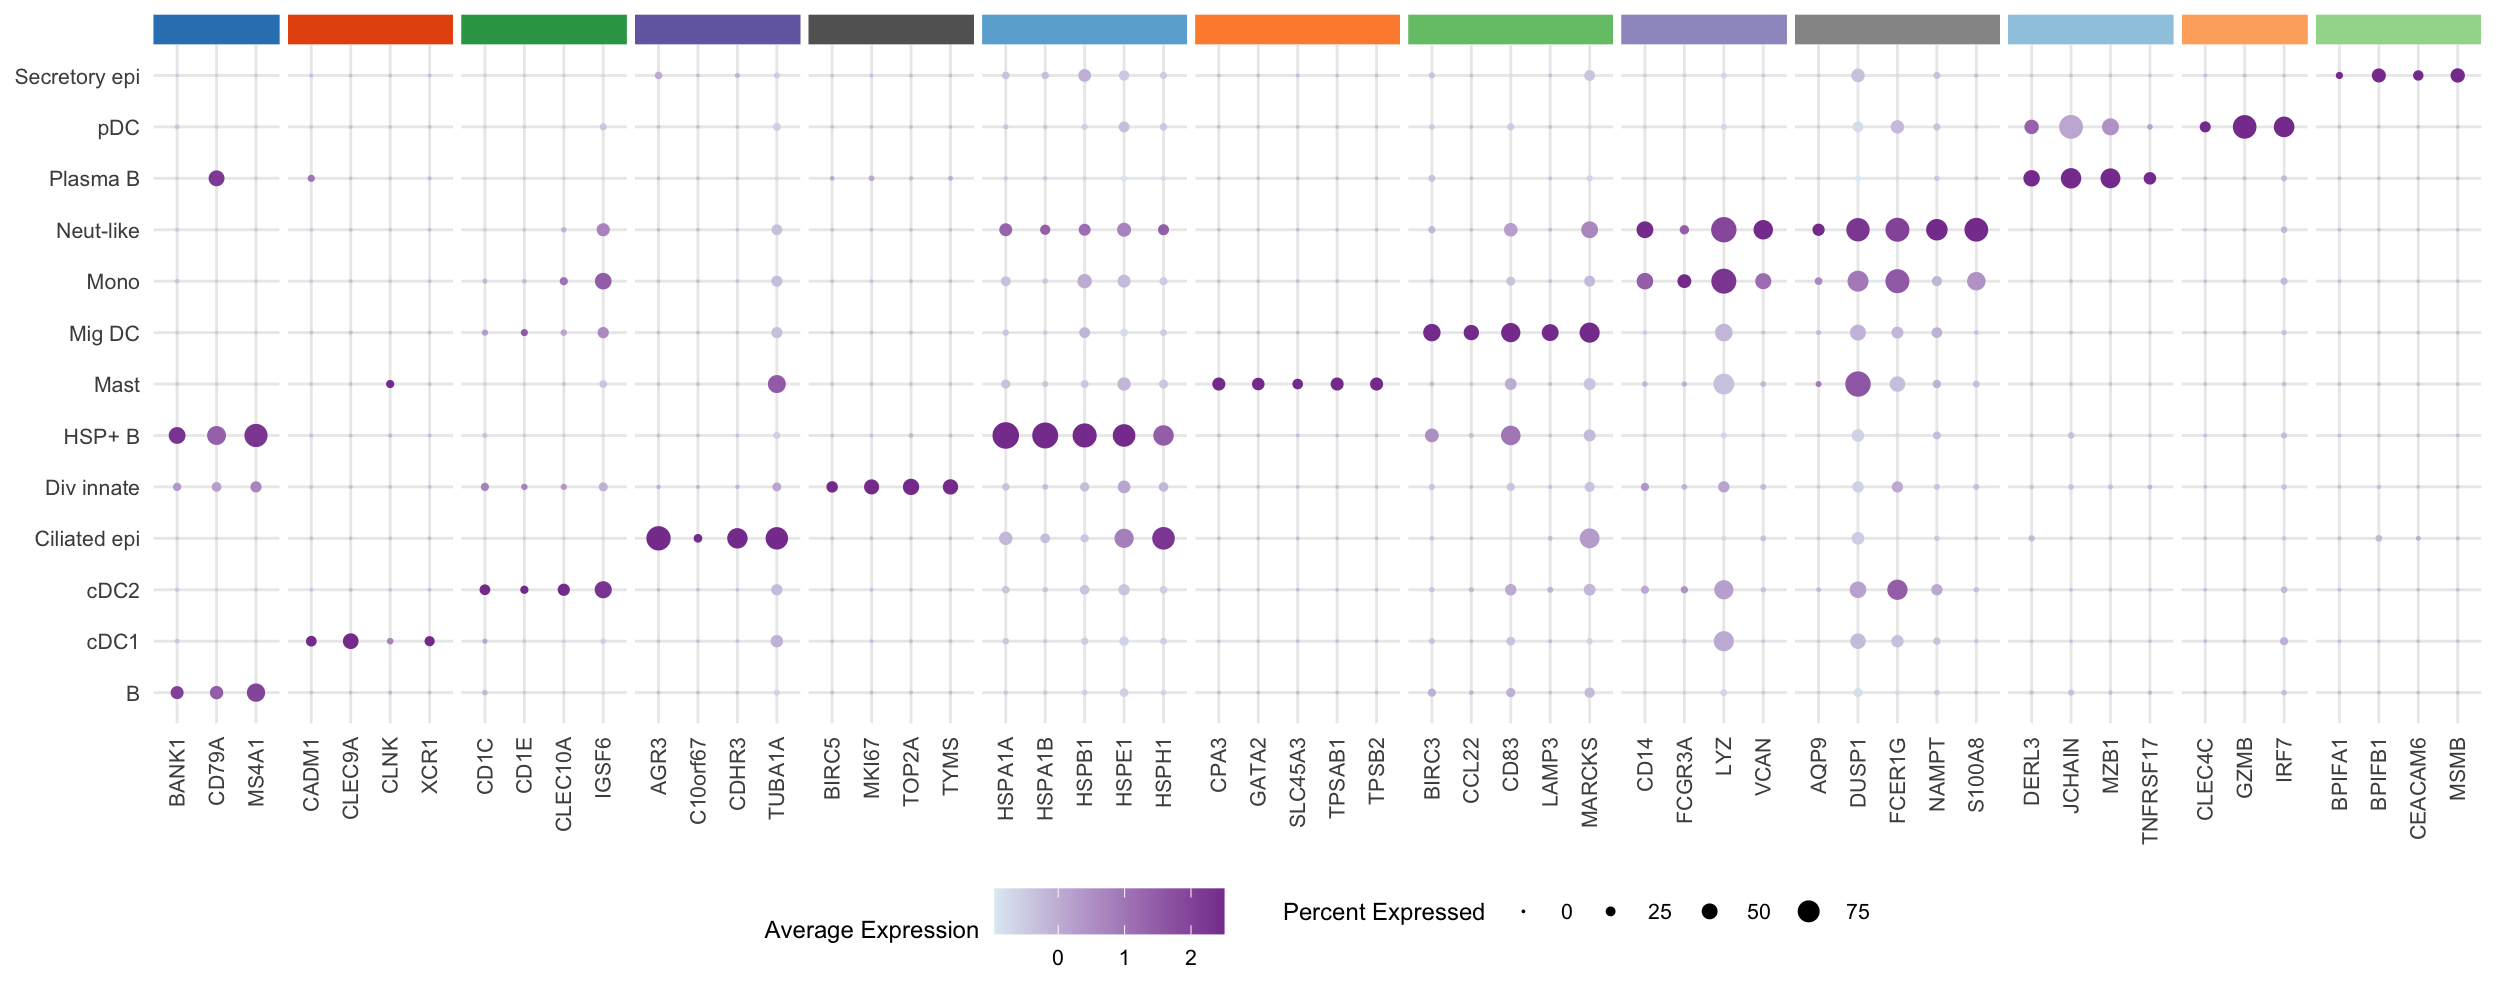
| Version | Author | Date |
|---|---|---|
| 95d5f30 | Jovana Maksimovic | 2025-09-10 |
seuLst[[1]]$Group <- samp_map[seuLst[[1]]$Group]

draw_cell_type_proportions_barplot(seuLst[[1]],
                                   ann_level = "short_labels",
                                   cluster_pal,
                                   strip_colours = strip_colours) -> f2i

f2i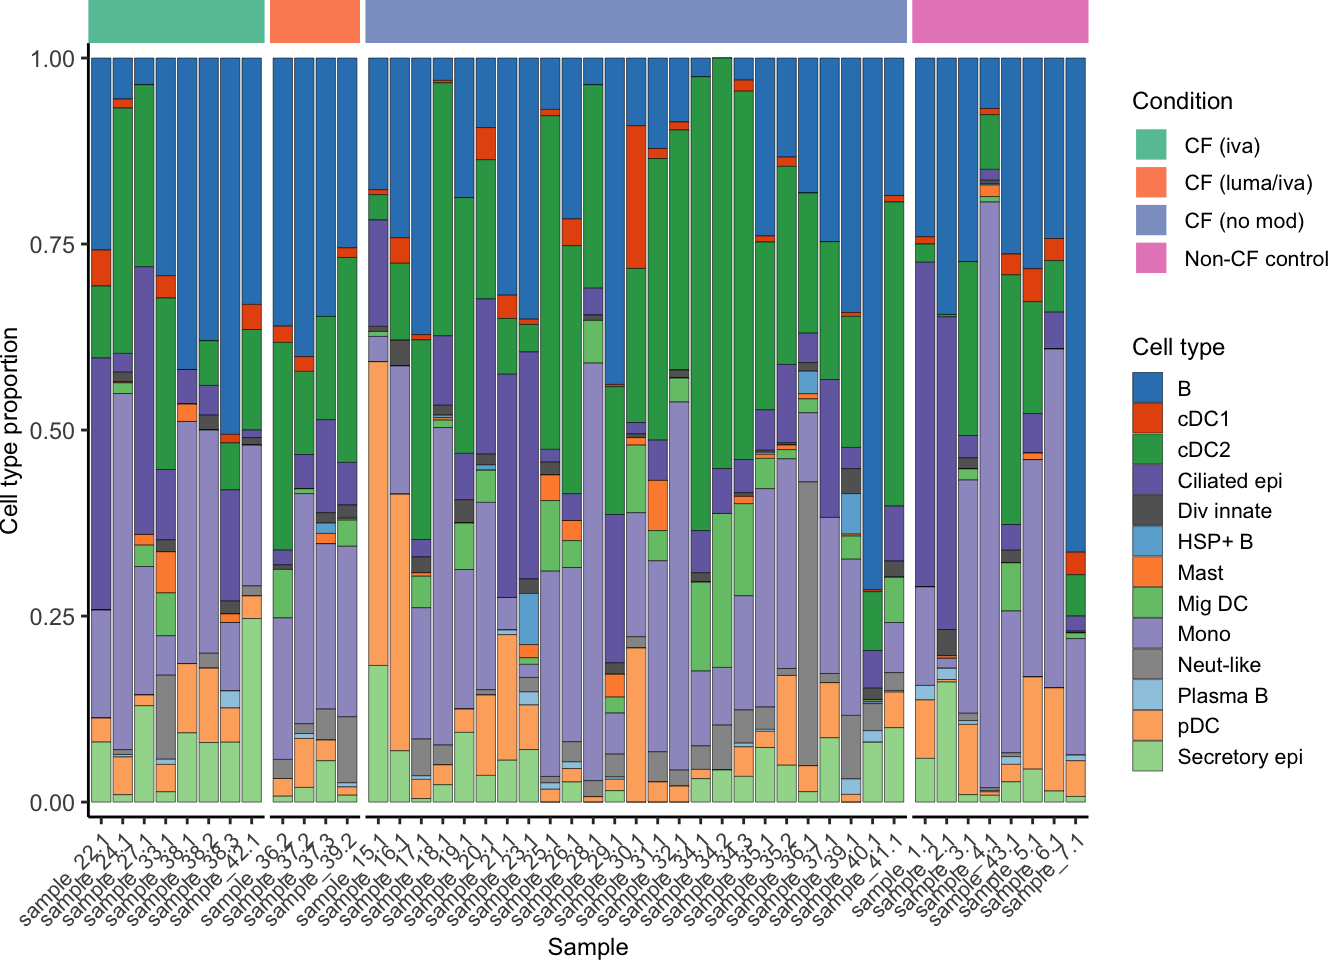
| Version | Author | Date |
|---|---|---|
| 95d5f30 | Jovana Maksimovic | 2025-09-10 |
Figure 2
layout = "
AAABBBBB
AAACCCCC
DDDEEEEE
DDDFFFFF
GGGHHHHH
GGGIIIII
"
(wrap_elements(f2a + theme(plot.margin = unit(rep(0,4), "cm"))) +
    wrap_elements(f2b + theme(plot.margin = unit(rep(0,4), "cm"),
                              legend.justification = "left")) +
    wrap_elements(f2c + theme(plot.margin = unit(rep(0,4), "cm"),
                              legend.spacing = unit(0.1, "lines"))) +
    wrap_elements(f2d + theme(plot.margin = unit(rep(0,4), "cm"))) +
    wrap_elements(f2e + theme(plot.margin = unit(rep(0,4), "cm"),
                              legend.justification = "left")) +
    wrap_elements(f2f + theme(plot.margin = unit(rep(0,4), "cm"),
                              legend.spacing = unit(0.1, "lines"))) +
    wrap_elements(f2g + theme(plot.margin = unit(rep(0,4), "cm"))) +
    wrap_elements(f2h + theme(plot.margin = unit(rep(0,4), "cm"),
                              legend.justification = "left")) +
    wrap_elements(f2i + theme(plot.margin = unit(rep(0,4), "cm"),
                              legend.spacing = unit(0.1, "lines")))) +
  plot_layout(design = layout) +
  plot_annotation(tag_levels = "A") &
  theme(plot.tag = element_text(size = 24,
                                face = "bold",
                                family = "arial")) -> p

p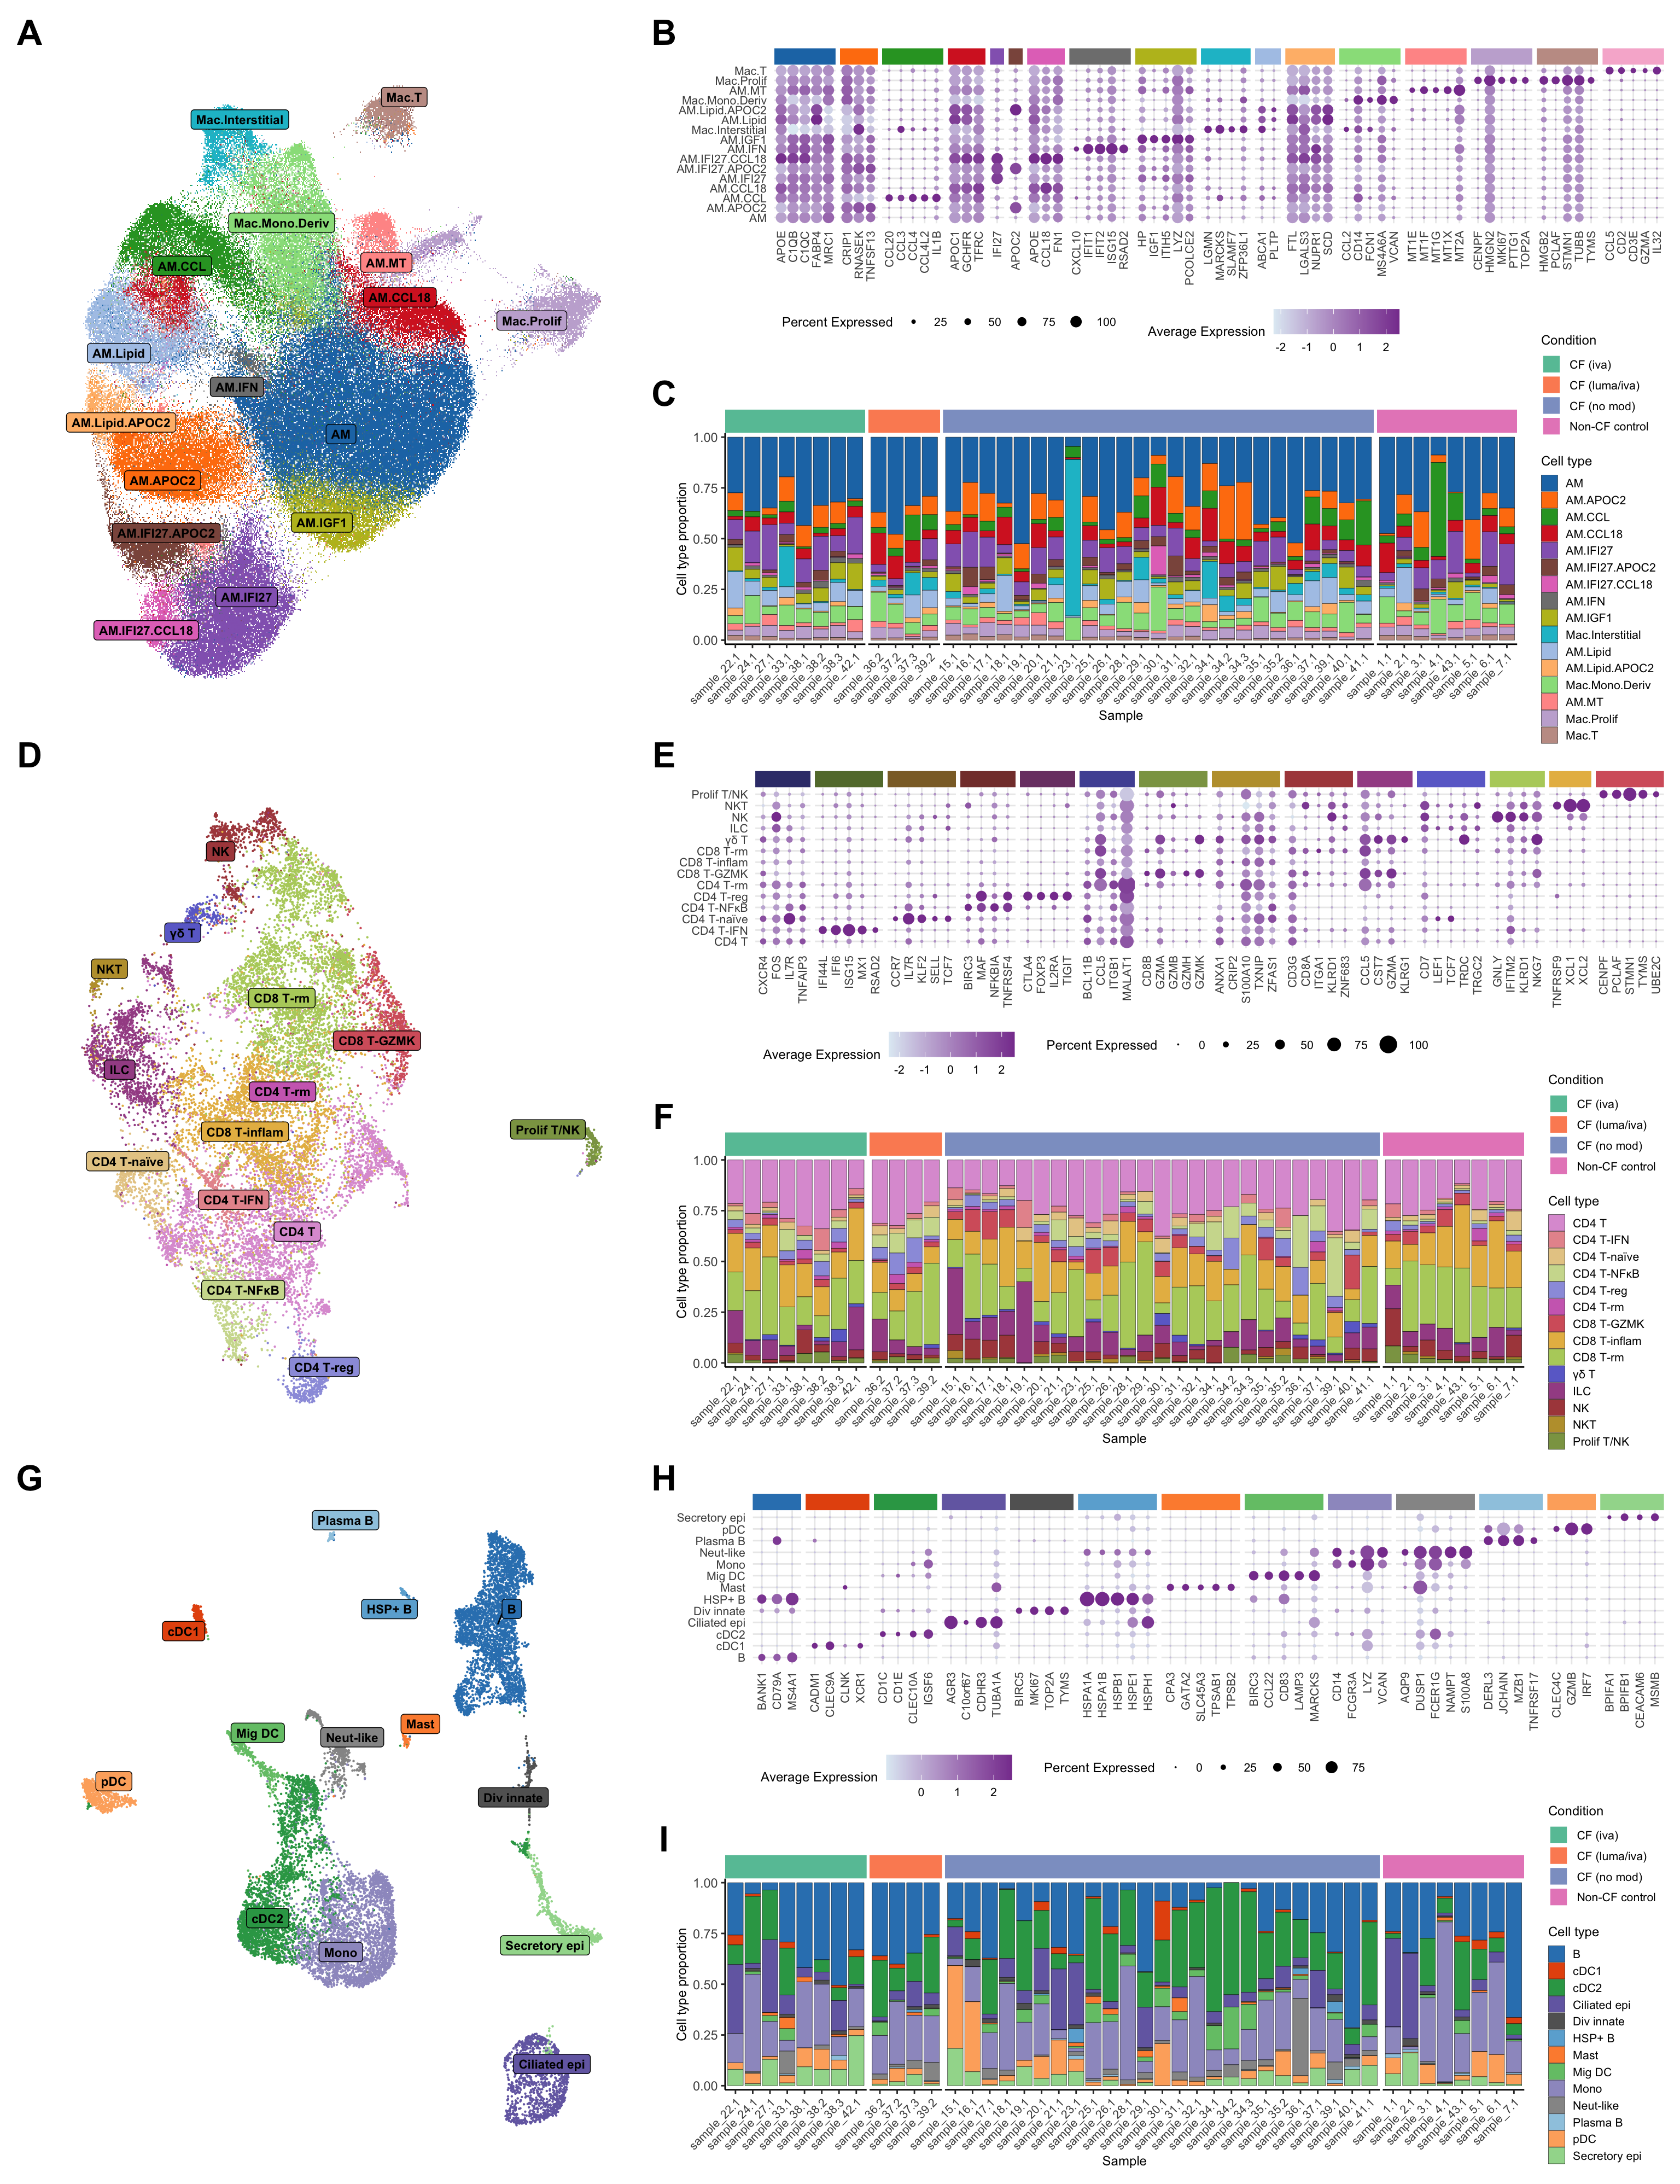
| Version | Author | Date |
|---|---|---|
| 95d5f30 | Jovana Maksimovic | 2025-09-10 |
ggsave(here("output/pdf_figures/Figure_2.pdf"),
       plot = p, width = 16, height = 22, units = "in", device = cairo_pdf)
Session info
sessionInfo()R version 4.3.3 (2024-02-29)
Platform: aarch64-apple-darwin20 (64-bit)
Running under: macOS 15.5
Matrix products: default
BLAS: /Library/Frameworks/R.framework/Versions/4.3-arm64/Resources/lib/libRblas.0.dylib
LAPACK: /Library/Frameworks/R.framework/Versions/4.3-arm64/Resources/lib/libRlapack.dylib; LAPACK version 3.11.0
locale:
[1] en_US.UTF-8/en_US.UTF-8/en_US.UTF-8/C/en_US.UTF-8/en_US.UTF-8
time zone: Australia/Melbourne
tzcode source: internal
attached base packages:
[1] stats4 stats graphics grDevices datasets utils methods
[8] base
other attached packages:
[1] readxl_1.4.3 ggh4x_0.3.1
[3] dsb_1.0.3 paletteer_1.6.0
[5] tidyHeatmap_1.8.1 speckle_1.2.0
[7] glue_1.8.0 org.Hs.eg.db_3.18.0
[9] AnnotationDbi_1.64.1 patchwork_1.3.1
[11] clustree_0.5.1 ggraph_2.2.0
[13] here_1.0.1 dittoSeq_1.14.2
[15] glmGamPoi_1.14.3 SeuratObject_4.1.4
[17] Seurat_4.4.0 lubridate_1.9.3
[19] forcats_1.0.0 stringr_1.5.1
[21] dplyr_1.1.4 purrr_1.0.2
[23] readr_2.1.5 tidyr_1.3.1
[25] tibble_3.2.1 ggplot2_3.5.2
[27] tidyverse_2.0.0 edgeR_4.0.15
[29] limma_3.58.1 SingleCellExperiment_1.24.0
[31] SummarizedExperiment_1.32.0 Biobase_2.62.0
[33] GenomicRanges_1.54.1 GenomeInfoDb_1.38.6
[35] IRanges_2.36.0 S4Vectors_0.40.2
[37] BiocGenerics_0.48.1 MatrixGenerics_1.14.0
[39] matrixStats_1.2.0 workflowr_1.7.1
loaded via a namespace (and not attached):
[1] fs_1.6.6 spatstat.sparse_3.0-3 bitops_1.0-7
[4] httr_1.4.7 RColorBrewer_1.1-3 doParallel_1.0.17
[7] tools_4.3.3 sctransform_0.4.1 utf8_1.2.4
[10] R6_2.5.1 lazyeval_0.2.2 uwot_0.1.16
[13] GetoptLong_1.0.5 withr_3.0.0 sp_2.1-3
[16] gridExtra_2.3 progressr_0.14.0 cli_3.6.5
[19] spatstat.explore_3.2-6 prismatic_1.1.1 labeling_0.4.3
[22] sass_0.4.10 spatstat.data_3.0-4 ggridges_0.5.6
[25] pbapply_1.7-2 parallelly_1.37.0 rstudioapi_0.15.0
[28] RSQLite_2.3.5 generics_0.1.3 shape_1.4.6
[31] ica_1.0-3 spatstat.random_3.2-2 dendextend_1.17.1
[34] Matrix_1.6-5 fansi_1.0.6 abind_1.4-5
[37] lifecycle_1.0.4 whisker_0.4.1 yaml_2.3.8
[40] SparseArray_1.2.4 Rtsne_0.17 grid_4.3.3
[43] blob_1.2.4 promises_1.2.1 crayon_1.5.2
[46] miniUI_0.1.1.1 lattice_0.22-5 cowplot_1.1.3
[49] KEGGREST_1.42.0 pillar_1.9.0 knitr_1.50
[52] ComplexHeatmap_2.18.0 rjson_0.2.21 future.apply_1.11.1
[55] codetools_0.2-19 leiden_0.4.3.1 getPass_0.2-4
[58] data.table_1.15.0 vctrs_0.6.5 png_0.1-8
[61] cellranger_1.1.0 gtable_0.3.6 rematch2_2.1.2
[64] cachem_1.0.8 xfun_0.52 S4Arrays_1.2.0
[67] mime_0.12 tidygraph_1.3.1 survival_3.5-8
[70] pheatmap_1.0.12 iterators_1.0.14 statmod_1.5.0
[73] ellipsis_0.3.2 fitdistrplus_1.1-11 ROCR_1.0-11
[76] nlme_3.1-164 bit64_4.0.5 RcppAnnoy_0.0.22
[79] rprojroot_2.0.4 bslib_0.6.1 irlba_2.3.5.1
[82] KernSmooth_2.23-22 colorspace_2.1-0 DBI_1.2.1
[85] tidyselect_1.2.1 processx_3.8.3 bit_4.0.5
[88] compiler_4.3.3 git2r_0.33.0 DelayedArray_0.28.0
[91] plotly_4.10.4 scales_1.3.0 lmtest_0.9-40
[94] callr_3.7.3 digest_0.6.34 goftest_1.2-3
[97] spatstat.utils_3.0-4 rmarkdown_2.29 XVector_0.42.0
[100] htmltools_0.5.8.1 pkgconfig_2.0.3 fastmap_1.1.1
[103] rlang_1.1.6 GlobalOptions_0.1.2 htmlwidgets_1.6.4
[106] shiny_1.8.0 farver_2.1.1 jquerylib_0.1.4
[109] zoo_1.8-12 jsonlite_1.8.8 mclust_6.1
[112] RCurl_1.98-1.14 magrittr_2.0.3 GenomeInfoDbData_1.2.11
[115] munsell_0.5.0 Rcpp_1.0.12 viridis_0.6.5
[118] reticulate_1.42.0 stringi_1.8.3 zlibbioc_1.48.0
[121] MASS_7.3-60.0.1 plyr_1.8.9 parallel_4.3.3
[124] listenv_0.9.1 ggrepel_0.9.5 deldir_2.0-2
[127] Biostrings_2.70.2 graphlayouts_1.1.0 splines_4.3.3
[130] tensor_1.5 hms_1.1.3 circlize_0.4.15
[133] locfit_1.5-9.8 ps_1.7.6 igraph_2.0.1.1
[136] spatstat.geom_3.2-8 reshape2_1.4.4 evaluate_0.23
[139] renv_1.1.4 BiocManager_1.30.22 tzdb_0.4.0
[142] foreach_1.5.2 tweenr_2.0.3 httpuv_1.6.14
[145] RANN_2.6.1 polyclip_1.10-6 future_1.33.1
[148] clue_0.3-65 scattermore_1.2 ggforce_0.4.2
[151] xtable_1.8-4 later_1.3.2 viridisLite_0.4.2
[154] memoise_2.0.1 cluster_2.1.6 timechange_0.3.0
[157] globals_0.16.2