Figure 4
Jovana Maksimovic
April 01, 2026
Last updated: 2026-04-01
Checks: 7 0
Knit directory:
paediatric-cf-inflammation-citeseq/
This reproducible R Markdown analysis was created with workflowr (version 1.7.1). The Checks tab describes the reproducibility checks that were applied when the results were created. The Past versions tab lists the development history.
Great! Since the R Markdown file has been committed to the Git repository, you know the exact version of the code that produced these results.
Great job! The global environment was empty. Objects defined in the global environment can affect the analysis in your R Markdown file in unknown ways. For reproduciblity it’s best to always run the code in an empty environment.
The command set.seed(20240216) was run prior to running
the code in the R Markdown file. Setting a seed ensures that any results
that rely on randomness, e.g. subsampling or permutations, are
reproducible.
Great job! Recording the operating system, R version, and package versions is critical for reproducibility.
Nice! There were no cached chunks for this analysis, so you can be confident that you successfully produced the results during this run.
Great job! Using relative paths to the files within your workflowr project makes it easier to run your code on other machines.
Great! You are using Git for version control. Tracking code development and connecting the code version to the results is critical for reproducibility.
The results in this page were generated with repository version 5879432. See the Past versions tab to see a history of the changes made to the R Markdown and HTML files.
Note that you need to be careful to ensure that all relevant files for
the analysis have been committed to Git prior to generating the results
(you can use wflow_publish or
wflow_git_commit). workflowr only checks the R Markdown
file, but you know if there are other scripts or data files that it
depends on. Below is the status of the Git repository when the results
were generated:
Ignored files:
    Ignored:    .Rhistory
    Ignored:    .Rproj.user/
    Ignored:    analysis/.DS_Store
    Ignored:    analysis/obsolete/
    Ignored:    code/obsolete/
    Ignored:    data/.DS_Store
    Ignored:    data/C133_Neeland_batch0/
    Ignored:    data/C133_Neeland_batch1/
    Ignored:    data/C133_Neeland_batch2/
    Ignored:    data/C133_Neeland_batch3/
    Ignored:    data/C133_Neeland_batch4/
    Ignored:    data/C133_Neeland_batch5/
    Ignored:    data/C133_Neeland_batch6/
    Ignored:    data/C133_Neeland_merged/
    Ignored:    data/Neeland_processed_data_1.h5ad
    Ignored:    data/Neeland_processed_data_2.h5ad
    Ignored:    data/Neeland_processed_data_3.h5ad
    Ignored:    data/intermediate_objects/.DS_Store
    Ignored:    data/updated_h5ad_files/
    Ignored:    output/.DS_Store
    Ignored:    renv/library/
    Ignored:    renv/staging/

Untracked files:
    Untracked:  C133_Neeland_preprocessed_SCEs.tar.gz
    Untracked:  analysis/cellxgene_submission.Rmd
    Untracked:  data/GOBP_CYTOKINE_MEDIATED_SIGNALING_PATHWAY.v2025.1.Hs.tsv
    Untracked:  data/cellxgene_cell_ontologies_ann_level_3.xlsx
    Untracked:  data/gencode.v44.primary_assembly.annotation.gtf

Unstaged changes:
    Modified:   .DS_Store
    Modified:   analysis/13.0_DGE_analysis_macrophages.Rmd
    Modified:   analysis/13.1_DGE_analysis_macro-alveolar.Rmd
    Modified:   analysis/13.2_DGE_analysis_macro-APOC2+.Rmd
    Modified:   analysis/13.3_DGE_analysis_macro-CCL.Rmd
    Modified:   analysis/13.4_DGE_analysis_macro-IFI27.Rmd
    Modified:   analysis/13.5_DGE_analysis_macro-lipid.Rmd
    Modified:   analysis/13.6_DGE_analysis_macro-monocyte-derived.Rmd
    Modified:   analysis/13.7_DGE_analysis_macro-proliferating.Rmd
    Modified:   analysis/14.0_DGE_analysis_CD4-T-cells.Rmd
    Modified:   analysis/14.1_DGE_analysis_CD8-T-cells.Rmd
    Modified:   analysis/14.2_DGE_analysis_DC-cells.Rmd
    Modified:   analysis/15.0_proportions_analysis_ann_level_1.Rmd
    Modified:   analysis/15.1_proportions_analysis_ann_level_3_non-macrophages.Rmd
    Modified:   analysis/15.2_proportions_analysis_ann_level_3_macrophages.Rmd
    Modified:   output/dge_analysis/macrophages/CAM.FIBROSIS.CF.IVAvCF.NO_MOD.csv
    Modified:   output/dge_analysis/macrophages/CAM.FIBROSIS.CF.IVAvNON_CF.CTRL.csv
    Modified:   output/dge_analysis/macrophages/CAM.FIBROSIS.CF.LUMA_IVAvCF.NO_MOD.csv
    Modified:   output/dge_analysis/macrophages/CAM.FIBROSIS.CF.NO_MOD.SvCF.NO_MOD.M.csv
    Modified:   output/dge_analysis/macrophages/CAM.FIBROSIS.CF.NO_MODvNON_CF.CTRL.csv
    Modified:   output/dge_analysis/macrophages/CAM.GO.CF.IVAvCF.NO_MOD.csv
    Modified:   output/dge_analysis/macrophages/CAM.GO.CF.IVAvNON_CF.CTRL.csv
    Modified:   output/dge_analysis/macrophages/CAM.GO.CF.LUMA_IVAvCF.NO_MOD.csv
    Modified:   output/dge_analysis/macrophages/CAM.GO.CF.NO_MOD.SvCF.NO_MOD.M.csv
    Modified:   output/dge_analysis/macrophages/CAM.GO.CF.NO_MODvNON_CF.CTRL.csv
    Modified:   output/dge_analysis/macrophages/CAM.HALLMARK.CF.IVAvCF.NO_MOD.csv
    Modified:   output/dge_analysis/macrophages/CAM.HALLMARK.CF.IVAvNON_CF.CTRL.csv
    Modified:   output/dge_analysis/macrophages/CAM.HALLMARK.CF.LUMA_IVAvCF.NO_MOD.csv
    Modified:   output/dge_analysis/macrophages/CAM.HALLMARK.CF.NO_MOD.SvCF.NO_MOD.M.csv
    Modified:   output/dge_analysis/macrophages/CAM.HALLMARK.CF.NO_MODvNON_CF.CTRL.csv
    Modified:   output/dge_analysis/macrophages/CAM.REACTOME.CF.IVAvCF.NO_MOD.csv
    Modified:   output/dge_analysis/macrophages/CAM.REACTOME.CF.IVAvNON_CF.CTRL.csv
    Modified:   output/dge_analysis/macrophages/CAM.REACTOME.CF.LUMA_IVAvCF.NO_MOD.csv
    Modified:   output/dge_analysis/macrophages/CAM.REACTOME.CF.NO_MOD.SvCF.NO_MOD.M.csv
    Modified:   output/dge_analysis/macrophages/CAM.REACTOME.CF.NO_MODvNON_CF.CTRL.csv
    Modified:   output/dge_analysis/macrophages/CAM.WP.CF.IVAvCF.NO_MOD.csv
    Modified:   output/dge_analysis/macrophages/CAM.WP.CF.IVAvNON_CF.CTRL.csv
    Modified:   output/dge_analysis/macrophages/CAM.WP.CF.LUMA_IVAvCF.NO_MOD.csv
    Modified:   output/dge_analysis/macrophages/CAM.WP.CF.NO_MOD.SvCF.NO_MOD.M.csv
    Modified:   output/dge_analysis/macrophages/CAM.WP.CF.NO_MODvNON_CF.CTRL.csv
    Modified:   output/dge_analysis/macrophages/CF.IVAvCF.NO_MOD.csv
    Modified:   output/dge_analysis/macrophages/CF.IVAvNON_CF.CTRL.csv
    Modified:   output/dge_analysis/macrophages/CF.LUMA_IVAvCF.NO_MOD.csv
    Modified:   output/dge_analysis/macrophages/CF.NO_MOD.SvCF.NO_MOD.M.csv
    Modified:   output/dge_analysis/macrophages/CF.NO_MODvNON_CF.CTRL.csv
    Modified:   output/dge_analysis/macrophages/ORA.GO.CF.IVAvNON_CF.CTRL.csv
    Modified:   output/dge_analysis/macrophages/ORA.GO.CF.NO_MOD.SvCF.NO_MOD.M.csv
    Modified:   output/dge_analysis/macrophages/ORA.GO.CF.NO_MODvNON_CF.CTRL.csv
    Modified:   output/dge_analysis/macrophages/ORA.HALLMARK.CF.IVAvCF.NO_MOD.csv
    Modified:   output/dge_analysis/macrophages/ORA.REACTOME.CF.NO_MODvNON_CF.CTRL.csv
    Modified:   output/pdf_figures/Figure_1.pdf
    Modified:   output/pdf_figures/Figure_2.pdf
    Modified:   output/pdf_figures/Figure_3.pdf
Note that any generated files, e.g. HTML, png, CSS, etc., are not included in this status report because it is ok for generated content to have uncommitted changes.
These are the previous versions of the repository in which changes were
made to the R Markdown (analysis/16.3_Figure_4.Rmd) and
HTML (docs/16.3_Figure_4.html) files. If you’ve configured
a remote Git repository (see ?wflow_git_remote), click on
the hyperlinks in the table below to view the files as they were in that
past version.
| File | Version | Author | Date | Message |
|---|---|---|---|---|
| Rmd | 5879432 | Jovana Maksimovic | 2026-04-01 | wflow_publish(c("analysis/16.0_Figure_1.Rmd", "analysis/16.1_Figure_2.Rmd", |
| html | 1a51c83 | Jovana Maksimovic | 2026-03-23 | Build site. |
| Rmd | e49b23f | Jovana Maksimovic | 2026-03-23 | wflow_publish("analysis/16.3_Figure_4.Rmd") |
| html | 280aa74 | Jovana Maksimovic | 2025-09-10 | Build site. |
| Rmd | 67e91c8 | Jovana Maksimovic | 2025-09-10 | wflow_publish("analysis/16.3_Figure_4.Rmd") |
| html | 20cae99 | Jovana Maksimovic | 2025-03-04 | Build site. |
| Rmd | 65ca932 | Jovana Maksimovic | 2025-03-04 | wflow_publish("analysis/16.3_Figure_4.Rmd") |
Load libraries.
suppressPackageStartupMessages({
 library(SingleCellExperiment)
 library(edgeR)
 library(tidyverse)
 library(ggplot2)
 library(Seurat)
 library(glmGamPoi)
 library(dittoSeq)
 library(here)
 library(clustree)
 library(patchwork)
 library(AnnotationDbi)
 library(org.Hs.eg.db)
 library(glue)
 library(speckle)
 library(tidyHeatmap)
 library(paletteer)
 library(dsb)
 library(ggh4x)
  library(readxl)
})

source(here("code/utility.R"))
Load data
files <- list.files(here("data/C133_Neeland_merged"),
                    pattern = "C133_Neeland_full_clean.*(macrophages|t_cells|other_cells)_annotated_diet.SEU.rds",
                    full.names = TRUE)

seuLst <- lapply(files[2:4], function(f) readRDS(f))

seu <- merge(seuLst[[1]],
             y = c(seuLst[[2]],
                   seuLst[[3]]))
seu
An object of class Seurat
21568 features across 194407 samples within 1 assay
Active assay: RNA (21568 features, 0 variable features) used (Mb) gc trigger (Mb) limit (Mb) max used (Mb)
Ncells 10386500 554.7 18287452 976.7 NA 13846801 739.5
Vcells 1351266351 10309.4 3689741492 28150.5 65536 3548604036 27073.8Create sample meta data table.
props <- getTransformedProps(clusters = seu$ann_level_3,
                             sample = seu$sample.id, transform="asin")

seu@meta.data %>%
  dplyr::select(sample.id,
                Participant,
                Disease,
                Treatment,
                Severity,
                Group,
                Group_severity,
                Batch,
                Age,
                Sex) %>%
     left_join(props$Counts %>%
                 data.frame %>%
                 group_by(sample) %>%
                 summarise(ncells = sum(Freq)),
               by = c("sample.id" = "sample")) %>%
    distinct() -> info

head(info) %>% knitr::kable()| sample.id | Participant | Disease | Treatment | Severity | Group | Group_severity | Batch | Age | Sex | ncells |
|---|---|---|---|---|---|---|---|---|---|---|
| sample_33.1 | sample_33 | CF | treated (ivacaftor) | severe | CF.IVA | CF.IVA.S | 1 | 5.950685 | M | 2139 |
| sample_25.1 | sample_25 | CF | untreated | severe | CF.NO_MOD | CF.NO_MOD.S | 1 | 4.910000 | F | 3272 |
| sample_29.1 | sample_29 | CF | untreated | severe | CF.NO_MOD | CF.NO_MOD.S | 1 | 5.989041 | F | 1568 |
| sample_27.1 | sample_27 | CF | treated (ivacaftor) | mild | CF.IVA | CF.IVA.M | 1 | 4.917808 | M | 2467 |
| sample_32.1 | sample_32 | CF | untreated | mild | CF.NO_MOD | CF.NO_MOD.M | 1 | 5.926027 | F | 2963 |
| sample_26.1 | sample_26 | CF | untreated | mild | CF.NO_MOD | CF.NO_MOD.M | 1 | 5.049315 | M | 2040 |
Prepare figure panels
Set up short/better names for cell types and conditions in figure.
lab_map <- c(
  "macro-alveolar"          = "AM",
  "macro-IGF1"              = "AM.IGF1",
  "macro-CCL"               = "AM.CCL",
  "macro-lipid"             = "AM.Lipid",
  "macro-MT"                = "AM.MT",
  "macro-IFN"               = "AM.IFN",
  "macro-APOC2+"            = "AM.APOC2",
  "macro-CCL18"             = "AM.CCL18",
  "macro-IFI27"             = "AM.IFI27",
  "macro-monocyte-derived"  = "Mac.Mono.Deriv",
  "macro-interstitial"      = "Mac.Interstitial",
  "macro-lipid-APOC2+"      = "AM.Lipid.APOC2",
  "macro-T"                 = "Mac.T",
  "macro-IFI27+CCL18+"      = "AM.IFI27.CCL18",
  "macro-IFI27+APOC2+"      = "AM.IFI27.APOC2",
  "macro-proliferating"     = "Mac.Prolif",
  "macrophages"             = "All Mac (exc. Prolif)"
)

samp_map <-
c(
  "CF.NO_MOD.S" = "CF (no mod)(S)",
  "CF.NO_MOD.M" = "CF (no mod)(M)"
)
# HSP+ B, CD4 T-IFN
props <- getTransformedProps(clusters = seu$ann_level_3[!str_detect(seu$ann_level_3, "macro")],
sample = seu$sample.id[!str_detect(seu$ann_level_3, "macro")], transform="asin")
props$Proportions %>% data.frame %>%
left_join(info,
by = c("sample" = "sample.id")) %>%
dplyr::filter(Group_severity %in% c("CF.NO_MOD.S", "CF.NO_MOD.M"),
clusters %in% c("CD4 T-IFN",
"HSP+ B cells")) -> dat
sig_names <- as_labeller(
c("CD4 T-IFN" = "CD4 T-IFN",
"HSP+ B cells" = "HSP+ B cells"))
pal <- setNames(RColorBrewer::brewer.pal(2, "Accent"),
unname(samp_map))
dat %>%
mutate(Group_severity = samp_map[Group_severity]) %>%
ggplot(aes(x = Group_severity,
y = Freq,
colour = Group_severity)) +
geom_jitter(stat = "identity",
width = 0.15,
size = 2) +
theme_classic() +
theme(axis.text.x = element_blank(),
axis.ticks.x = element_blank(),
axis.title.x = element_blank(),
axis.text.y = element_text(7),
legend.position = "bottom",
legend.direction = "horizontal",
strip.text = element_text(size = 8)) +
labs(x = "Group", y = "Proportion",
colour = "Group") +
facet_wrap(~clusters, scales = "free_y", ncol = 4,
labeller = sig_names) +
stat_summary(
geom = "point",
fun.y = "mean",
col = "black",
shape = "_",
size = 10) +
scale_color_manual(values = pal) -> p1
p1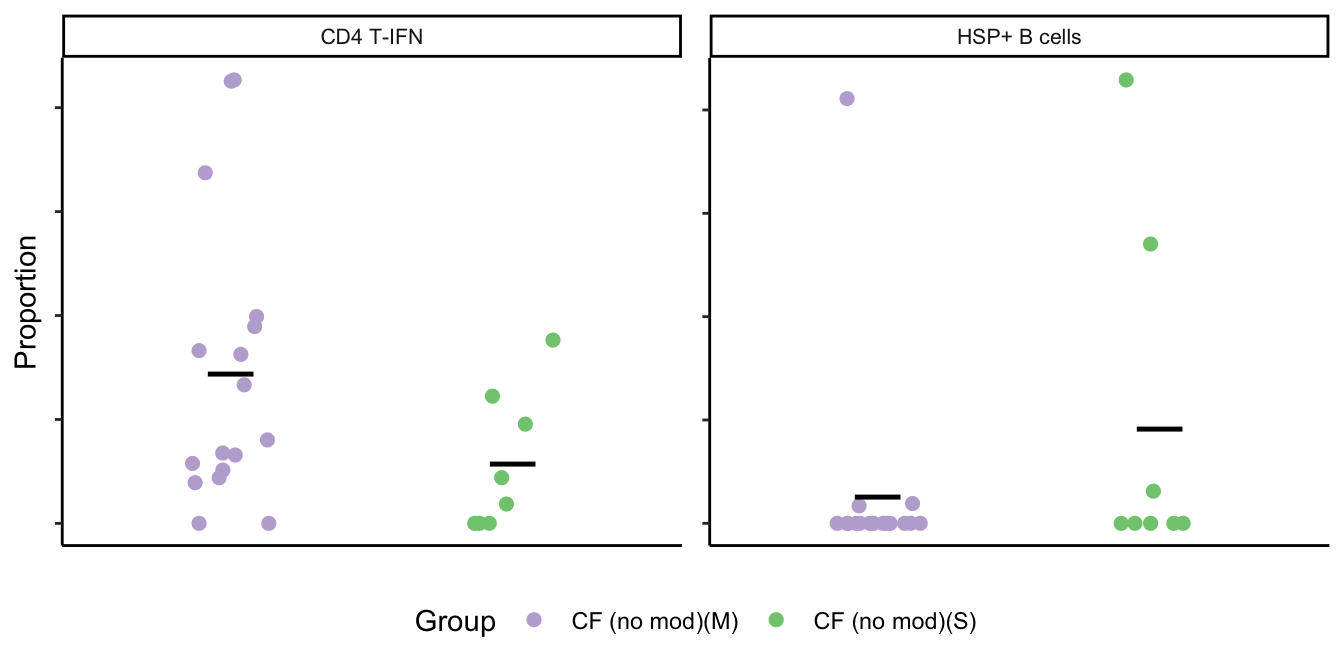
| Version | Author | Date |
|---|---|---|
| 280aa74 | Jovana Maksimovic | 2025-09-10 |
seu@meta.data %>%
    data.frame %>%
    dplyr::select(ann_level_2) %>%
    dplyr::filter(str_detect(ann_level_2, "macro")) %>%
    group_by(ann_level_2) %>%
    count() %>%
    janitor::adorn_totals(name = "macrophages") %>%
    arrange(-n) %>%
    dplyr::rename(cell = ann_level_2) -> cell_freq

cell_freq
cell n
macrophages 165209
macro-alveolar 52563
macro-IFI27 24864
macro-CCL 21246
macro-monocyte-derived 13461
macro-APOC2+ 13354
macro-lipid 12452
macro-IGF1 8229
macro-proliferating 6821
macro-MT 4037
macro-interstitial 3412
macro-T 2722
macro-IFN 2048files <- list.files(here("data/intermediate_objects"),
pattern = "macro.*CF_samples",
full.names = TRUE)
cutoff <- 0.05
cont_name <- "CF.NO_MOD.SvCF.NO_MOD.M"
lfc_cutoff <- 0
suffix <- ".CF_samples.fit.rds"
get_deg_data(files, cont_name, cell_freq, treat_lfc = lfc_cutoff,
suffix = suffix) -> datZero log2-FC threshold detected. Switch to glmLRT() instead.
Zero log2-FC threshold detected. Switch to glmLRT() instead.
Zero log2-FC threshold detected. Switch to glmLRT() instead.
Zero log2-FC threshold detected. Switch to glmLRT() instead.
Zero log2-FC threshold detected. Switch to glmLRT() instead.
Zero log2-FC threshold detected. Switch to glmLRT() instead.
Zero log2-FC threshold detected. Switch to glmLRT() instead.
Zero log2-FC threshold detected. Switch to glmLRT() instead. genes <- c("ARHGEF5",
"GPD1",
"ITGA1",
"SIRPB1",
"TLCD4",
"GBP3",
"CLIC2",
"LILRB2",
"MMP14",
"SLC28A3",
"SLC46A1",
"ARPIN",
"CTSK",
"VAMP5")
dat %>%
dplyr::select(gene, cell, logFC) %>%
distinct() %>%
dplyr::filter(gene %in% sort(genes)) %>%
pivot_wider(
names_from = cell, # Column whose values become new column names
values_from = logFC,
values_fill = list(logFC = NA)) %>%
arrange(across(all_of(cell_freq$cell[cell_freq$cell %in% .$cell]))) %>%
column_to_rownames(var = "gene") -> dat_lfccol_fun <- circlize::colorRamp2(seq(0, 100000, length.out = 9),
(RColorBrewer::brewer.pal(9, "PiYG")))
col_split <- c(rep("aggregate", 1), rep("sub-type", ncol(dat_lfc) - 1))
pal_dt <- c(paletteer::paletteer_d("RColorBrewer::Set1")[2:1], "grey")
col_lfc_fun <- circlize::colorRamp2(seq(-2, 2, length.out = 3),
c(pal_dt[1], "white", pal_dt[2]))
ComplexHeatmap::HeatmapAnnotation(df = cell_freq %>%
dplyr::filter(cell %in% colnames(dat_lfc)) %>%
column_to_rownames(var = "cell") %>%
dplyr::rename(`No. cells` = n),
which = "column",
show_annotation_name = FALSE,
col = list(`No. cells` = col_fun),
annotation_legend_param = list(
`No. cells` = list(direction = "vertical",
labels_gp = grid::gpar(fontsize = 7)))) -> col_ann
colnames(dat_lfc) <- lab_map[colnames(dat_lfc)]
ComplexHeatmap::Heatmap(dat_lfc,
name = "logFC",
column_split = col_split,
column_title = NULL,
cluster_rows = FALSE,
cluster_columns = FALSE,
rect_gp = grid::gpar(col = "white", lwd = 1),
row_names_gp = grid::gpar(fontsize = 8),
column_names_gp = grid::gpar(fontsize = 8,
just = "centre"),
column_names_rot = 0,
column_names_centered = TRUE,
top_annotation = col_ann,
col = col_lfc_fun,
heatmap_legend_param = list(direction = "vertical",
labels_gp = grid::gpar(fontsize = 7))) -> plot_lfc
ComplexHeatmap::draw(as(list(plot_lfc), "HeatmapList"),
heatmap_legend_side = "right",
annotation_legend_side = "right",
merge_legends = TRUE) -> plot_lfc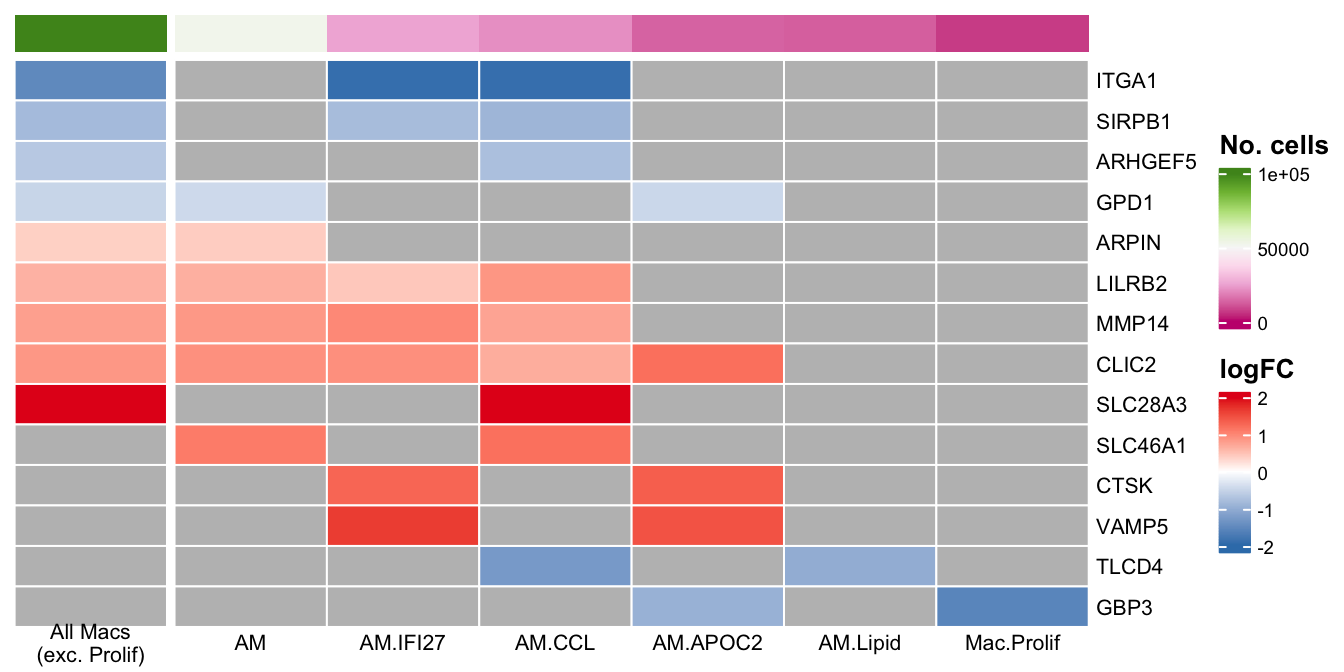
plot_lfc
bind_rows(lapply(files, function(f){
  deg_results <- readRDS(f)
  lrt <- glmLRT(deg_results$fit,
                contrast = deg_results$contr[,cont_name])
  tmp <- cbind(summary(decideTests(lrt, p.value = cutoff)) %>% data.frame,
                    cell = str_extract(basename(f), "^[^.]+"))
  tmp
})) -> dat_deg
dat_deg %>%
left_join(cell_freq) -> dat_deg
dat_deg %>%
dplyr::filter(Var1 != "NotSig") %>%
mutate(cell = lab_map[as.character(cell)]) %>%
ggplot(aes(x = fct_reorder(cell, -n), y = Freq, fill = Var1)) +
geom_col(position = "dodge") +
scale_fill_manual(values = pal_dt) +
theme_classic() +
theme(axis.text.x = element_text(angle = 0,
hjust = 0.5,
vjust = 1,
size = 8),
legend.position = "top") +
geom_text(aes(label = Freq),
position = position_dodge(width = 0.9),
vjust = -0.5,
size = 2.5) +
labs(x = "Cell Type",
y = "No. DEG (FDR < 0.05)",
fill = "Direction") -> deg_barplot
deg_barplot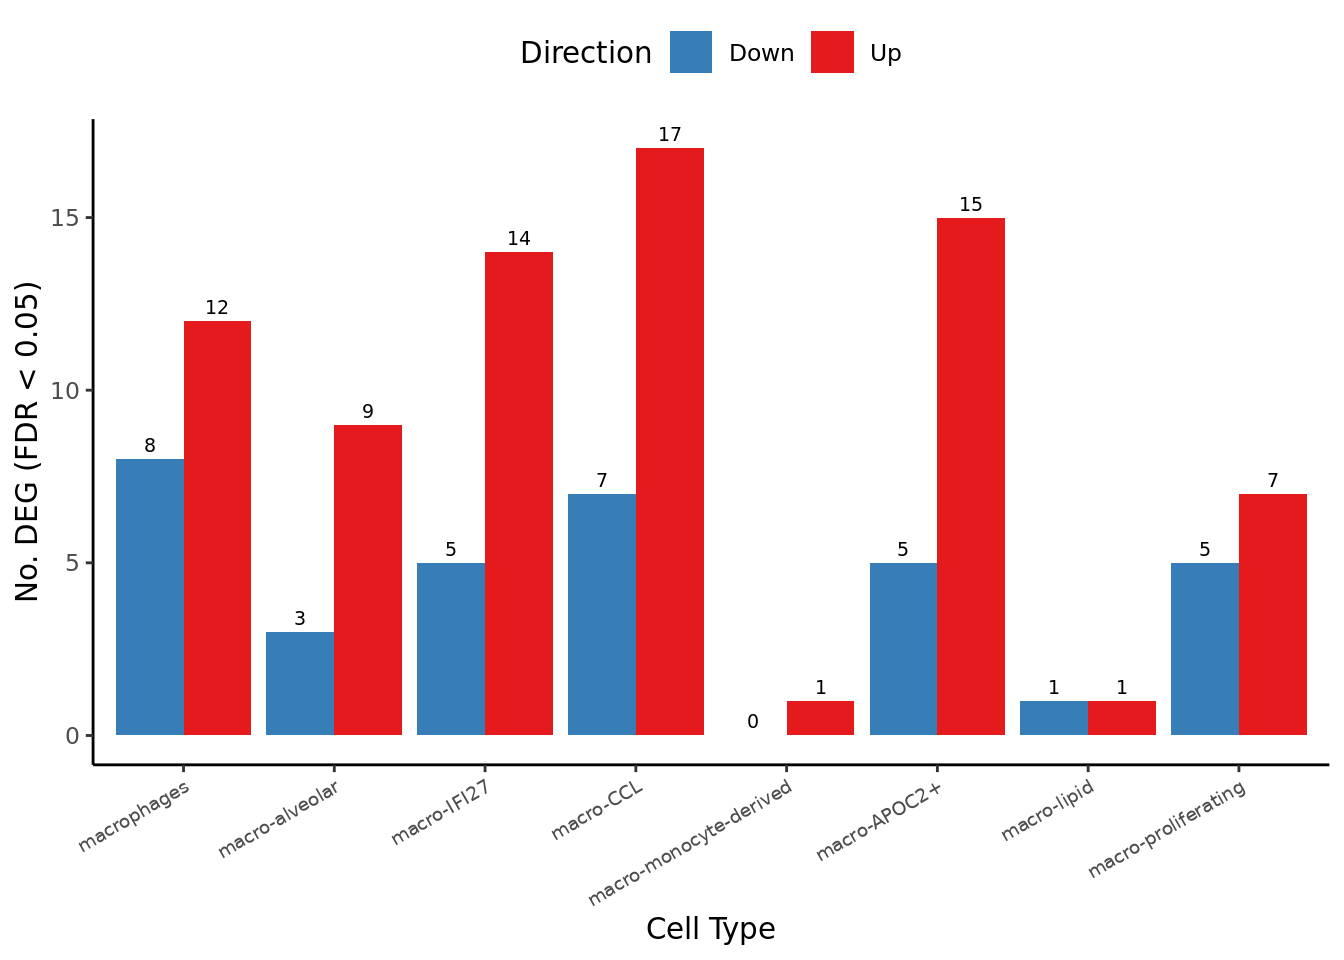
get_deg_data(files, cont_name, cell_freq, treat_lfc = lfc_cutoff,
             suffix = suffix, cutoff = 1) -> dat_all
Zero log2-FC threshold detected. Switch to glmLRT() instead.
Zero log2-FC threshold detected. Switch to glmLRT() instead.
Zero log2-FC threshold detected. Switch to glmLRT() instead.
Zero log2-FC threshold detected. Switch to glmLRT() instead.
Zero log2-FC threshold detected. Switch to glmLRT() instead.
Zero log2-FC threshold detected. Switch to glmLRT() instead.
Zero log2-FC threshold detected. Switch to glmLRT() instead.
Zero log2-FC threshold detected. Switch to glmLRT() instead. dat_all %>%
left_join(cell_freq) %>%
mutate(Direction = as.factor(ifelse(sig == -1, "Down",
ifelse(sig == 1, "Up", "N.S."))),
cell = fct_reorder(cell, -n)) -> dat_alllibrary(purrr)
# Function to extract normalized counts from one file
extract_norm_counts <- function(file) {
# Get cell type from file name
cell_type <- gsub("^.*/|\\.CF_samples\\.fit\\.rds$", "", file)
# Load the RDS object
dat <- readRDS(file)
# Extract normalized counts
counts <- as.data.frame(dat$adj$normalizedCounts)
counts$gene <- rownames(counts)
# Convert to long format: gene × sample × count
counts_long <- counts %>%
pivot_longer(-gene, names_to = "sample", values_to = "count") %>%
mutate(celltype = cell_type)
return(counts_long)
}
dat_norm_long <- map_dfr(files, extract_norm_counts) %>%
dplyr::filter(gene %in% genes) %>%
left_join(seu@meta.data %>%
remove_rownames %>%
dplyr::select(sample.id,
Group,
Group_severity,
Age) %>%
distinct(),
by = c("sample" = "sample.id")) %>%
dplyr::filter(Group == "CF.NO_MOD") %>%
mutate(expr = log2(count + 0.5))
dat_norm_long %>%
inner_join(dat_all,
by = c("gene" = "gene",
"celltype" = "cell")) -> dat_combinedlibrary(dplyr)
library(tidyr)
library(ComplexHeatmap)
library(circlize)
library(tibble)
library(grid)
plot_macro_heatmap <- function(dat_combined, sig_only = FALSE) {
# --- 1. Subset main macrophage population ---
dat_macro <- dat_combined %>%
filter(celltype == "macrophages")
# --- 2. Pivot to gene × sample matrix ---
expr_mat <- dat_macro %>%
dplyr::select(gene, sample, expr) %>%
pivot_wider(names_from = sample, values_from = expr) %>%
column_to_rownames("gene") %>%
as.matrix()
# --- 3. Optionally filter to genes significant in macrophages AND other subsets ---
if (sig_only) {
sig_in_macro <- dat_combined %>%
filter(celltype == "macrophages", sig != 0) %>%
pull(gene) %>%
unique()
sig_in_other <- dat_combined %>%
filter(celltype != "macrophages", sig != 0) %>%
pull(gene) %>%
unique()
genes_keep <- intersect(sig_in_macro, sig_in_other)
genes_keep <- genes_keep[genes_keep %in% rownames(expr_mat)]
if (length(genes_keep) == 0) {
stop("No genes are significant in both macrophages and other subsets.")
}
expr_mat <- expr_mat[genes_keep, ]
message(glue::glue("{length(genes_keep)} genes significant in macrophages and at least one other subset."))
}
# --- 4. Column annotation ---
sample_anno <- dat_combined %>%
dplyr::select(sample, Group_severity, Age) %>%
distinct() %>%
column_to_rownames("sample")
ha_col <- HeatmapAnnotation(
Severity = samp_map[sample_anno$Group_severity],
Age = sample_anno$Age,
col = list(
Severity = c(
"CF (no mod)(S)" = "#A6DBA0",
"CF (no mod)(M)" = "#C2A5CF"
),
Age = colorRamp2(
seq(min(dat_combined$Age), max(dat_combined$Age), length.out = 9),
RColorBrewer::brewer.pal(9, "Purples")
)
),
annotation_name_side = "left",
show_annotation_name = FALSE
)
# --- 5. Row annotation data: significance in other subsets ---
sig_other <- dat_combined %>%
group_by(gene, celltype) %>%
summarise(
sig_dir = case_when(
any(sig == 1) ~ "Up",
any(sig == -1) ~ "Down",
TRUE ~ "Not significant"
),
.groups = "drop"
) %>%
pivot_wider(names_from = celltype, values_from = sig_dir,
values_fill = "Not significant") %>%
filter(gene %in% rownames(expr_mat)) %>%
column_to_rownames("gene")
celltype_order <- dat_combined %>%
distinct(celltype, n) %>%
arrange(desc(n)) %>%
pull(celltype)
sig_other <- sig_other[, celltype_order, drop = FALSE]
sig_other_chr <- sig_other %>% mutate(across(everything(), as.character))
if (sig_only) {
sig_other_chr <- sig_other_chr %>% dplyr::select(-any_of("macrophages"))
}
colnames(sig_other_chr) <- lab_map[colnames(sig_other_chr)]
sig_colors <- c(
"Up" = "#E7298A",
"Down" = "#66C2A5",
"Not significant" = "#E8E8E8"
)
# --- 6. Z-score normalise ---
expr_mat_z <- t(scale(t(expr_mat)))
# --- 7. Build heatmap without row annotation to get clustered row order ---
ht_tmp <- Heatmap(
expr_mat_z,
name = "Expression",
top_annotation = ha_col,
show_row_names = TRUE,
show_column_names = TRUE,
cluster_rows = TRUE,
cluster_columns = TRUE,
row_names_gp = gpar(fontsize = 8),
column_names_gp = gpar(fontsize = 8),
heatmap_legend_param = list(
title = bquote(bold("Scaled log"[2]~"expression"))
),
column_split = sample_anno$Group_severity,
column_title = NULL
)
# Draw to invisible device to extract row order
pdf(NULL)
ht_tmp
clustered_row_order <- rownames(ht_tmp@matrix)
dev.off()
# --- 8. Reorder annotation to match clustered row order ---
sig_other_chr <- sig_other_chr[clustered_row_order, , drop = FALSE]
# --- 9. Build row annotation with correctly ordered data ---
ha_row <- rowAnnotation(
df = sig_other_chr,
col = setNames(
replicate(ncol(sig_other_chr), sig_colors, simplify = FALSE),
colnames(sig_other_chr)
),
show_legend = FALSE,
annotation_name_gp = gpar(fontsize = 8),
annotation_name_side = "top"
)
# --- 10. Build final heatmap with correct row annotation ---
ht <- Heatmap(
expr_mat_z,
name = "Expression",
top_annotation = ha_col,
right_annotation = ha_row,
show_row_names = TRUE,
show_column_names = TRUE,
cluster_rows = TRUE,
cluster_columns = TRUE,
row_names_gp = gpar(fontsize = 8),
column_names_gp = gpar(fontsize = 8),
heatmap_legend_param = list(
title = bquote(bold("Scaled log"[2]~"expression"))
),
column_split = sample_anno$Group_severity,
column_title = NULL
)
sig_legend <- Legend(
title = "Significant",
at = c("Up", "Down", "Not significant"),
labels = c("Up", "Down", "Not significant"),
legend_gp = gpar(fill = sig_colors)
)
list(ht = ht, sig_legend = sig_legend)
}# All genes
plot_macro_heatmap(dat_combined, sig_only = FALSE) -> ht_out
ht_out$ht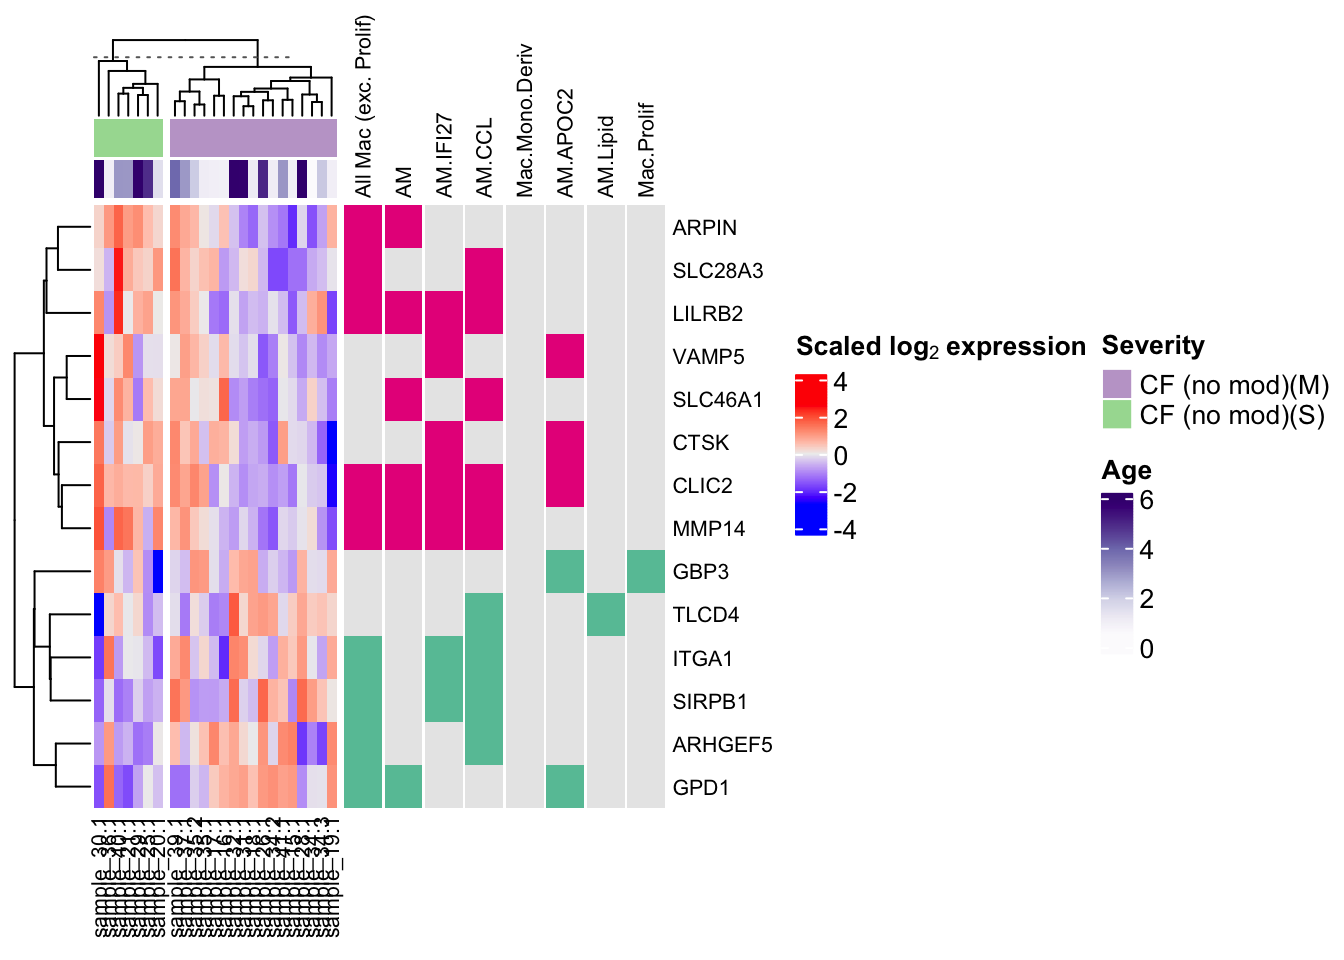
| Version | Author | Date |
|---|---|---|
| 1a51c83 | Jovana Maksimovic | 2026-03-23 |
$sig_legend
A single legend
Figure 4
ht_to_ggplot <- function(ht, legend_list = NULL, width = 10, height = 5, res = 300) {
  tmp <- tempfile(fileext = ".png")
  png(tmp, width = width, height = height, units = "in", res = res)
  draw(
    ht,
    annotation_legend_list = legend_list,
    heatmap_legend_side    = "right",
    annotation_legend_side = "right",
    merge_legend           = TRUE
  )
  dev.off()

  img <- png::readPNG(tmp)

  ggplot() +
    annotation_raster(img, xmin = 0, xmax = 1, ymin = 0, ymax = 1,
                    interpolate = FALSE) +
    theme_void()
}

# Use it
ht_panel <- ht_to_ggplot(
  ht          = ht_out$ht,
  legend_list = list(ht_out$sig_legend),
  width       = 10,
  height      = 6.67,
  res         = 900
)

# Then in patchwork
layout <- "
ABB
CCC
CCC
"

wrap_elements(p1 + theme(legend.direction = "vertical",
                         plot.margin = margin(rep(0,4)))) +
wrap_elements(deg_barplot + theme(axis.title.x = element_blank(),
                                  legend.text = element_text(size = 8),
                                  plot.margin = margin(rep(0,4)))) +
ht_panel +
plot_layout(design = layout) +
plot_annotation(tag_levels = "A") &
theme(plot.tag = element_text(size = 24, face = "bold", family = "Arial")) -> p

p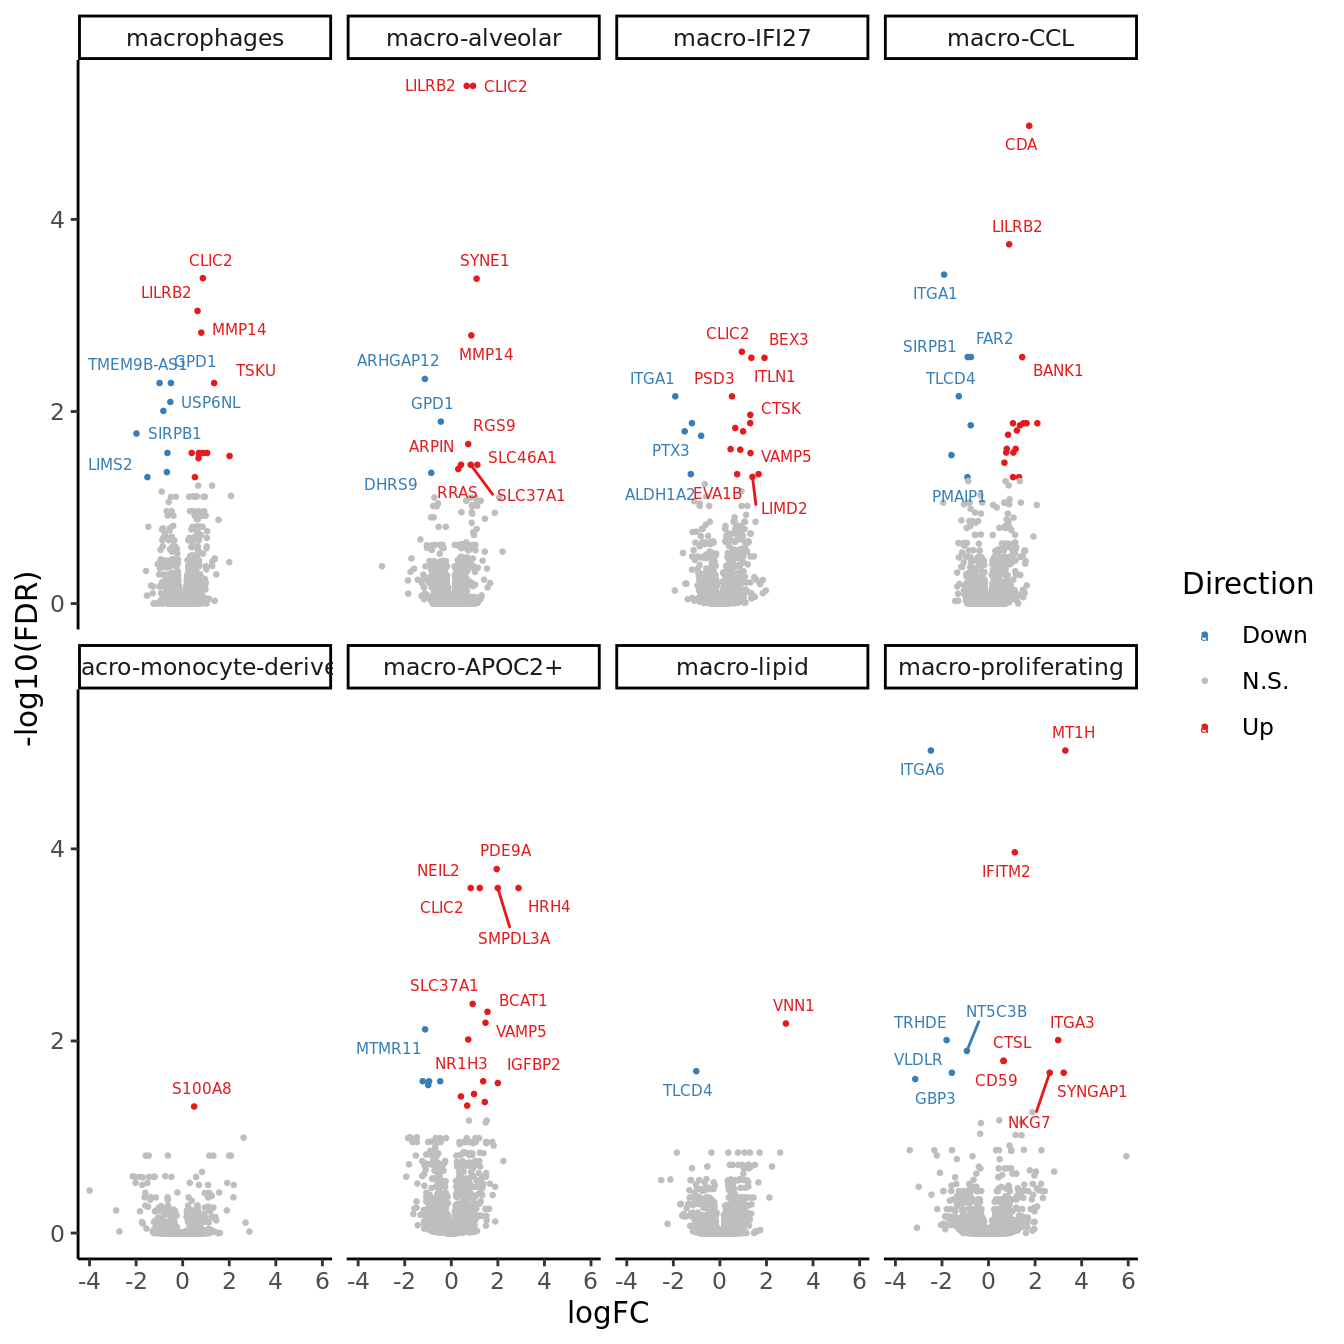
ggsave(here("output/pdf_figures/Figure_4.pdf"),
       plot = p, width = 12, height = 12, units = "in", device = cairo_pdf)
Supplement
dat %>%
  dplyr::select(gene, cell, logFC) %>%
  distinct() %>%
  pivot_wider(
    names_from = cell,        # Column whose values become new column names
    values_from = logFC,
    values_fill = list(logFC = NA)) %>%
   arrange(across(all_of(cell_freq$cell[cell_freq$cell %in% .$cell]))) %>%
  column_to_rownames(var = "gene") -> dat_lfc_supp
col_fun <- circlize::colorRamp2(seq(0, 100000, length.out = 9),
(RColorBrewer::brewer.pal(9, "PiYG")))
col_split <- c(rep("aggregate", 1), rep("sub-type", ncol(dat_lfc_supp) - 1))
col_lfc_fun <- circlize::colorRamp2(seq(-2, 2, length.out = 3),
c(pal_dt[1], "white", pal_dt[2]))
ComplexHeatmap::HeatmapAnnotation(df = cell_freq %>%
dplyr::filter(cell %in% colnames(dat_lfc_supp)) %>%
column_to_rownames(var = "cell") %>%
dplyr::rename(`No. cells` = n),
which = "column",
show_annotation_name = FALSE,
col = list(`No. cells` = col_fun),
annotation_legend_param = list(
`No. cells` = list(direction = "vertical",
labels_gp = grid::gpar(fontsize = 7)))) -> col_ann
ComplexHeatmap::HeatmapAnnotation(df = data.frame(`Sig. ≥2 cell types` = (rowSums(!is.na(dat_lfc_supp)) > 1),
check.names = FALSE),
which = "row",
col = list(`Sig. ≥2 cell types` = c("FALSE" = "#fdcce5","TRUE" = "#8bd3c7")),
annotation_legend_param = list(
`Sig. ≥2 cell types` = list(direction = "vertical",
ncol = 1)),
show_annotation_name = FALSE) -> row_ann
colnames(dat_lfc_supp) <- lab_map[colnames(dat_lfc_supp)]
ComplexHeatmap::Heatmap(dat_lfc_supp,
name = "logFC",
column_split = col_split,
column_title = NULL,
cluster_rows = FALSE,
cluster_columns = FALSE,
rect_gp = grid::gpar(col = "white", lwd = 1),
row_names_gp = grid::gpar(fontsize = 7),
column_names_gp = grid::gpar(fontsize = 8),
column_names_rot = 90,
top_annotation = col_ann,
col = col_lfc_fun,
right_annotation = row_ann,
heatmap_legend_param = list(direction = "vertical",
labels_gp = grid::gpar(fontsize = 7))) -> plot_lfc
ComplexHeatmap::draw(as(list(plot_lfc), "HeatmapList"),
heatmap_legend_side = "right",
annotation_legend_side = "right",
merge_legends = TRUE) -> plot_lfc_supp
| Version | Author | Date |
|---|---|---|
| 1a51c83 | Jovana Maksimovic | 2026-03-23 |
plot_lfc_supp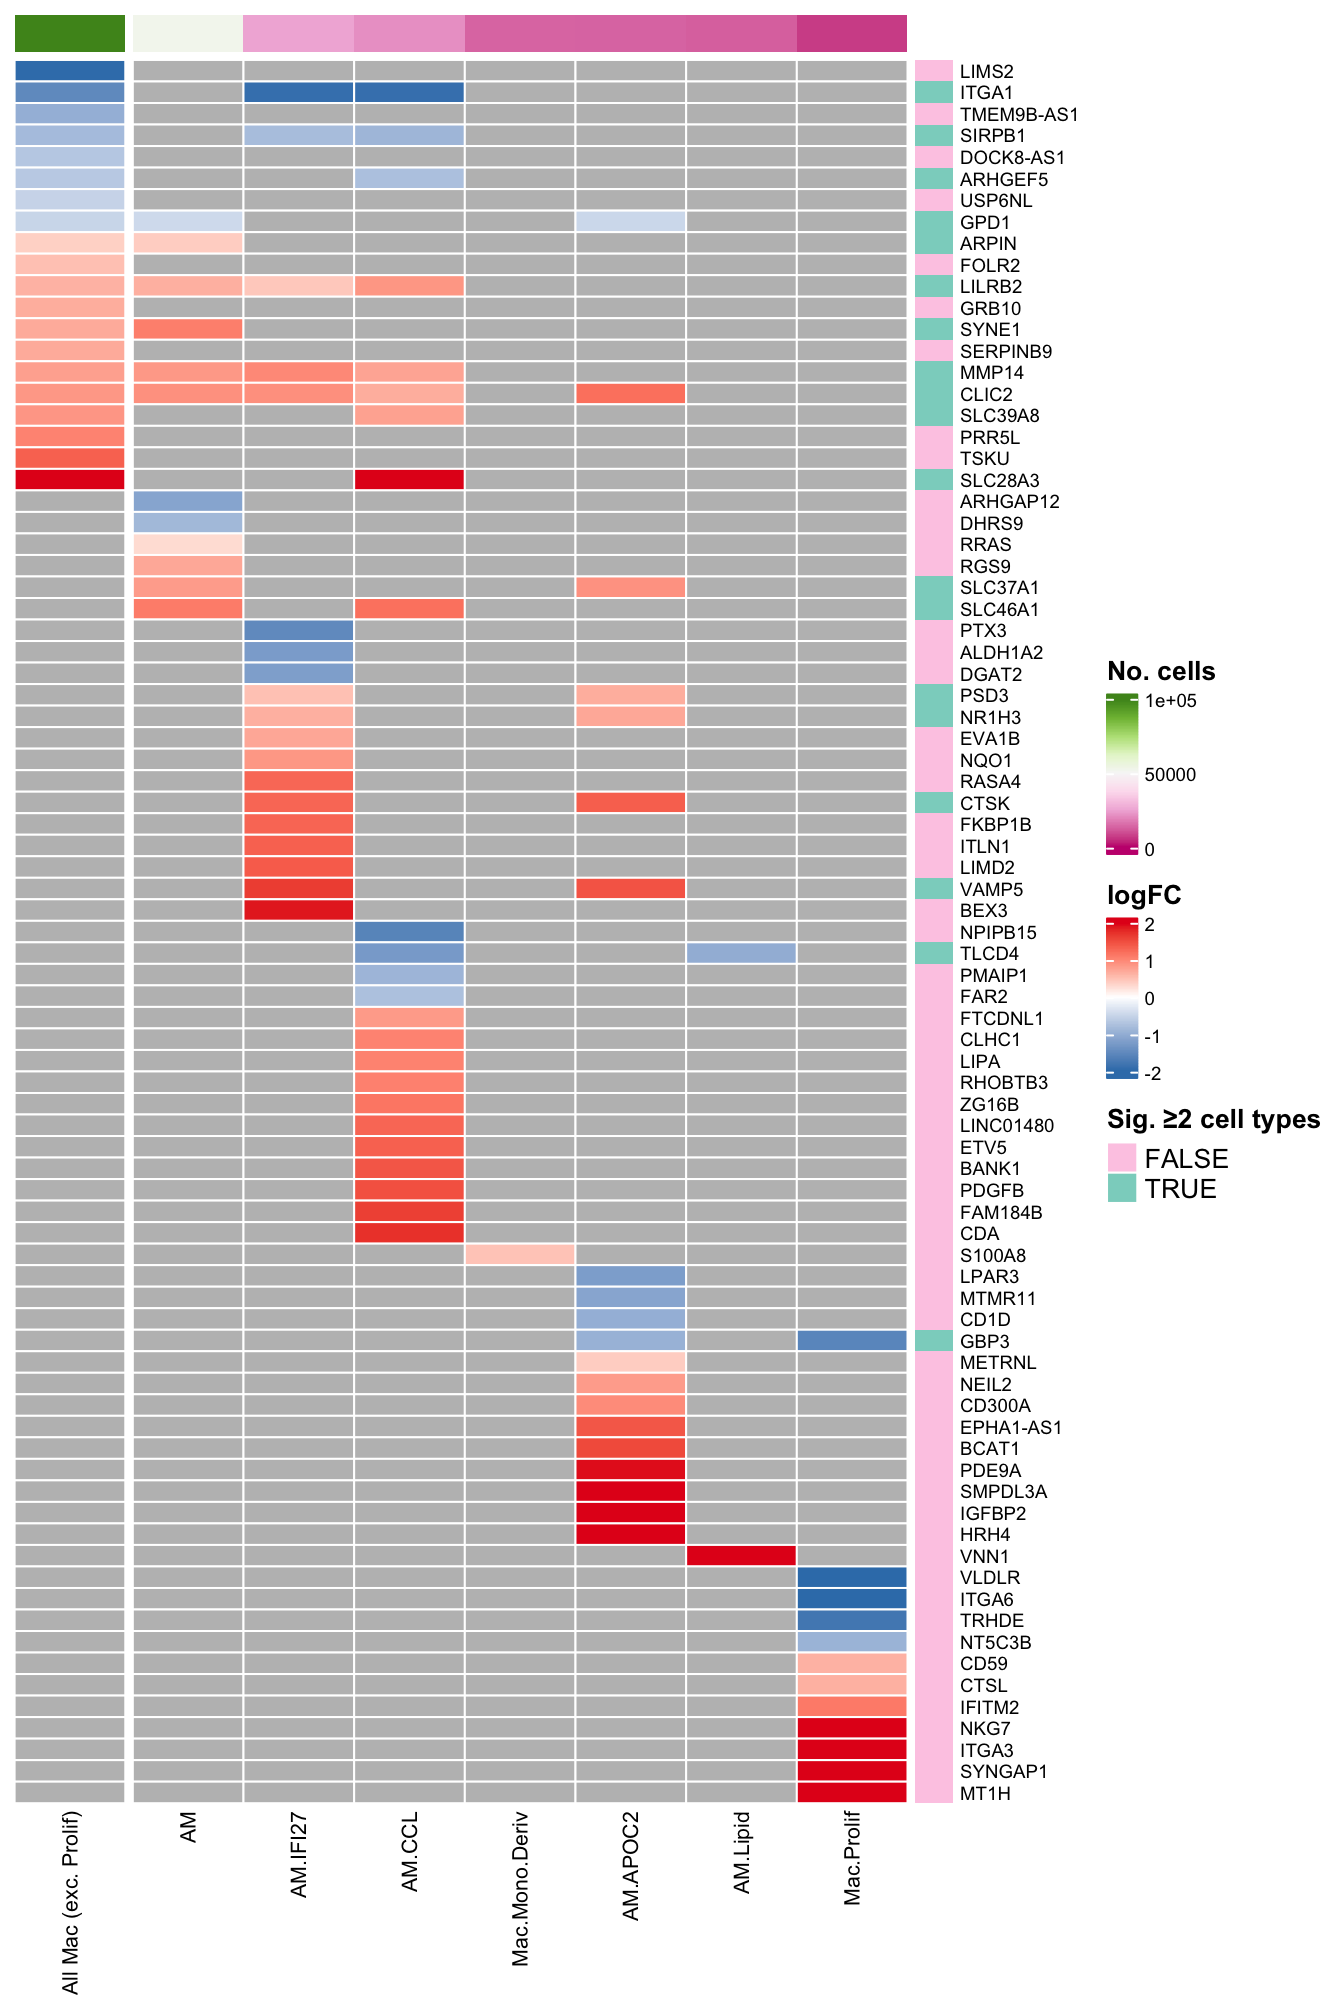
| Version | Author | Date |
|---|---|---|
| 1a51c83 | Jovana Maksimovic | 2026-03-23 |
Session info
sessionInfo()R version 4.3.3 (2024-02-29)
Platform: aarch64-apple-darwin20 (64-bit)
Running under: macOS 15.5
Matrix products: default
BLAS: /Library/Frameworks/R.framework/Versions/4.3-arm64/Resources/lib/libRblas.0.dylib
LAPACK: /Library/Frameworks/R.framework/Versions/4.3-arm64/Resources/lib/libRlapack.dylib; LAPACK version 3.11.0
locale:
[1] en_US.UTF-8/en_US.UTF-8/en_US.UTF-8/C/en_US.UTF-8/en_US.UTF-8
time zone: Australia/Melbourne
tzcode source: internal
attached base packages:
[1] grid stats4 stats graphics grDevices datasets utils
[8] methods base
other attached packages:
[1] circlize_0.4.15 ComplexHeatmap_2.18.0
[3] readxl_1.4.3 ggh4x_0.3.1
[5] dsb_1.0.3 paletteer_1.6.0
[7] tidyHeatmap_1.8.1 speckle_1.2.0
[9] glue_1.8.0 org.Hs.eg.db_3.18.0
[11] AnnotationDbi_1.64.1 patchwork_1.3.1
[13] clustree_0.5.1 ggraph_2.2.0
[15] here_1.0.1 dittoSeq_1.14.2
[17] glmGamPoi_1.14.3 SeuratObject_4.1.4
[19] Seurat_4.4.0 lubridate_1.9.3
[21] forcats_1.0.0 stringr_1.5.1
[23] dplyr_1.1.4 purrr_1.0.2
[25] readr_2.1.5 tidyr_1.3.1
[27] tibble_3.2.1 ggplot2_3.5.2
[29] tidyverse_2.0.0 edgeR_4.0.15
[31] limma_3.58.1 SingleCellExperiment_1.24.0
[33] SummarizedExperiment_1.32.0 Biobase_2.62.0
[35] GenomicRanges_1.54.1 GenomeInfoDb_1.38.6
[37] IRanges_2.36.0 S4Vectors_0.40.2
[39] BiocGenerics_0.48.1 MatrixGenerics_1.14.0
[41] matrixStats_1.2.0 workflowr_1.7.1
loaded via a namespace (and not attached):
[1] fs_1.6.6 spatstat.sparse_3.0-3 bitops_1.0-7
[4] httr_1.4.7 RColorBrewer_1.1-3 doParallel_1.0.17
[7] tools_4.3.3 sctransform_0.4.1 utf8_1.2.4
[10] R6_2.5.1 lazyeval_0.2.2 uwot_0.1.16
[13] GetoptLong_1.0.5 withr_3.0.0 sp_2.1-3
[16] gridExtra_2.3 progressr_0.14.0 cli_3.6.5
[19] Cairo_1.6-2 spatstat.explore_3.2-6 prismatic_1.1.1
[22] labeling_0.4.3 sass_0.4.10 spatstat.data_3.0-4
[25] ggridges_0.5.6 pbapply_1.7-2 parallelly_1.37.0
[28] rstudioapi_0.15.0 RSQLite_2.3.5 generics_0.1.3
[31] shape_1.4.6 ica_1.0-3 spatstat.random_3.2-2
[34] dendextend_1.17.1 Matrix_1.6-5 fansi_1.0.6
[37] abind_1.4-5 lifecycle_1.0.4 whisker_0.4.1
[40] yaml_2.3.8 snakecase_0.11.1 SparseArray_1.2.4
[43] Rtsne_0.17 blob_1.2.4 promises_1.2.1
[46] crayon_1.5.2 miniUI_0.1.1.1 lattice_0.22-5
[49] cowplot_1.1.3 KEGGREST_1.42.0 pillar_1.9.0
[52] knitr_1.50 rjson_0.2.21 future.apply_1.11.1
[55] codetools_0.2-19 leiden_0.4.3.1 getPass_0.2-4
[58] data.table_1.15.0 vctrs_0.6.5 png_0.1-8
[61] cellranger_1.1.0 gtable_0.3.6 rematch2_2.1.2
[64] cachem_1.0.8 xfun_0.52 S4Arrays_1.2.0
[67] mime_0.12 tidygraph_1.3.1 survival_3.5-8
[70] pheatmap_1.0.12 iterators_1.0.14 statmod_1.5.0
[73] ellipsis_0.3.2 fitdistrplus_1.1-11 ROCR_1.0-11
[76] nlme_3.1-164 bit64_4.0.5 RcppAnnoy_0.0.22
[79] rprojroot_2.0.4 bslib_0.6.1 irlba_2.3.5.1
[82] KernSmooth_2.23-22 colorspace_2.1-0 DBI_1.2.1
[85] tidyselect_1.2.1 processx_3.8.3 bit_4.0.5
[88] compiler_4.3.3 git2r_0.33.0 DelayedArray_0.28.0
[91] plotly_4.10.4 scales_1.3.0 lmtest_0.9-40
[94] callr_3.7.3 digest_0.6.34 goftest_1.2-3
[97] spatstat.utils_3.0-4 rmarkdown_2.29 XVector_0.42.0
[100] htmltools_0.5.8.1 pkgconfig_2.0.3 fastmap_1.1.1
[103] rlang_1.1.6 GlobalOptions_0.1.2 htmlwidgets_1.6.4
[106] shiny_1.8.0 farver_2.1.1 jquerylib_0.1.4
[109] zoo_1.8-12 jsonlite_1.8.8 mclust_6.1
[112] RCurl_1.98-1.14 magrittr_2.0.3 GenomeInfoDbData_1.2.11
[115] munsell_0.5.0 Rcpp_1.0.12 viridis_0.6.5
[118] reticulate_1.42.0 stringi_1.8.3 zlibbioc_1.48.0
[121] MASS_7.3-60.0.1 plyr_1.8.9 parallel_4.3.3
[124] listenv_0.9.1 ggrepel_0.9.5 deldir_2.0-2
[127] Biostrings_2.70.2 graphlayouts_1.1.0 splines_4.3.3
[130] tensor_1.5 hms_1.1.3 locfit_1.5-9.8
[133] ps_1.7.6 igraph_2.0.1.1 spatstat.geom_3.2-8
[136] reshape2_1.4.4 evaluate_0.23 renv_1.1.4
[139] BiocManager_1.30.22 tzdb_0.4.0 foreach_1.5.2
[142] tweenr_2.0.3 httpuv_1.6.14 RANN_2.6.1
[145] polyclip_1.10-6 future_1.33.1 clue_0.3-65
[148] scattermore_1.2 ggforce_0.4.2 janitor_2.2.0
[151] xtable_1.8-4 later_1.3.2 viridisLite_0.4.2
[154] memoise_2.0.1 cluster_2.1.6 timechange_0.3.0
[157] globals_0.16.2