barbieQ_paper Supplementary 1:
Preprocessing AML data
Liyang Fei
Initiated: 2025-04-03
Rendered: 2026-01-06
Last updated: 2026-01-06
Checks: 5 2
Knit directory: public_barcode_count/
This reproducible R Markdown analysis was created with workflowr (version 1.7.2). The Checks tab describes the reproducibility checks that were applied when the results were created. The Past versions tab lists the development history.
The R Markdown is untracked by Git. To know which version of the R
Markdown file created these results, you’ll want to first commit it to
the Git repo. If you’re still working on the analysis, you can ignore
this warning. When you’re finished, you can run
wflow_publish to commit the R Markdown file and build the
HTML.
The global environment had objects present when the code in the R
Markdown file was run. These objects can affect the analysis in your R
Markdown file in unknown ways. For reproduciblity it’s best to always
run the code in an empty environment. Use wflow_publish or
wflow_build to ensure that the code is always run in an
empty environment.
The following objects were defined in the global environment when these results were created:
| Name | Class | Size |
|---|---|---|
| module | function | 5.6 Kb |
The command set.seed(20250112) was run prior to running
the code in the R Markdown file. Setting a seed ensures that any results
that rely on randomness, e.g. subsampling or permutations, are
reproducible.
Great job! Recording the operating system, R version, and package versions is critical for reproducibility.
Nice! There were no cached chunks for this analysis, so you can be confident that you successfully produced the results during this run.
Great job! Using relative paths to the files within your workflowr project makes it easier to run your code on other machines.
Great! You are using Git for version control. Tracking code development and connecting the code version to the results is critical for reproducibility.
The results in this page were generated with repository version 34f5894. See the Past versions tab to see a history of the changes made to the R Markdown and HTML files.
Note that you need to be careful to ensure that all relevant files for
the analysis have been committed to Git prior to generating the results
(you can use wflow_publish or
wflow_git_commit). workflowr only checks the R Markdown
file, but you know if there are other scripts or data files that it
depends on. Below is the status of the Git repository when the results
were generated:
Ignored files:
    Ignored:    .RData
    Ignored:    .Rhistory
    Ignored:    .Rproj.user/
    Ignored:    public_barcode_count.Rproj

Untracked files:
    Untracked:  analysis/barbieQ_paper_FigureS1_AML.Rmd
    Untracked:  analysis/barbieQ_paper_FigureS1_Mixture.Rmd
    Untracked:  analysis/barbieQ_paper_FigureS1_xenoHSPC.Rmd
    Untracked:  output/AML_barbieQ.rda
    Untracked:  output/fs1_aml.png
    Untracked:  output/fs1_mixture.png
    Untracked:  output/fs1_xeno.png
    Untracked:  output/fs1a_knowncluster.png
    Untracked:  output/xenoHSPC_barbieQ.rda

Unstaged changes:
    Modified:   analysis/barbieQ_paper_Figure2.Rmd
    Deleted:    analysis/barbieQ_paper_S1.Rmd
    Modified:   analysis/index.Rmd
    Modified:   data/BelderbosME/README.md
    Modified:   output/f2.png
    Modified:   output/monkeyHSPC_barbieQ.rda
    Modified:   output/monkeyHSPC_raw_barbieQ.rda
Note that any generated files, e.g. HTML, png, CSS, etc., are not included in this status report because it is ok for generated content to have uncommitted changes.
There are no past versions. Publish this analysis with
wflow_publish() to start tracking its development.
Links to preprocessing other datasets in the barbieQ paper:
1 Load Dependencies
library(readxl)
library(magrittr)
library(dplyr)
Attaching package: 'dplyr'The following objects are masked from 'package:stats':
filter, lagThe following objects are masked from 'package:base':
intersect, setdiff, setequal, unionlibrary(tidyr) # for pivot_longer
Attaching package: 'tidyr'The following object is masked from 'package:magrittr':
extractlibrary(tibble) # for rownames_to _column
library(knitr) # for kable()
library(ggplot2)
library(patchwork)
library(scales)
library(ggVennDiagram)
Attaching package: 'ggVennDiagram'The following object is masked from 'package:tidyr':
unitelibrary(ComplexHeatmap)Loading required package: grid========================================
ComplexHeatmap version 2.24.1
Bioconductor page: http://bioconductor.org/packages/ComplexHeatmap/
Github page: https://github.com/jokergoo/ComplexHeatmap
Documentation: http://jokergoo.github.io/ComplexHeatmap-reference
If you use it in published research, please cite either one:
- Gu, Z. Complex Heatmap Visualization. iMeta 2022.
- Gu, Z. Complex heatmaps reveal patterns and correlations in multidimensional
genomic data. Bioinformatics 2016.
The new InteractiveComplexHeatmap package can directly export static
complex heatmaps into an interactive Shiny app with zero effort. Have a try!
This message can be suppressed by:
suppressPackageStartupMessages(library(ComplexHeatmap))
========================================library(limma)
library(edgeR)
library(SummarizedExperiment)Loading required package: MatrixGenericsLoading required package: matrixStats
Attaching package: 'matrixStats'The following object is masked from 'package:dplyr':
count
Attaching package: 'MatrixGenerics'The following objects are masked from 'package:matrixStats':
colAlls, colAnyNAs, colAnys, colAvgsPerRowSet, colCollapse,
colCounts, colCummaxs, colCummins, colCumprods, colCumsums,
colDiffs, colIQRDiffs, colIQRs, colLogSumExps, colMadDiffs,
colMads, colMaxs, colMeans2, colMedians, colMins, colOrderStats,
colProds, colQuantiles, colRanges, colRanks, colSdDiffs, colSds,
colSums2, colTabulates, colVarDiffs, colVars, colWeightedMads,
colWeightedMeans, colWeightedMedians, colWeightedSds,
colWeightedVars, rowAlls, rowAnyNAs, rowAnys, rowAvgsPerColSet,
rowCollapse, rowCounts, rowCummaxs, rowCummins, rowCumprods,
rowCumsums, rowDiffs, rowIQRDiffs, rowIQRs, rowLogSumExps,
rowMadDiffs, rowMads, rowMaxs, rowMeans2, rowMedians, rowMins,
rowOrderStats, rowProds, rowQuantiles, rowRanges, rowRanks,
rowSdDiffs, rowSds, rowSums2, rowTabulates, rowVarDiffs, rowVars,
rowWeightedMads, rowWeightedMeans, rowWeightedMedians,
rowWeightedSds, rowWeightedVarsLoading required package: GenomicRangesLoading required package: stats4Loading required package: BiocGenericsLoading required package: generics
Attaching package: 'generics'The following object is masked from 'package:dplyr':
explainThe following objects are masked from 'package:base':
as.difftime, as.factor, as.ordered, intersect, is.element, setdiff,
setequal, union
Attaching package: 'BiocGenerics'The following object is masked from 'package:limma':
plotMAThe following object is masked from 'package:dplyr':
combineThe following objects are masked from 'package:stats':
IQR, mad, sd, var, xtabsThe following objects are masked from 'package:base':
anyDuplicated, aperm, append, as.data.frame, basename, cbind,
colnames, dirname, do.call, duplicated, eval, evalq, Filter, Find,
get, grep, grepl, is.unsorted, lapply, Map, mapply, match, mget,
order, paste, pmax, pmax.int, pmin, pmin.int, Position, rank,
rbind, Reduce, rownames, sapply, saveRDS, table, tapply, unique,
unsplit, which.max, which.minLoading required package: S4Vectors
Attaching package: 'S4Vectors'The following object is masked from 'package:tidyr':
expandThe following objects are masked from 'package:dplyr':
first, renameThe following object is masked from 'package:utils':
findMatchesThe following objects are masked from 'package:base':
expand.grid, I, unnameLoading required package: IRanges
Attaching package: 'IRanges'The following objects are masked from 'package:dplyr':
collapse, desc, sliceLoading required package: GenomeInfoDb
Attaching package: 'GenomicRanges'The following object is masked from 'package:magrittr':
subtractLoading required package: BiobaseWelcome to Bioconductor
Vignettes contain introductory material; view with
'browseVignettes()'. To cite Bioconductor, see
'citation("Biobase")', and for packages 'citation("pkgname")'.
Attaching package: 'Biobase'The following object is masked from 'package:MatrixGenerics':
rowMediansThe following objects are masked from 'package:matrixStats':
anyMissing, rowMedianslibrary(SEtools) # for aggregate SELoading required package: sechm
Attaching package: 'SEtools'The following object is masked from 'package:sechm':
log2FClibrary(S4Vectors)
library(devtools)Loading required package: usethissource("analysis/plotBarcodeHistogram.R") ## accommodated from bartools::plotBarcodehistogram
source("analysis/ggplot_theme.R") ## setting ggplot theme2 Install
barbieQ
Installing the latest devel version of barbieQ from
GitHub.
if (!requireNamespace("barbieQ", quietly = TRUE)) {
  remotes::install_github("Oshlack/barbieQ")
}
Warning: replacing previous import 'data.table::first' by 'dplyr::first' when
loading 'barbieQ'Warning: replacing previous import 'data.table::last' by 'dplyr::last' when
loading 'barbieQ'Warning: replacing previous import 'data.table::between' by 'dplyr::between'
when loading 'barbieQ'Warning: replacing previous import 'dplyr::as_data_frame' by
'igraph::as_data_frame' when loading 'barbieQ'Warning: replacing previous import 'dplyr::groups' by 'igraph::groups' when
loading 'barbieQ'Warning: replacing previous import 'dplyr::union' by 'igraph::union' when
loading 'barbieQ'Registered S3 method overwritten by 'formula.tools':
method from
as.character.formula openxlsxlibrary(barbieQ)Check the version of barbieQ.
packageVersion("barbieQ")[1] '1.1.3'3 Set seeds
set.seed(2025)4 Read data
Sourced from: (https://zenodo.org/badge/713176761.svg)
dge <- readRDS("data/bartools_dose_escalation/dose2.rds")

# simplify barcode labels
rownames(dge) <- gsub("BFP_Barcode", "BC", rownames(dge))
5 Save to a barbieQ obejct
## check sample metadata
# dge$samples$Treatment %>% table()
# dge$samples %>% class()
# lapply(dge$samples, function (j) {table(j)})
AML <- barbieQ::createBarbieQ(
object = dge$counts,
sampleMetadata = dge$samples[, c("Treatment", "Strategy", "Technical_Replicate", "Dose", "Timepoint")])continuing with missing `factorColors`.metadata(AML)<- list(
"Experiment" = "Dose_escalation_2",
"Celltype" = "MLL-AF9",
"Library" = "SPLINTR_BFP_V1"
)6 Tag top barcodes
dim(AML)[1] 1811 41colData(AML)$sampleMetadataDataFrame with 41 rows and 5 columns
Treatment Strategy Technical_Replicate Dose
<character> <character> <character> <character>
ARAC_gradual_TR1_TP1 ARAC gradual TR1 300nM
ARAC_gradual_TR1_TP3 ARAC gradual TR1 300nM
ARAC_gradual_TR1_TP4 ARAC gradual TR1 500nM
ARAC_gradual_TR1_TP5 ARAC gradual TR1 500nM
ARAC_gradual_TR2_TP1 ARAC gradual TR2 300nM
... ... ... ... ...
IBET_high_dose_TR2_TP1 IBET high_dose TR2 800nM
IBET_high_dose_TR2_TP2 IBET high_dose TR2 800nM
IBET_high_dose_TR2_TP3 IBET high_dose TR2 800nM
IBET_high_dose_TR2_TP5 IBET high_dose TR2 800nM
TP0 TP0 TP0 TR1 NA
Timepoint
<character>
ARAC_gradual_TR1_TP1 TP1
ARAC_gradual_TR1_TP3 TP3
ARAC_gradual_TR1_TP4 TP4
ARAC_gradual_TR1_TP5 TP5
ARAC_gradual_TR2_TP1 TP1
... ...
IBET_high_dose_TR2_TP1 TP1
IBET_high_dose_TR2_TP2 TP2
IBET_high_dose_TR2_TP3 TP3
IBET_high_dose_TR2_TP5 TP5
TP0 TP0## find minimum group size
targets <- as.data.frame(AML$sampleMetadata) %>%
mutate(Group = paste0(Treatment, Strategy, Dose))
targets$Group %>% table().
ARACgradual300nM ARACgradual500nM ARAChigh_dose700nM DMSODMSO0.10%
4 4 4 10
IBETgradual1000nM IBETgradual400nM IBETgradual600nM IBETgradual800nM
2 2 2 4
IBEThigh_dose800nM TP0TP0NA
8 1 ## select sample to consider, exclude TP0 when tagging
AML <- barbieQ::tagTopBarcodes(
barbieQ = AML,
activeSamples = AML$sampleMetadata$Treatment != "TP0",
nSampleThreshold = 2
)
rowData(AML)$isTopBarcode$isTop %>% table().
FALSE TRUE
377 1434 barbieQ::plotBarcodePareto(barbieQ = AML)Warning: Removed 10 rows containing missing values or values outside the scale range
(`geom_bar()`).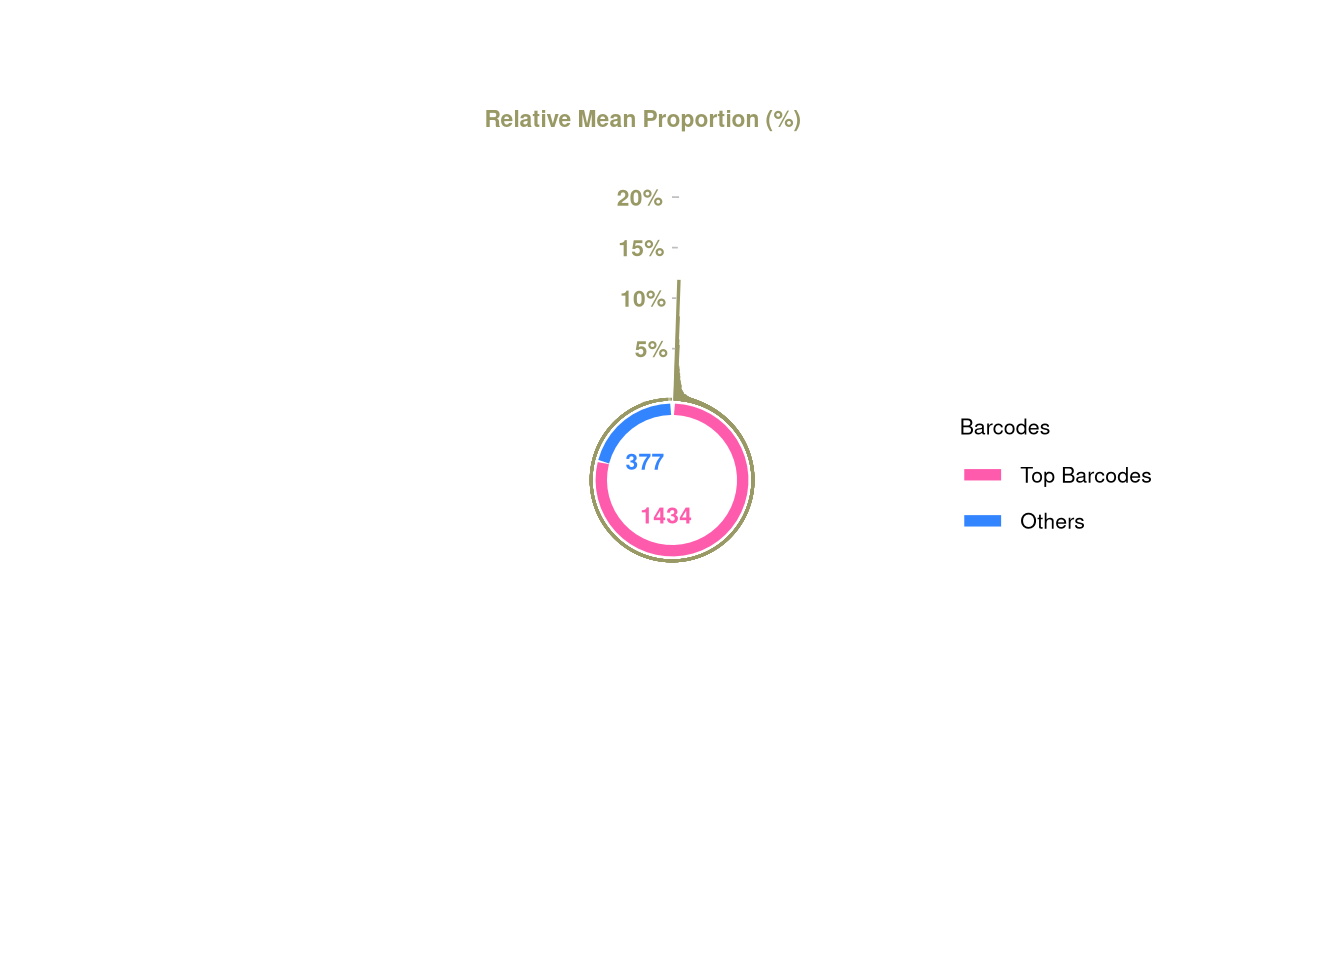
barbieQ::plotBarcodeSankey(barbieQ = AML)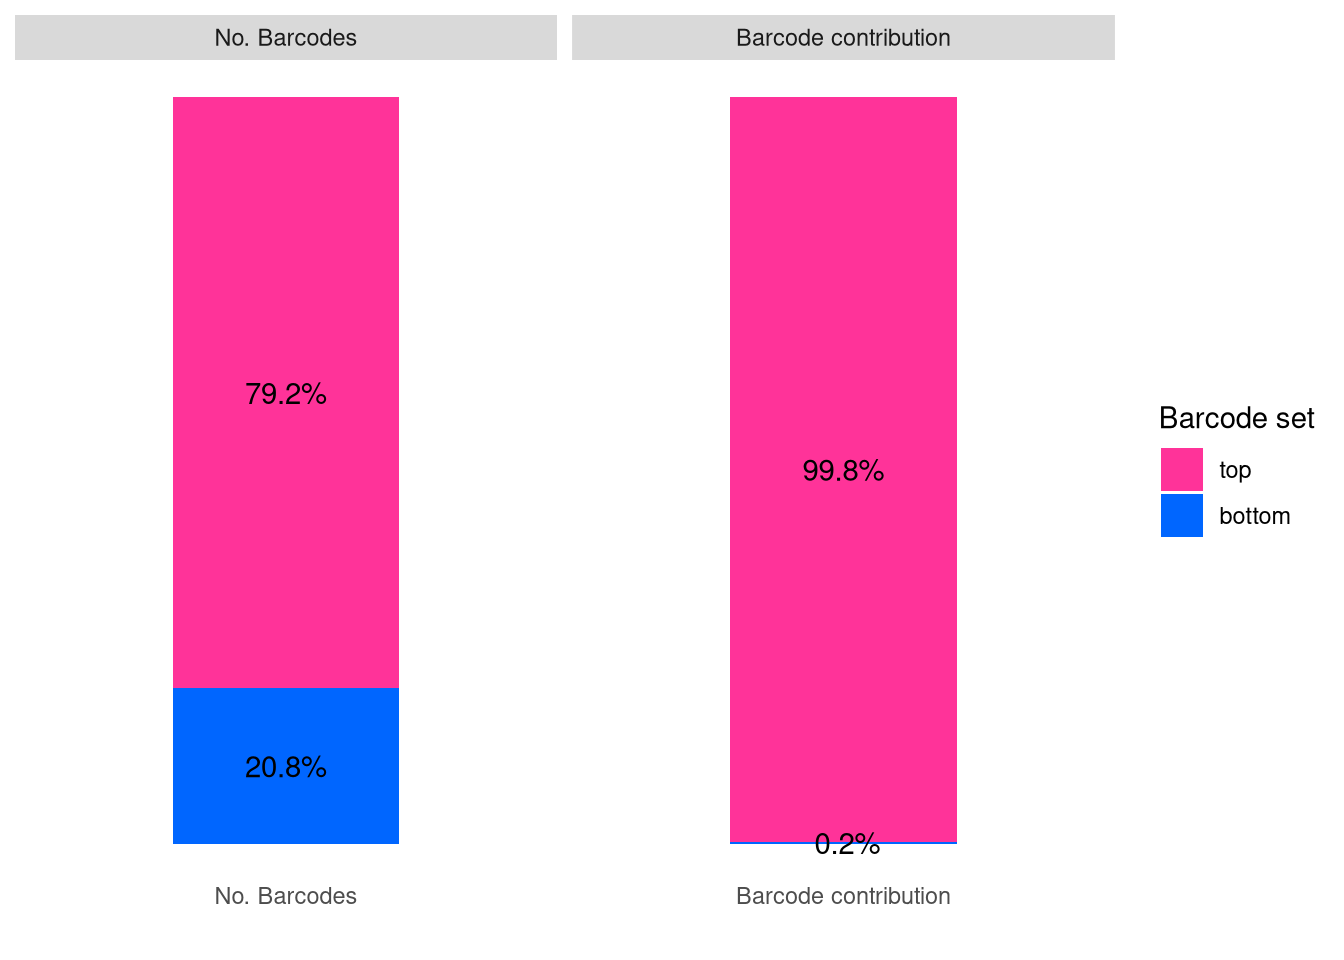
7 Cluster barcodes
7.1 FS1B: pairwise correlation
barbieQ::plotBarcodePairCorrelation(barbieQ = AML, propThresh = 0.005, transformation = "none") +
  theme(legend.position = "top") +
  labs(title = "AML data") -> fs1b
processing Barcode pairwise pearson correlation on propotion (none transformation).fs1bWarning: The dot-dot notation (`..y..`) was deprecated in ggplot2 3.4.0.
ℹ Please use `after_stat(y)` instead.
ℹ The deprecated feature was likely used in the barbieQ package.
Please report the issue at <https://github.com/Oshlack/barbieQ>.
This warning is displayed once every 8 hours.
Call `lifecycle::last_lifecycle_warnings()` to see where this warning was
generated.Warning: Removed 2 rows containing missing values or values outside the scale range
(`geom_bar()`).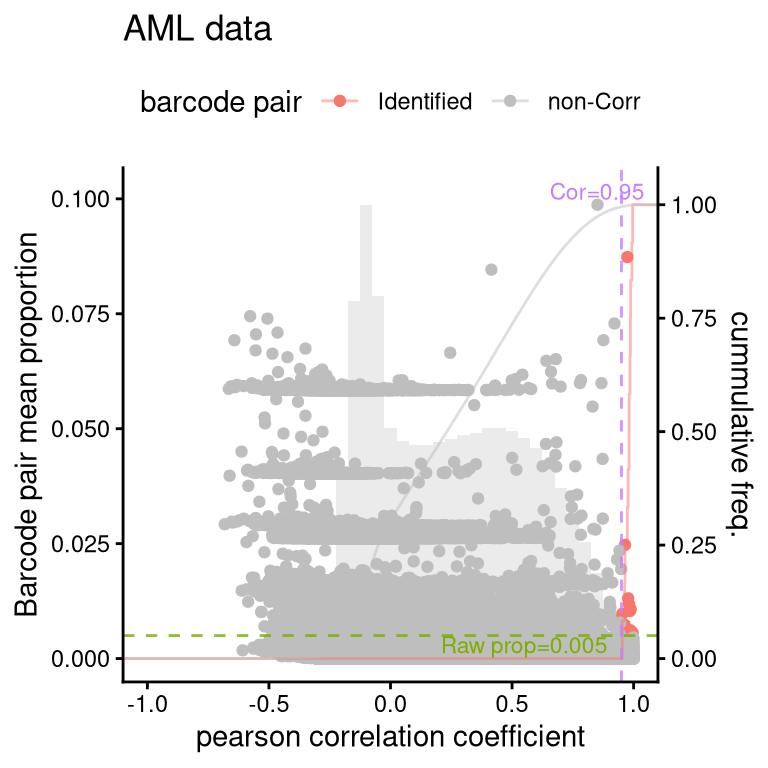
7.2 FS1E: clusters barcodes
## cluster barcoes
AML <- barbieQ::clusterCorrelatingBarcodes(barbieQ = AML, propThresh = 0.005, transformation = "none")
processing Barcode pairwise pearson correlation on propotion (none transformation).identified 7 clusters, including 18 Barcodes.p_cluster_list <- barbieQ::inspectCorrelatingBarcodes(AML)
p_cluster_list$p_cluster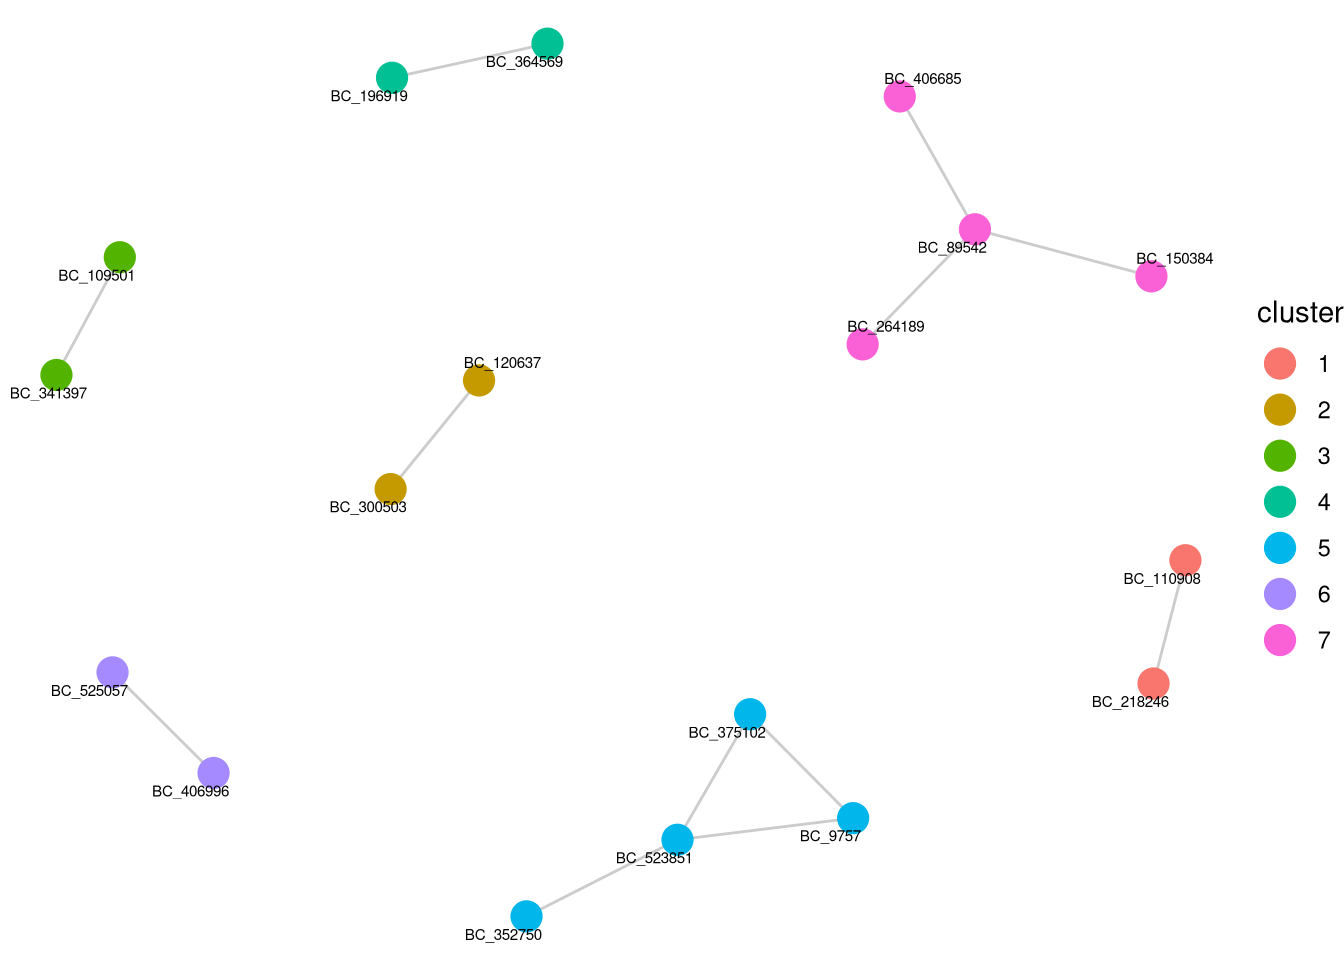
$p_cluster_size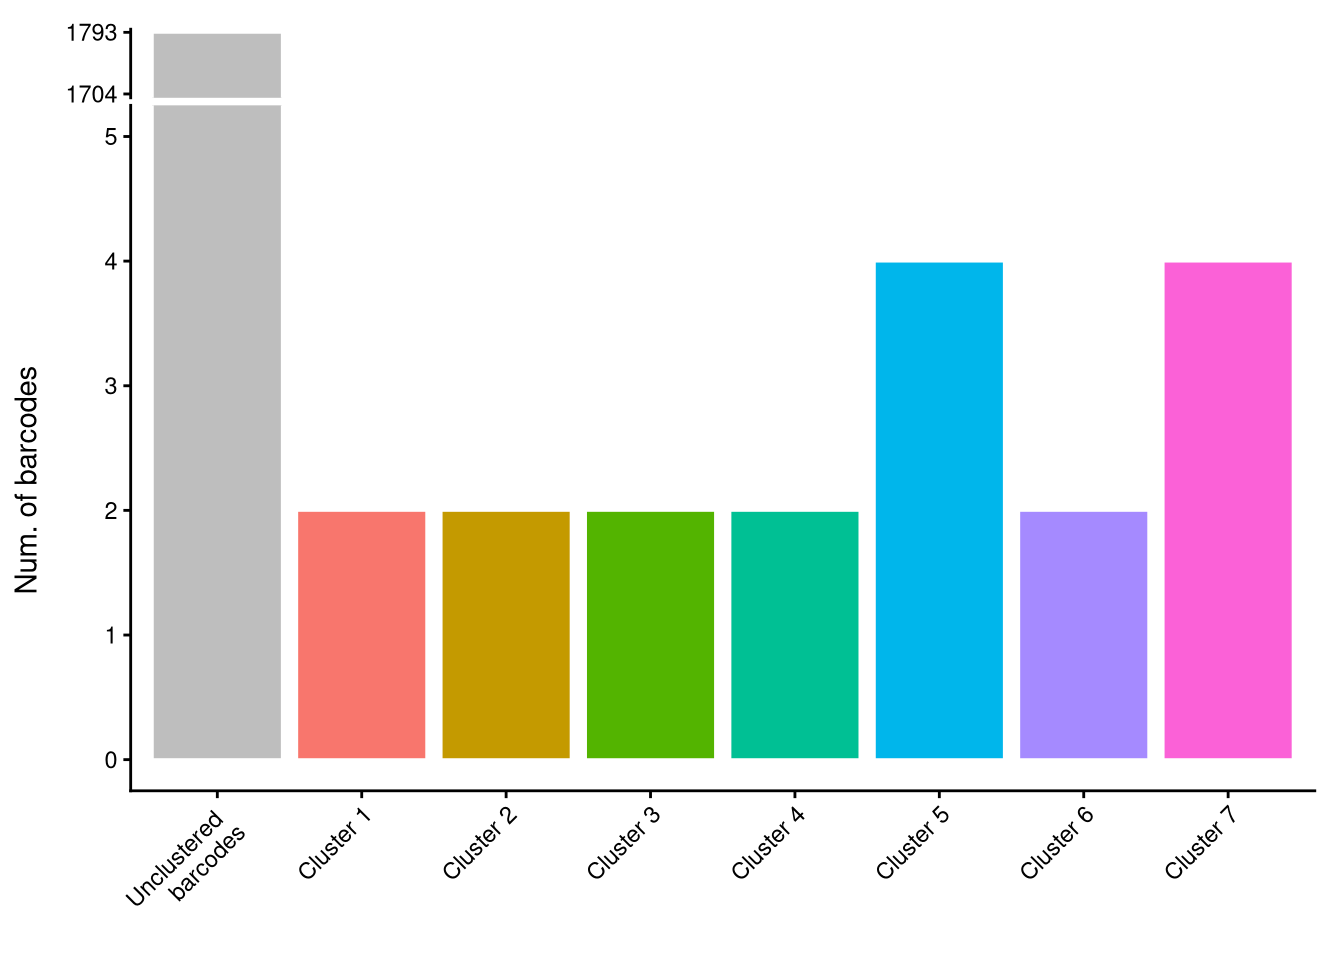
$p_cluster_prop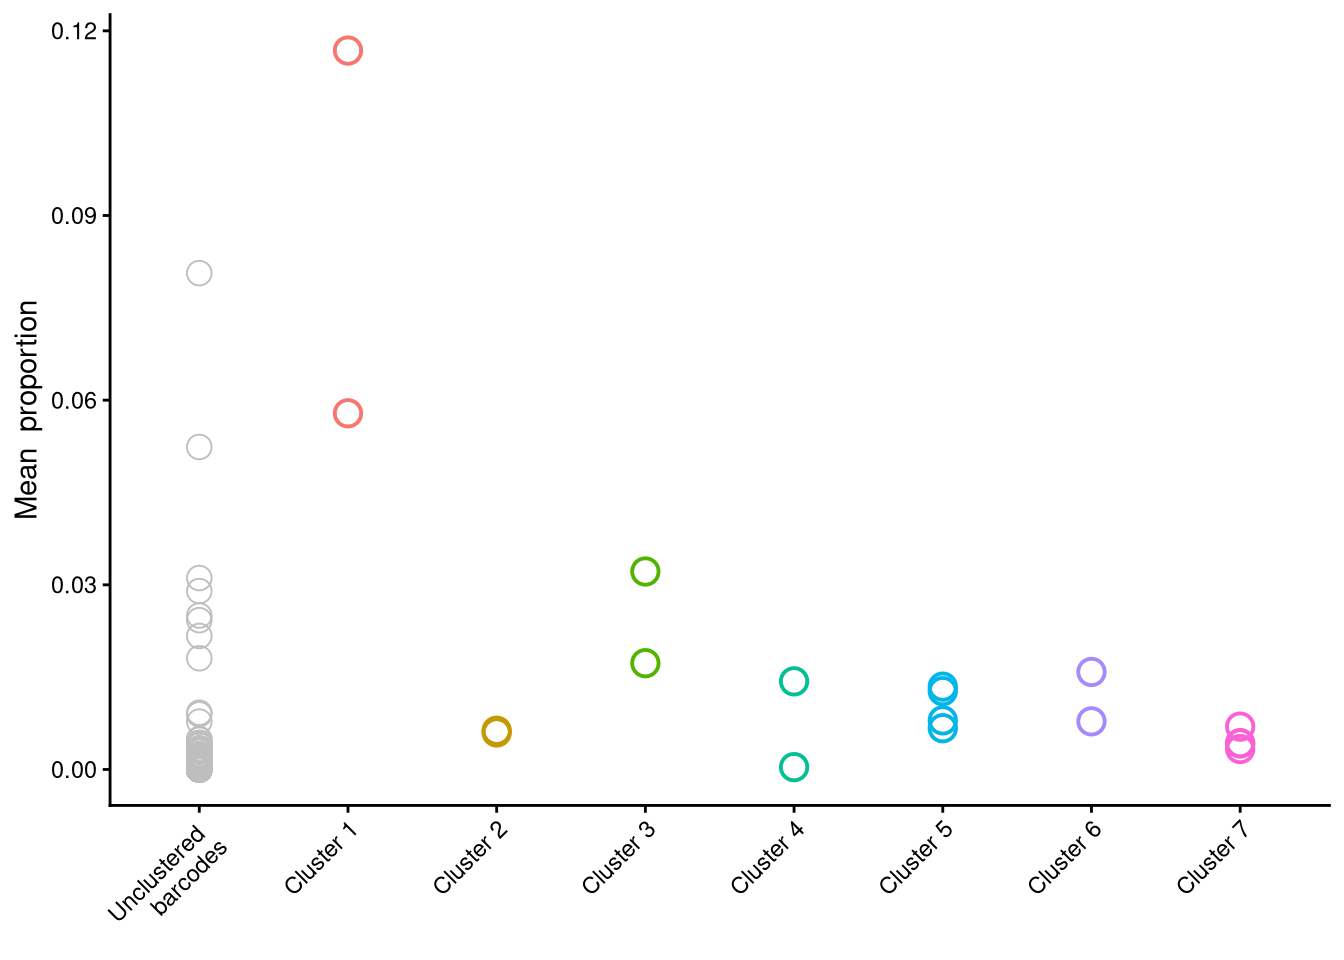
layer_index <- which(sapply(p_cluster_list$p_cluster$layers, function(x) inherits(x$geom, "GeomTextRepel")))
## update the size for that layer
p_cluster_list$p_cluster$layers[[layer_index]]$aes_params$size <- 1.4  # new size
fs1e <- p_cluster_list$p_cluster + theme(legend.position = "none")

fs1e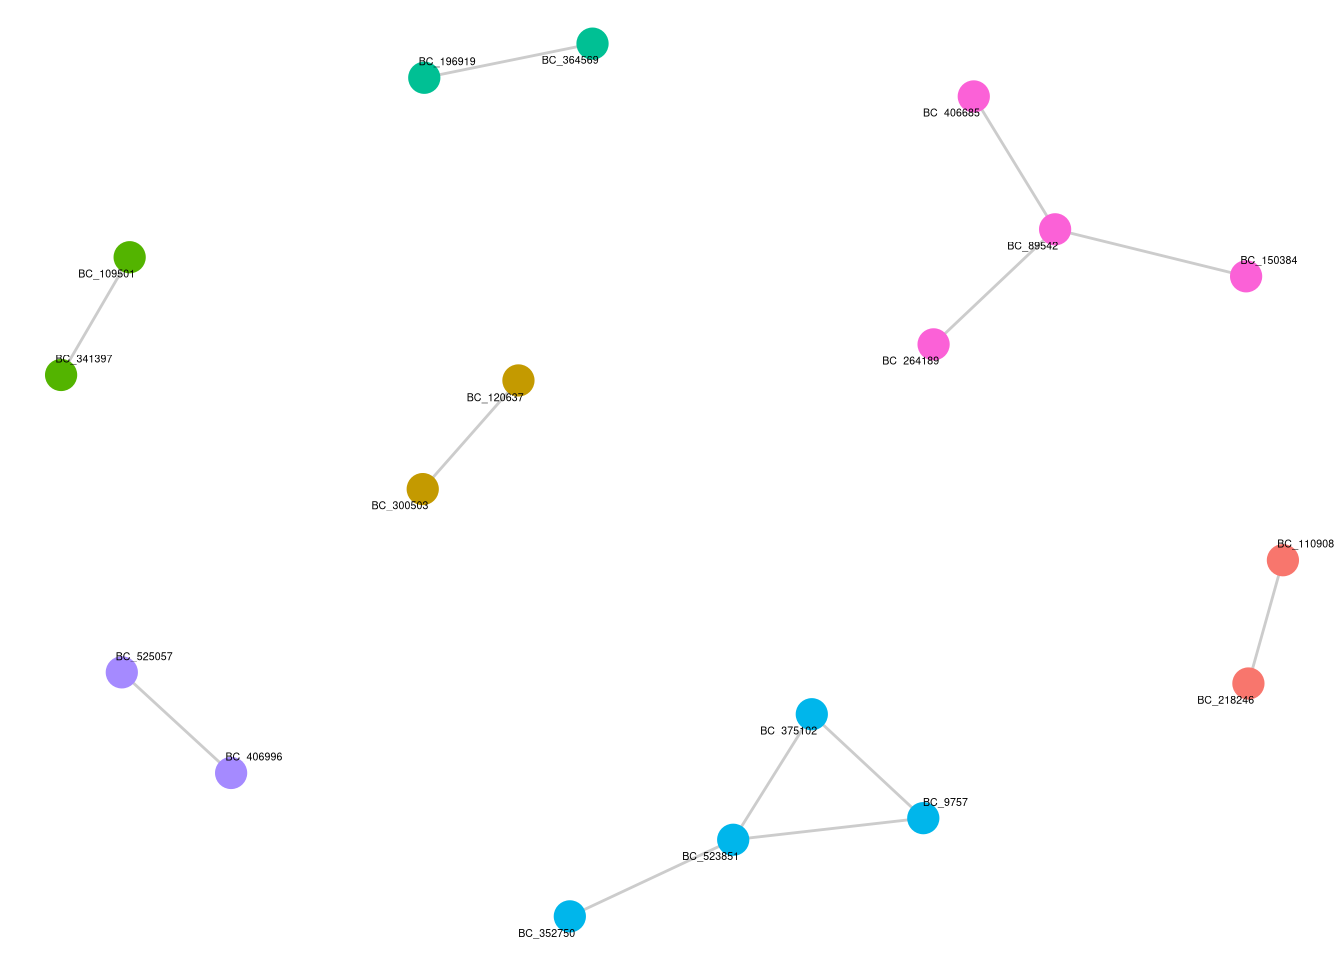
7.3 merge clusters
AML_merged <- barbieQ::mergeCorrelatingBarcodes(barbieQ_clustered = AML) [1] "printing removed barcodes: BC_109501"
[2] "printing removed barcodes: BC_110908"
[3] "printing removed barcodes: BC_150384"
[4] "printing removed barcodes: BC_264189"
[5] "printing removed barcodes: BC_300503"
[6] "printing removed barcodes: BC_352750"
[7] "printing removed barcodes: BC_364569"
[8] "printing removed barcodes: BC_406685"
[9] "printing removed barcodes: BC_406996"
[10] "printing removed barcodes: BC_523851"
[11] "printing removed barcodes: BC_9757" continuing with missing `factorColors`.!! re-computing barcode proportion, CPM, rank... from the selected barcodes.dim(AML_merged)[1] 1800 41AML_merged@metadata$predicted_barcode_clustersIGRAPH 42af7e9 UN-- 18 12 --
+ attr: name (v/c)
+ edges from 42af7e9 (vertex names):
[1] BC_110908--BC_218246 BC_120637--BC_300503 BC_109501--BC_341397
[4] BC_196919--BC_364569 BC_352750--BC_523851 BC_523851--BC_375102
[7] BC_406996--BC_525057 BC_150384--BC_89542 BC_89542 --BC_264189
[10] BC_89542 --BC_406685 BC_375102--BC_9757 BC_523851--BC_9757 AML_merged@metadata$removed_barcodes [1] "BC_109501" "BC_110908" "BC_150384" "BC_264189" "BC_300503" "BC_352750"
[7] "BC_364569" "BC_406685" "BC_406996" "BC_523851" "BC_9757" 8 Tag top barcode after collapsing
8.1 FS1G,J: inspect top/bottom
AML_merged <- tagTopBarcodes(
  barbieQ = AML_merged,
  activeSamples = AML_merged$sampleMetadata$Treatment != "TP0",
  nSampleThreshold = 2)

barbieQ::plotBarcodePareto(barbieQ = AML_merged) +
  ylim(-8, 17) +
  annotate("text", x = c(pi * 0.05), y = c(17),
           label = c("Relative proportion %"), color = "#999966",
           size = 3, angle = 0, fontface = "bold", hjust = 1) -> fs1g
Scale for y is already present.
Adding another scale for y, which will replace the existing scale.fs1gWarning: Removed 10 rows containing missing values or values outside the scale range
(`geom_bar()`).Warning: Removed 1 row containing missing values or values outside the scale range
(`geom_segment()`).Warning: Removed 2 rows containing missing values or values outside the scale range
(`geom_text()`).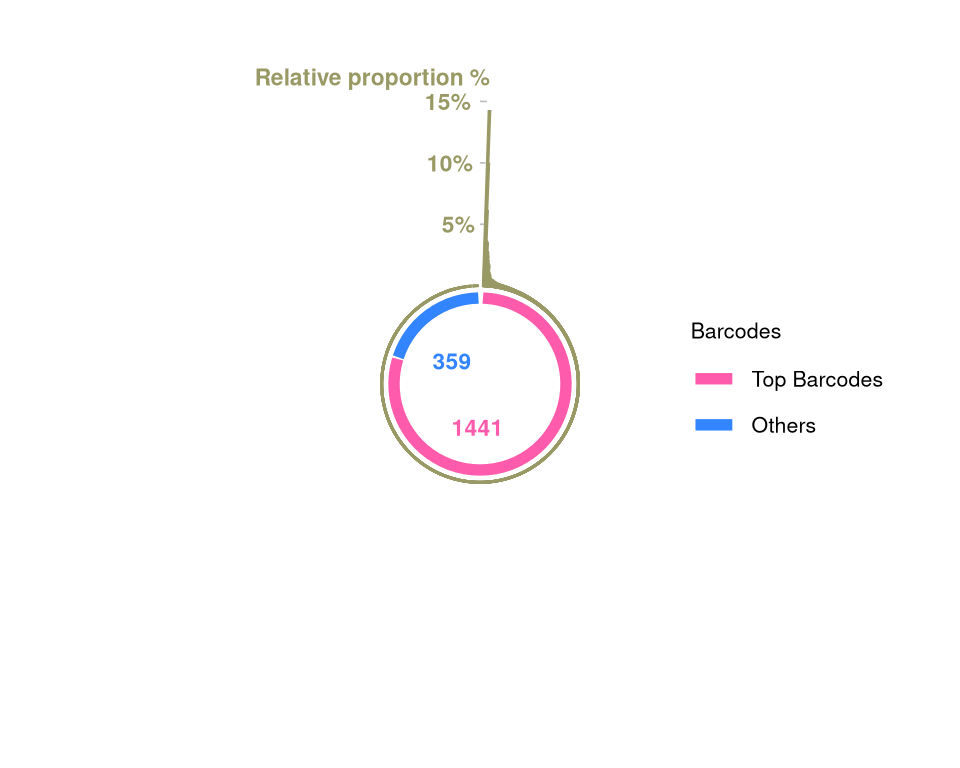
barbieQ::plotBarcodeSankey(barbieQ = AML_merged) +
  theme(legend.position = "top")  -> fs1j

fs1j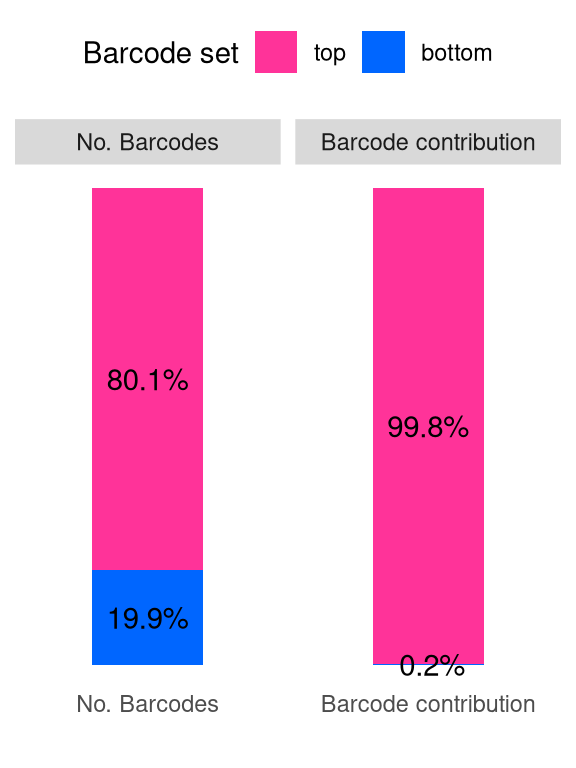
8.2 Filter “top” barcodes
AML_top <- AML_merged[rowData(AML_merged)$isTopBarcode$isTop,]8.3 Heatmap
## pre-filtering
Heatmap(name = "asin-sqrt prop.",
  matrix = asin(sqrt(assays(AML_merged)$proportion)),
  row_title = paste0(nrow(AML_merged), " Barcodes"),
  show_row_names = FALSE, show_column_names = FALSE)
The automatically generated colors map from the 1^st and 99^th of the
values in the matrix. There are outliers in the matrix whose patterns
might be hidden by this color mapping. You can manually set the color
to `col` argument.
Use `suppressMessages()` to turn off this message.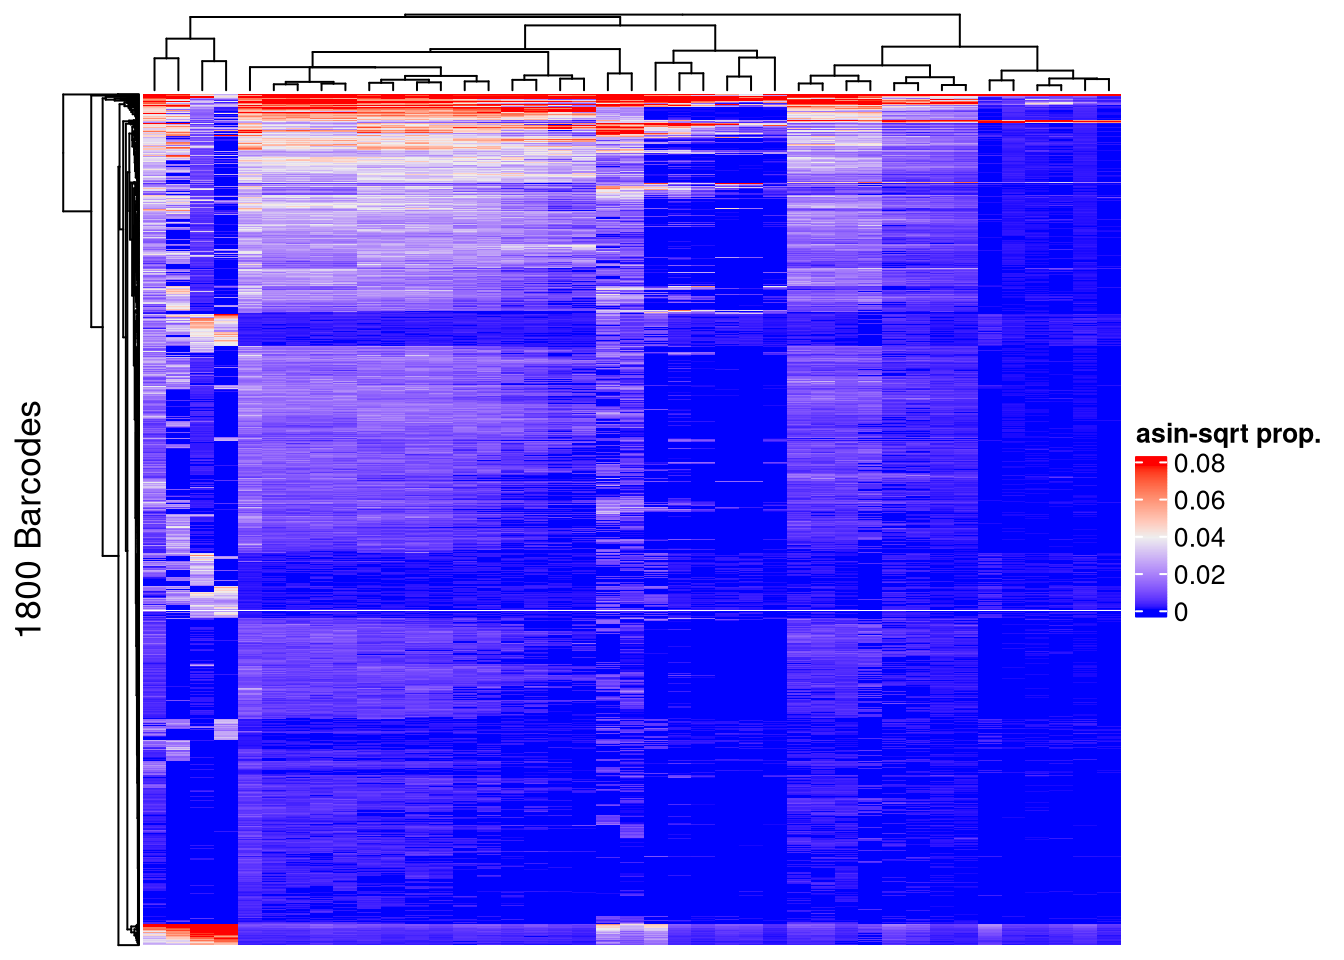
## post-filtering
Heatmap(name = "asin-sqrt prop.",
  matrix = asin(sqrt(assays(AML_top)$proportion)),
  row_title = paste0(nrow(AML_top), " Barcodes"),
  show_row_names = FALSE, show_column_names = FALSE)
The automatically generated colors map from the 1^st and 99^th of the
values in the matrix. There are outliers in the matrix whose patterns
might be hidden by this color mapping. You can manually set the color
to `col` argument.
Use `suppressMessages()` to turn off this message.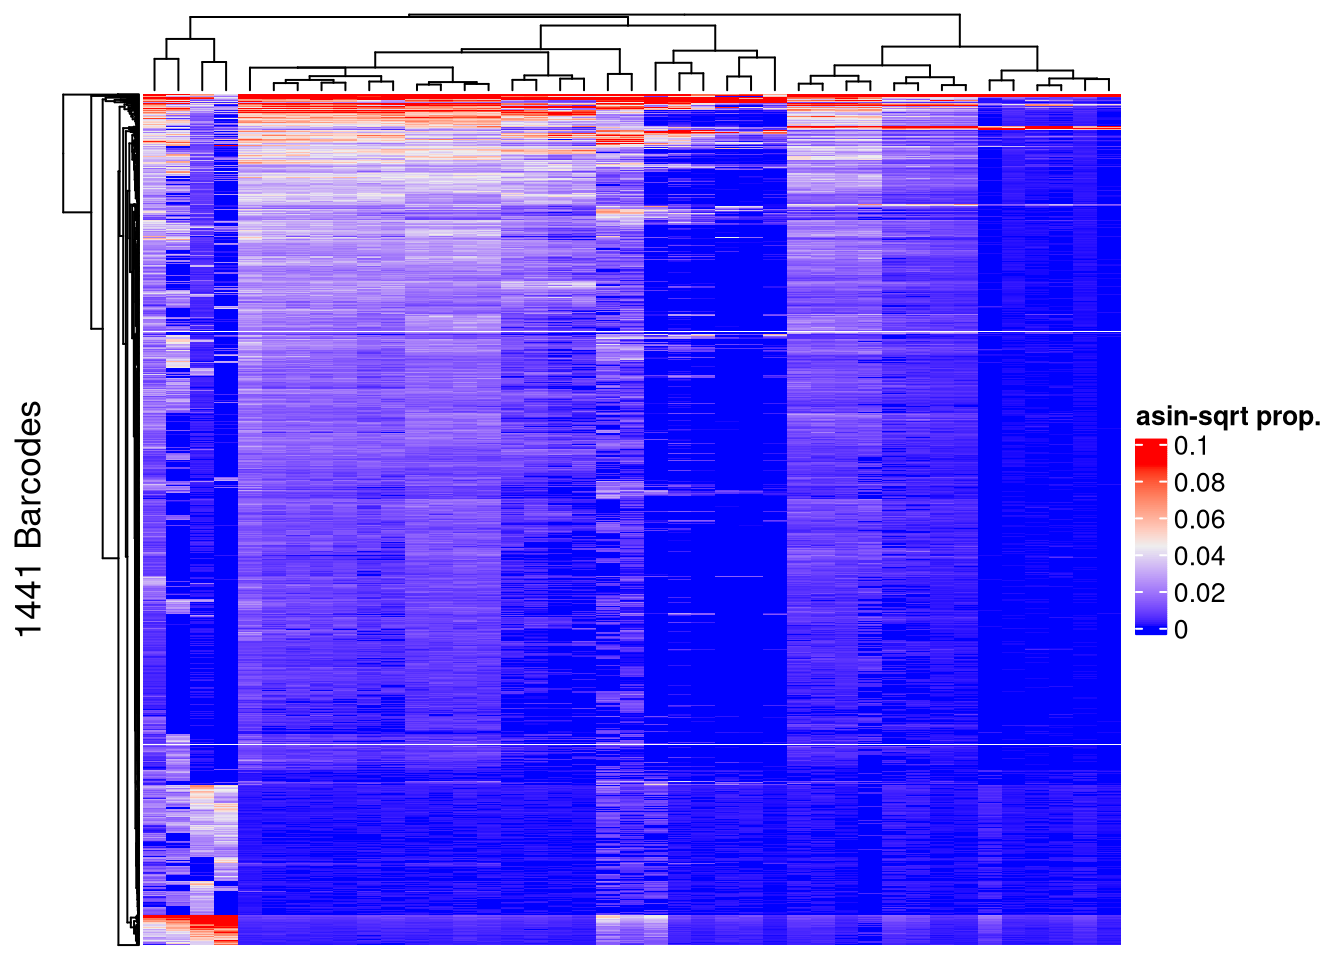
9 Save rds
save(AML, AML_merged, AML_top, file = "output/AML_barbieQ.rda")10 Top10
tagTop10 <- function(col) {
  ranks <- rank(-col)
  # summary(ranks)
  isTop <- ranks <= 10
  # summary(isTop)
  return(isTop)
}

tester <- tagTop10(assays(AML_merged)$CPM[,1])
summary(tester)
Mode FALSE TRUE
logical 1790 10 colTags <- lapply(as.data.frame(assays(AML_merged)$CPM),
function(col) tagTop10(col))
colTagMat <- do.call(cbind, colTags)
colTagVec <- rowSums(colTagMat) >= 1
summary(colTagVec) Mode FALSE TRUE
logical 1754 46 AML_merged_top10 <- AML_merged
rowData(AML_merged_top10)$isTopBarcode <- DataFrame(isTop = colTagVec)
summary(rowData(AML_merged_top10)$isTopBarcode$isTop) Mode FALSE TRUE
logical 1754 46 barbieQ::plotBarcodePareto(barbieQ = AML_merged_top10)Warning: Removed 10 rows containing missing values or values outside the scale range
(`geom_bar()`).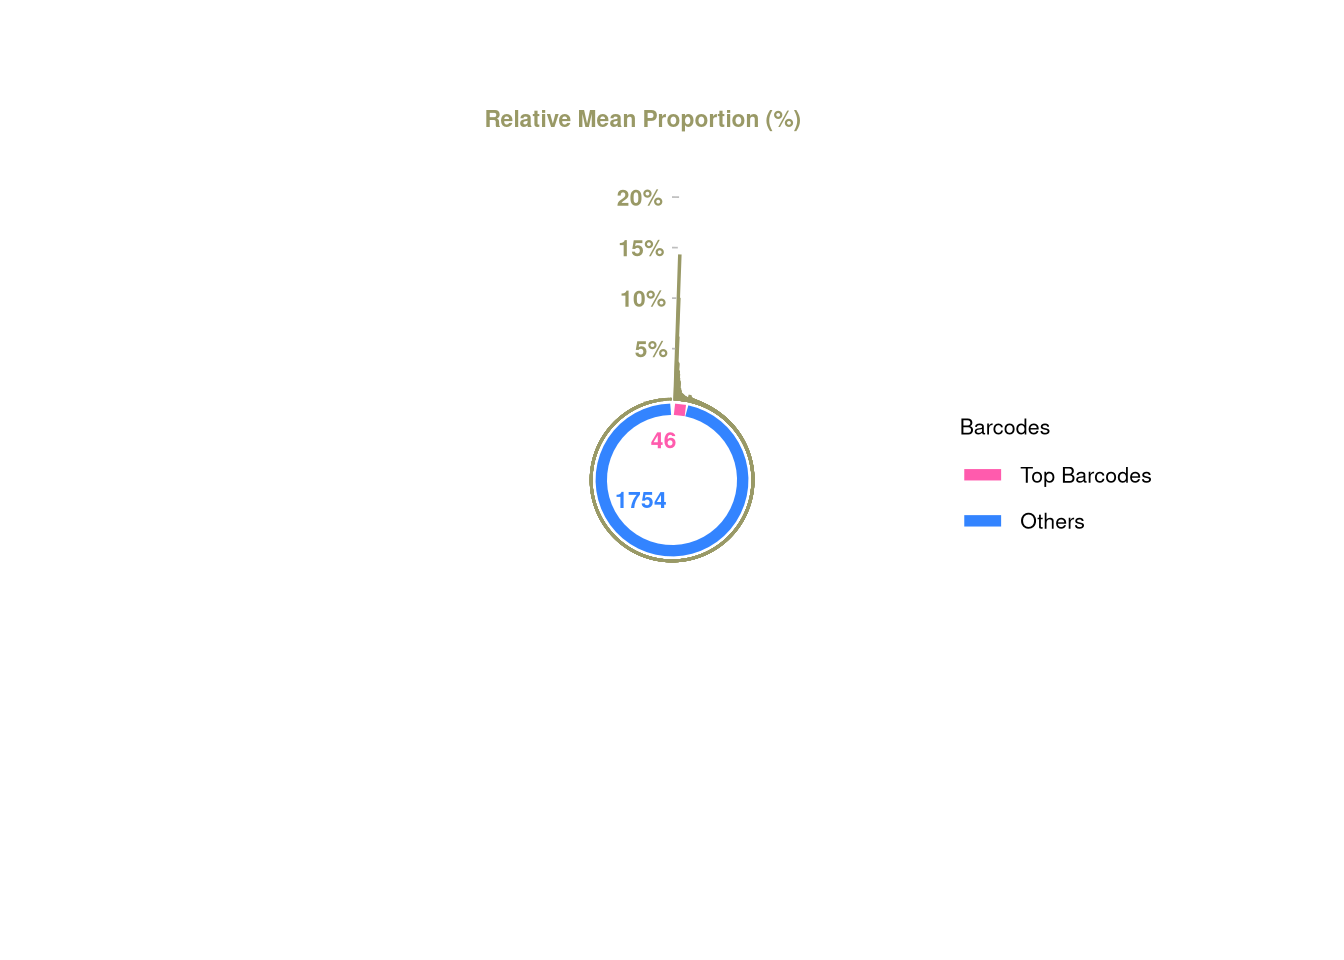
barbieQ::plotBarcodeSankey(barbieQ = AML_merged_top10)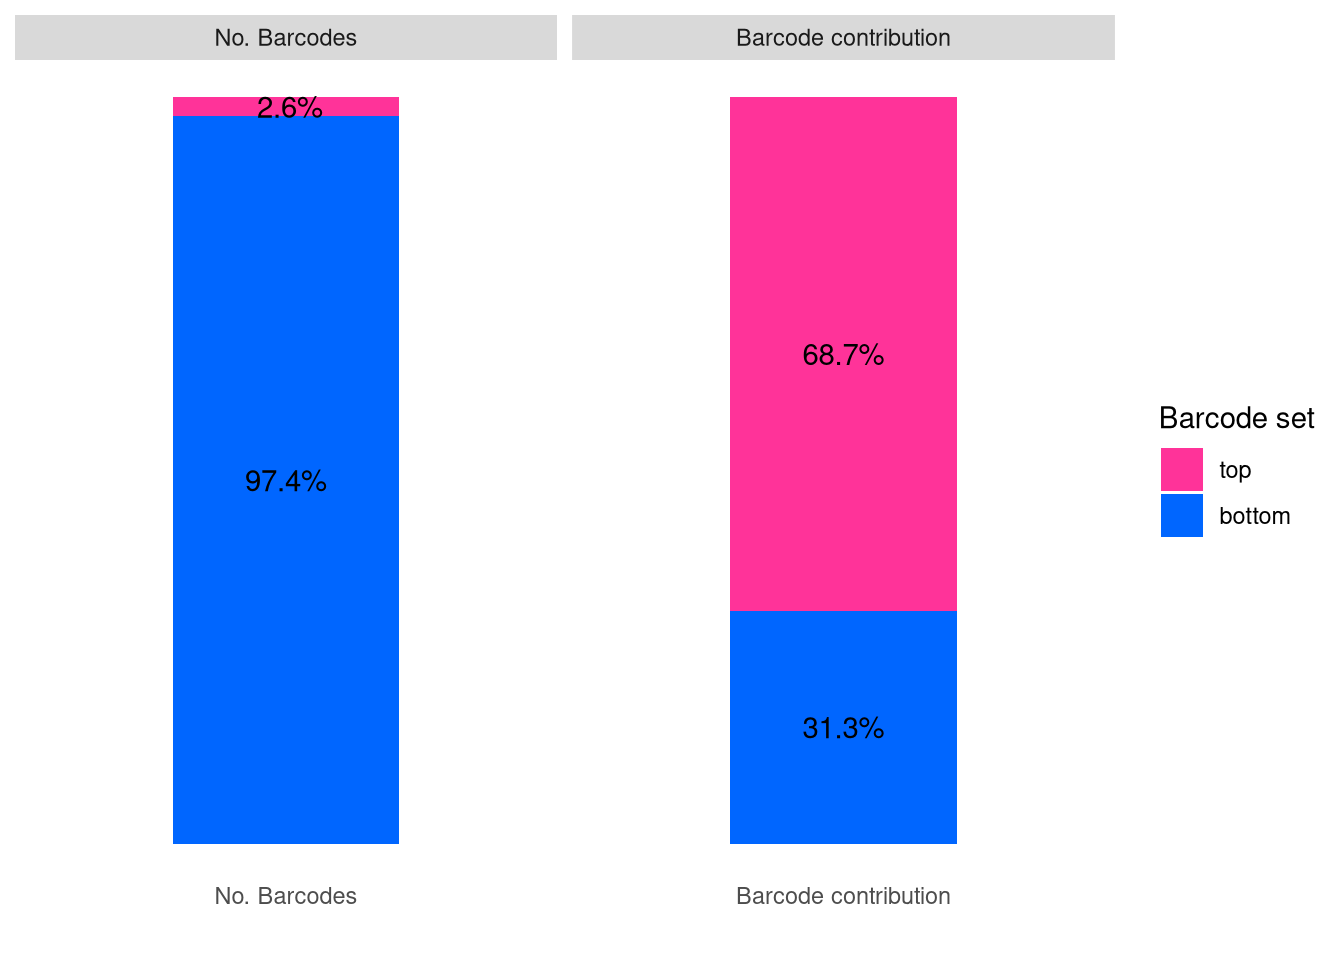
11 Save FigureS1-AML
layout = "
B
E
G
J
"
fs1_aml <- (
  wrap_elements(fs1b + theme(plot.margin = unit(c(0,0,0,0), "line"))) +
    wrap_elements(fs1e + theme(plot.margin = unit(rep(0,4), "cm"))) +
    wrap_elements(fs1g + theme(plot.margin = unit(rep(0,4), "cm"))) +
    wrap_elements(fs1j + theme(plot.margin = unit(rep(0,4), "cm")))
  ) +
  plot_layout(design = layout) +
  plot_annotation(tag_levels = list(c("B","E","G", "J"))) &
  theme(
    plot.tag = element_text(size = 20, face = "bold", family = "arial"),
    axis.title = element_text(size = 17),
    axis.text = element_text(size = 12),
    legend.title = element_text(size = 13),
    legend.text = element_text(size = 11))

fs1_aml
Warning: Removed 2 rows containing missing values or values outside the scale range
(`geom_bar()`).Warning: Removed 10 rows containing missing values or values outside the scale range
(`geom_bar()`).Warning: Removed 1 row containing missing values or values outside the scale range
(`geom_segment()`).Warning: Removed 2 rows containing missing values or values outside the scale range
(`geom_text()`).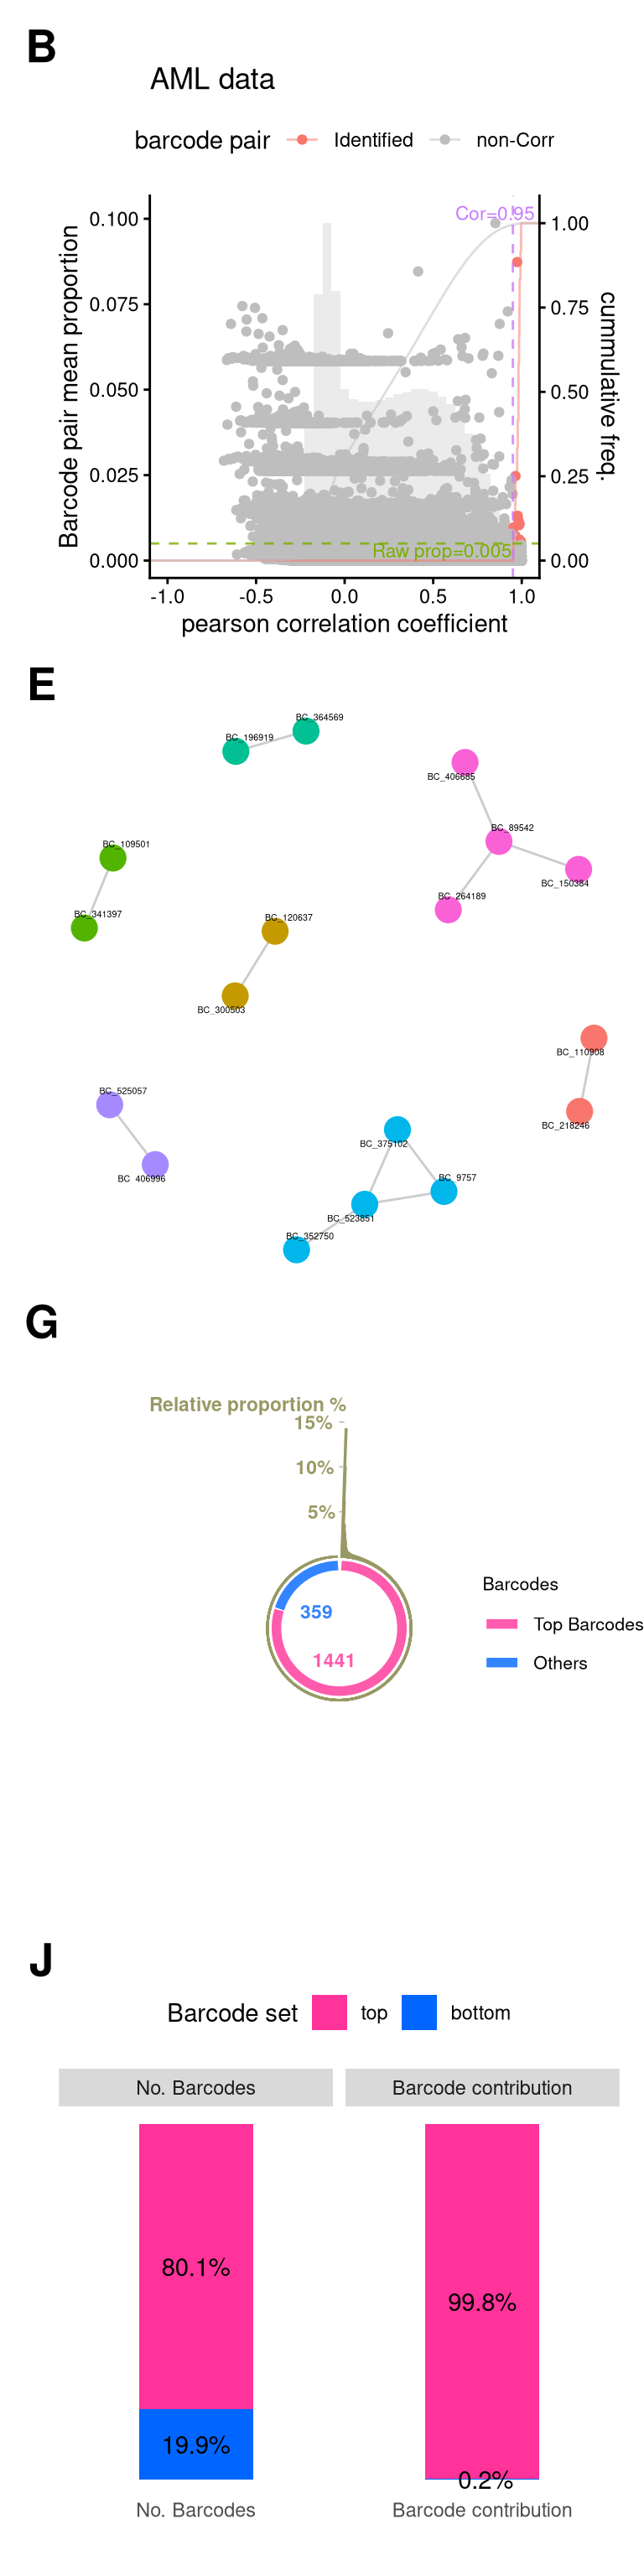
ggsave(
  filename = "output/fs1_aml.png",
  plot = fs1_aml,
  width = 4,
  height = 16,
  units = "in", # for Rmd r chunk fig size, unit default to inch
  dpi = 350
  )
Warning: Removed 2 rows containing missing values or values outside the scale range
(`geom_bar()`).Warning: Removed 10 rows containing missing values or values outside the scale range
(`geom_bar()`).Warning: Removed 1 row containing missing values or values outside the scale range
(`geom_segment()`).Warning: Removed 2 rows containing missing values or values outside the scale range
(`geom_text()`).Saving this figure in fs1_AML
sessionInfo()R version 4.5.0 (2025-04-11)
Platform: x86_64-pc-linux-gnu
Running under: Red Hat Enterprise Linux 9.6 (Plow)
Matrix products: default
BLAS/LAPACK: FlexiBLAS OPENBLAS-OPENMP; LAPACK version 3.9.0
locale:
[1] LC_CTYPE=en_AU.UTF-8 LC_NUMERIC=C
[3] LC_TIME=en_AU.UTF-8 LC_COLLATE=en_AU.UTF-8
[5] LC_MONETARY=en_AU.UTF-8 LC_MESSAGES=en_AU.UTF-8
[7] LC_PAPER=en_AU.UTF-8 LC_NAME=C
[9] LC_ADDRESS=C LC_TELEPHONE=C
[11] LC_MEASUREMENT=en_AU.UTF-8 LC_IDENTIFICATION=C
time zone: Australia/Melbourne
tzcode source: system (glibc)
attached base packages:
[1] stats4 grid stats graphics grDevices utils datasets
[8] methods base
other attached packages:
[1] barbieQ_1.1.3 devtools_2.4.6
[3] usethis_3.2.1 SEtools_1.22.0
[5] sechm_1.16.0 SummarizedExperiment_1.38.1
[7] Biobase_2.68.0 GenomicRanges_1.60.0
[9] GenomeInfoDb_1.44.3 IRanges_2.42.0
[11] S4Vectors_0.48.0 BiocGenerics_0.54.0
[13] generics_0.1.4 MatrixGenerics_1.20.0
[15] matrixStats_1.5.0 edgeR_4.6.3
[17] limma_3.64.3 ComplexHeatmap_2.24.1
[19] ggVennDiagram_1.5.4 scales_1.4.0
[21] patchwork_1.3.2 ggplot2_4.0.0
[23] knitr_1.50 tibble_3.3.0
[25] tidyr_1.3.1 dplyr_1.1.4
[27] magrittr_2.0.4 readxl_1.4.5
[29] workflowr_1.7.2
loaded via a namespace (and not attached):
[1] splines_4.5.0 later_1.4.4 ggplotify_0.1.3
[4] cellranger_1.1.0 polyclip_1.10-7 rpart_4.1.24
[7] XML_3.99-0.20 lifecycle_1.0.4 Rdpack_2.6.4
[10] formula.tools_1.7.1 doParallel_1.0.17 rprojroot_2.1.1
[13] processx_3.8.6 lattice_0.22-6 MASS_7.3-65
[16] backports_1.5.0 openxlsx_4.2.8.1 sass_0.4.10
[19] rmarkdown_2.30 jquerylib_0.1.4 yaml_2.3.10
[22] remotes_2.5.0 httpuv_1.6.16 zip_2.3.3
[25] sessioninfo_1.2.3 pkgbuild_1.4.8 minqa_1.2.8
[28] DBI_1.2.3 RColorBrewer_1.1-3 abind_1.4-8
[31] pkgload_1.4.1 Rtsne_0.17 purrr_1.1.0
[34] ggraph_2.2.2 nnet_7.3-20 yulab.utils_0.2.1
[37] tweenr_2.0.3 rappdirs_0.3.3 git2r_0.36.2
[40] sva_3.56.0 circlize_0.4.16 seriation_1.5.8
[43] GenomeInfoDbData_1.2.14 ggrepel_0.9.6 genefilter_1.90.0
[46] pheatmap_1.0.13 annotate_1.86.1 codetools_0.2-20
[49] DelayedArray_0.34.1 ggforce_0.5.0 tidyselect_1.2.1
[52] shape_1.4.6.1 aplot_0.2.9 UCSC.utils_1.4.0
[55] farver_2.1.2 lme4_1.1-37 viridis_0.6.5
[58] TSP_1.2.6 jsonlite_2.0.0 GetoptLong_1.0.5
[61] mitml_0.4-5 ellipsis_0.3.2 tidygraph_1.3.1
[64] ggbreak_0.1.6 randomcoloR_1.1.0.1 survival_3.8-3
[67] iterators_1.0.14 systemfonts_1.3.1 foreach_1.5.2
[70] tools_4.5.0 ragg_1.5.0 Rcpp_1.1.0
[73] glue_1.8.0 pan_1.9 gridExtra_2.3
[76] SparseArray_1.8.1 xfun_0.53 mgcv_1.9-1
[79] DESeq2_1.48.2 logistf_1.26.1 ca_0.71.1
[82] withr_3.0.2 fastmap_1.2.0 boot_1.3-31
[85] callr_3.7.6 digest_0.6.37 R6_2.6.1
[88] gridGraphics_0.5-1 textshaping_1.0.3 mice_3.18.0
[91] colorspace_2.1-2 RSQLite_2.4.5 data.table_1.17.8
[94] graphlayouts_1.2.2 httr_1.4.7 S4Arrays_1.8.1
[97] whisker_0.4.1 pkgconfig_2.0.3 gtable_0.3.6
[100] blob_1.2.4 registry_0.5-1 S7_0.2.0
[103] XVector_0.48.0 htmltools_0.5.8.1 clue_0.3-66
[106] png_0.1-8 reformulas_0.4.1 ggfun_0.2.0
[109] rstudioapi_0.17.1 rjson_0.2.23 nloptr_2.2.1
[112] nlme_3.1-168 curl_7.0.0 cachem_1.1.0
[115] GlobalOptions_0.1.2 stringr_1.5.2 operator.tools_1.6.3
[118] parallel_4.5.0 AnnotationDbi_1.70.0 pillar_1.11.1
[121] vctrs_0.6.5 promises_1.3.3 jomo_2.7-6
[124] xtable_1.8-4 cluster_2.1.8.1 evaluate_1.0.5
[127] magick_2.9.0 cli_3.6.5 locfit_1.5-9.12
[130] compiler_4.5.0 rlang_1.1.6 crayon_1.5.3
[133] labeling_0.4.3 ps_1.9.1 getPass_0.2-4
[136] fs_1.6.6 stringi_1.8.7 viridisLite_0.4.2
[139] BiocParallel_1.42.2 Biostrings_2.76.0 glmnet_4.1-10
[142] V8_8.0.1 Matrix_1.7-3 bit64_4.6.0-1
[145] KEGGREST_1.48.1 statmod_1.5.0 rbibutils_2.3
[148] broom_1.0.10 igraph_2.1.4 memoise_2.0.1
[151] bslib_0.9.0 bit_4.6.0